Sample Category Title
Sunset Market Commentary
Markets:
Bunds and US Treasuries traded in a sideways range in the run-up to the US CPI and retail sales data. Headline (2.1%) and core (1.8%) CPI were unchanged from December while a decline was expected. At the same time, US retail sales delivered a ' big miss' for January and a downward revision for December. (Bond) markets are currently more sensitive to inflation rather than to activity data. US yields jumped higher even as risk sentiment turned negative. In volatile trade, US yields are rising up to 7bps+ with the belly of the curve underperforming (5y + 7.3 bps; 2yr +5.1 bps). German bunds outperform, with yields rising between 1 and 2 bps. 10-y intra-EMU spreads are little changed with Portugal outperforming (-4 bps) and Greece still underperforming (+10 bps).
Dollar weakness still dominated FX trading in Asia. EUR/USD trended to the high 1.23 area. USD/JPY dropped temporary below 107. Calm returned during the European morning session. The dollar rebounded off the overnight lows as investors awaited the US CPI and retail sales data. The data brought the worst possible outcome from a market point of view. Inflation printed higher than expected. Both core (1.8% Y/Y) and headline (2.1%) inflation were unchanged from December while a decline was expected. At the same time, retail sales unexpectedly declined. US yields rose and equities nosedived. The data were also mixed for the dollar, but the inflation story dominated. The dollar gained a few ticks against the yen, but the risk-off sentiment blocked any sustained gains. USD/JPY trades again in the low 107 area. EUR/USD spiked temporary below 1.23, but the jury is still out whether there is room for further USD gains. Key question now is whether today's data mark the start of another risk-off correction and whether this will be supportive for the dollar (ex USD/JPY). EUR/JPY is also nearing the key 132/131 support area.
There were no important eco data in the UK. EUR/GBP traded with a slight upward bias near 0.89. Around noon, sterling lost slightly ground as the headlines of the 'Road to Brexit' speech of Boris Johnson hit the screens. Johnson's speech didn't bring much clarity on what the EU-UK relationship should look like after Brexit. He indicated that the UK should have the right to make its own rules and he also downplayed the benefits of being member of the single market/customs union. EUR/GBP filled offers in the 0.8920 area on the Johnson headlines, but a break of the 0.8928 intermediate resistance didn't occur. EUR/GBP trades in the 0.89 area. Cable trades in the mid 1.38 area.
News Headlines:
The Swedish Riksbank kept its policy rate unchanged at -0.50% and said it still expected to start hiking from the second half of 2018, despite slightly downgrading 2018/2019 inflation forecasts. One policymaker broke ranks and said they should be raised immediately.
EMU Q4 GDP growth was confirmed at 0.6% Q/Q and 2.7% Y/Y. December industrial production rose more than forecast, by 0.4% M/M and 5.2% Y/Y, while November readings faced an upward revision (to 1.3% M/M & 3.7% Y/Y).
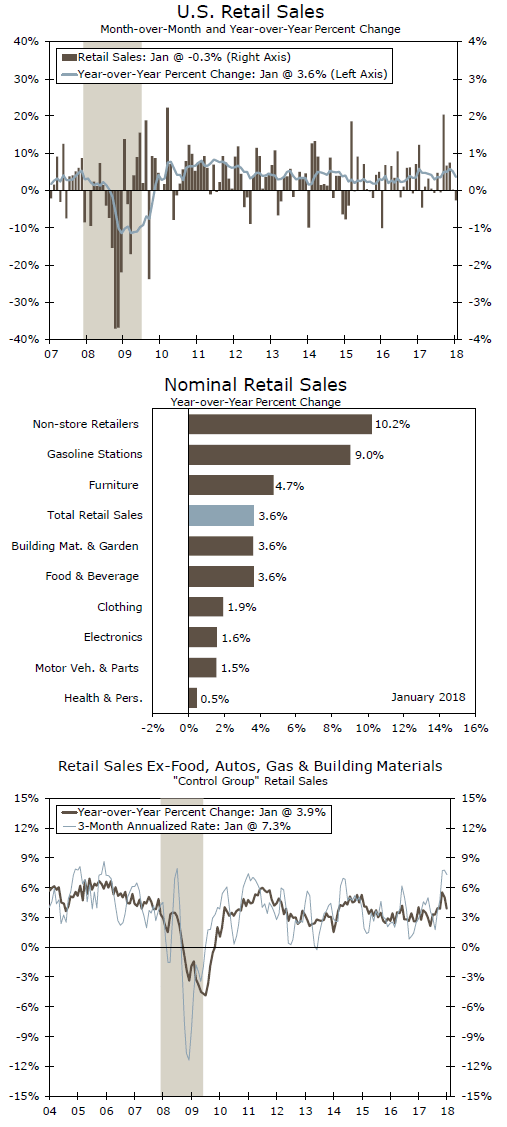
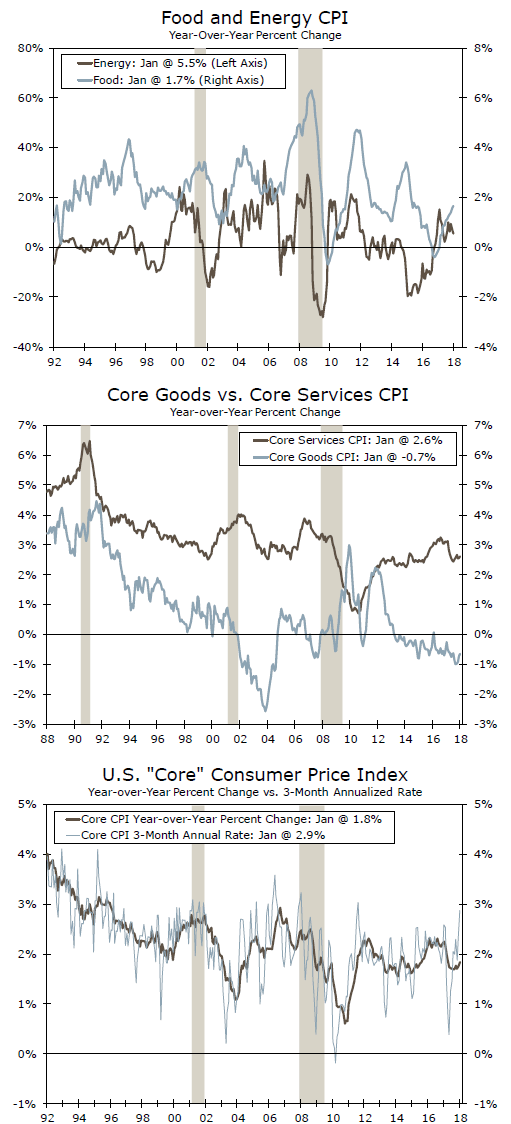
US January inflation was substantially higher than expected. Headline inflation rose 0.5% M/M and 2.1% Y/Y (0.3% M/M and 1.9% Y/Y was expected). Core inflation was also above consensus at 0.3% M/M and 1.8% Y/Y. At the same time, January retail sales unexpectedly declined 0.3% M/M. A rise of 0.2% was expected. The December figure was also downwardly revised. Core measures of the report were also well below consensus. The combination of higher inflation and disappointing retail sales triggered a spike lower in US equity futures. In volatile trade, US indices opened about 0.5% lower, but for now there are no follow-through losses.
Retail Sales: Let’s Recap! Not as Rosy as Originally Reported
Retail sales dropped 0.3 percent in January. Markets were expecting a 0.2 percent increase. Furthermore, control group sales were revised down from an increase of 0.3 percent to a drop of 0.2 percent in December.
Disappointing Start to the Year for Retail Sales
Retail sales disappointed at the start of 2018 by dropping 0.3 percent while markets were expecting them to grow 0.2 percent. Excluding automobile and gasoline stations' sales, retail sales were down 0.2 percent versus market expectations of a 0.3 percent increase. December's 0.4 percent increase for the overall index remained unchanged, but retail sales ex-automobile sales was revised down from an increase of 0.4 percent to just 0.1 percent.
Even the 1.6 percent increase in gasoline stations' sales was not enough to push retail sales higher in January. The biggest culprits for the decline in retail sales during the month was a 1.3 percent decline in motor vehicle & parts dealers' sales; a 0.4 percent decline in furniture & home furniture stores' sales; a 2.4 percent drop in building material & garden equipment & supplies dealers' sales; a 1.2 percent decline in health & personal care stores' sales and a 0.8 percent decline in sporting goods, hobby, book & music stores' sales.
Growth sectors were sales at electronics & appliance stores, up 0.5 percent, clothing & clothing accessories stores' sales, up 1.2 percent and miscellaneous store retailers' sales, which increased 1.6 percent. Even the "mighty" nonstore retailer sector had issues in January, as it posted flat month-on-month growth. Meanwhile, on the service side of the report, food services & drinking places was also flat in January.
Although we were expecting a relatively strong performance for retail sales in January following the strong end of 2017 performance for the sector, it is relatively clear that there may once again be some seasonal factors at play. This is something that has been a staple for the first quarter economic numbers since the recovery from the Great Recession.
Revision to December Control Group Sales
Control group sales, which are the part of the retail sales report that go directly into the calculation of GDP, was flat in January while markets were expecting a strong 0.4 percent increase. However, the bad news is that inflation was also very strong in January while it was revised up for December. Furthermore, the strong downward revision to control sales for December, which were originally reported up 0.3 percent and were revised down to a decline of 0.2 percent, will probably make analysts revise down the strong print for personal consumption expenditures in the final quarter of 2017.
We remain positive on the consumer this year even though the first look at consumption in January was not what we were expecting. As we have pointed out before, perhaps the biggest risk for consumers, as well as for the U.S. economy this year, is higher inflation, which has the potential to cut into the purchasing power of income and push consumers to the sidelines. For now, credit is flowing and consumers are using it.
Retail Sales Start the Tear on the Back Foot
Retail sales fell 0.3% in January according to the advance Census Bureau report – well shy of expectations for a 0.2% rise.
Sales at gasoline stations rose by 1.6%, but the gain was more than offset by a 1.3% decline at motor vehicle & parts dealers. Excluding autos and gas, retail sales were down by 0.2% on the month, widely missing the expected 0.5% gain.
After several strong months, spending on building materials (-2.4%) pulled back. This decline was only half made up for by a 0.7% rise in spending at restaurants and bars. Excluding gas, autos, building materials, and food services, the so-called 'control group' used in calculating GDP was flat on the month – shy of the 0.5% gain expected. Gains in the control group were led by miscellaneous (+1.6%), clothing (+1.2%) and electronics (+0.5%). On the other hand, health & personal care (-1.2%), sporting goods (-0.8%) and furniture (-0.4%) noted declines. Most other categories were little changed.
Key Implications
This was not the kind of report we were expecting. After a string of solid retail spending reports to cap off 2017, the decline in January is a bit of a headscratcher. The latest figures point to a weaker performance of consumer spending in the first quarter – around 2.4% (down from 2.8%), with the downgrade flowing through to real GDP, which is expected to increase by around 2.5%.
The one encouraging factor was that the entire decline was attributed to a single category: autos. But, sales at motor vehicle dealers have been declining due to the dissipation of the boost related to replacement of damaged/destroyed vehicles during Harvey and Irma. The same can be said for building materials and furniture, which were previously boosted by replacement. From that standpoint, the pullback is natural and not overly alarming. The fact that many discretionary spending categories saw gains offers further evidence that the decline is transitory and not the beginning of a new trend.
Ultimately the January decline in retail sales appears to be more of a transitory blip, with spending likely to return to a stronger performance in the following month. This is especially the case given the strong payroll growth, rising wages, and and tax reform that will leave more disposable income in consumers' pockets.
CPI: Reflation Is Upon Us
Inflation is strengthening, as evidenced by the solid gains in headline and core CPI in January. Core inflation is rising at a 2.9 percent pace over the past three months and will lead to further Fed hikes in the coming months.
Rising Costs of Consumer Staples
Consumer price inflation is turning up again. The CPI advanced ahead of expectations in January, rising 0.5 percent. That pushed inflation up 2.1 percent from a year earlier, but prices over the past three months have increased at a 4.4 percent annualized rate.
Headline inflation was lifted by higher energy costs in January. Gasoline prices rose 5.7 percent, which more than offset a 0.8 percent pullback for energy services even as colder weather gripped more populated parts of the country. The rebound in oil prices over the past couple years has been an important factor pulling inflation higher; the energy index is up 5.5 percent since last January.
Food prices have been less supportive of the pickup in inflation, but prices are also moving higher. Grocery prices increased 0.1 percent, which was enough to push the year-over-year rate to its highest reading since early 2015. Food away from home posted an even larger gain of 0.4 percent, as higher labor costs finally look to be pushing restaurants to raise prices.
Has Pricing Power Finally Arrived?
The real strength in today's report came from the core index, where prices rose 0.3 percent. That was the largest gain since last January. Core goods prices rose for a second consecutive month amid a rebound in apparel and used vehicle prices. Services posted widespread gains, led by higher medical and insurance costs.
In recent years, January readings of core inflation seemed to get a bump from "residual seasonality" (the inability for adjustments to fully account for typical seasonal patterns). However, updated seasonal factors released last week better capture the tendency for firms to raise prices early in the year. Therefore, we are more inclined to take today's increase at face value as a sign of genuine strengthening in inflation.
Over the past year, core inflation has increased 1.8 percent. That is unchanged from December, but the recent trend is stronger. Over the past three months, core CPI has increased at a 2.9 percent annualized rate, suggesting the year-over-year rates will be picking up in the coming months. We look for core CPI to move back up to 2 percent on a year-ago basis as early as March, when last year's drop in cell phone services makes for an easier base comparison.
The core PCE deflator, more closely watched by the Fed, will take longer to return to 2 percent, but should also rise in the coming months. Even though core PCE will still be undershooting the FOMC's target in the coming months, the upward trend should be enough for the Fed to continue on with its tightening campaign. We continue to look for the FOMC to raise rates in March, followed by two additional hikes later in the year.
Inflation Pressures Perking up in U.S. Economy
The headline consumer price index (CPI) jumped 0.5% in January. That left inflation on a year-on-year basis at 2.1%, steady versus December.
Higher energy prices contributed to the pop in the headline (+3.0% m/m). An increase in the gasoline index (+5.7%) offset declines in other energy components. Food prices rose 0.2% on the month.
Core inflation posted a hearty 0.3% monthly gain. Along with shelter (+0.2%), apparel (+1.7%), and medical care (+0.4%), the indexes for motor vehicle insurance (+1.3%), personal care (+0.5%), and used cars and trucks (+0.4%) also rose in January. The indexes for airline fares and new vehicles were among those that declined over the month.
Despite the hearty monthly gain, unfavorable base effects kept the year-on-year pace of core inflation at 1.8%, unchanged from December. Core inflation has hovered in the 1.7-1.8% range for nine consecutive months now.
Key Implications
Today's report should give more confidence that inflation pressures are perking up in the U.S. economy. Core inflation may be below 2% for now, but that in part is due to comparisons to hot inflation readings at the beginning of 2017. Even modest increases in core inflation over the next couple of months will see it rise above two percent.
While there were some sizeable jump ups in categories like apparel, which are unlikely to be repeated in February, more persistent categories of services inflation are starting to show upward momentum. That gives us greater confidence that inflation pressures are likely to be sustained.
Inflation has been the missing piece in the puzzle for rate hikes over the past several months, which had led some members of the FOMC to dissent on rate hike decisions over the past year. Today's report increases our confidence that the Fed will raise rates in March.
US January Consumer Price Inflation Moves Higher in the Month
Highlights:
- All items CPI rose 0.5% month-over-month which was up from a 0.2% gain in December and compared to market expectations of a 0.3% monthly increase. A 5.7% expected jump in gasoline prices was a main contributor to the sizeable monthly increase.
- A stronger-than-expected 0.3% increase in core prices was also a key factor sending the overall monthly increase higher. The January gain followed a 0.2% increase in December with expectations of that monthly increase being maintained in January.
- The stronger-than-expected monthly gain contributed to the overall year-over-year rate remaining unchanged at 2.1%.
- The annual increase in core prices remained unchanged as well at 1.8%.
Our Take:
The January CPI report indicated consumer prices rose a stronger than expected 0.5% in the month. This report will likely abet financial market concerns about rising inflation pressures that emerged last week with wage inflation rising at a pace not seen since 2009. Indications of incipient wage pressures reinforced the view that labour markets are operating beyond capacity with a current unemployment rate of 4.1%. Confirmation of tightening labour markets made an even stronger case for the Fed to continue to tighten policy which weighed on financial markets. Today's inflation report will raise concerns that this wage pressure is starting to seep into consumer prices. It is the case that the year-over-year rate for core prices remained unchanged at 1.8% and thus below the Fed's inflation objective of 2%. However, the 6-month average price gain for core consumer prices has jumped to 2.6% from 2.2% in December. This pressure in conjunction with indications of potential wage pressures emerging are expected to keep the Fed tightening. Our forecast assumes that the central bank will raise the fed funds range by 25 basis points at the March FOMC meeting to 1.50% to 1.75%. The tightening is expected to continue through the forecast with similar-sized hikes expected each quarter through the end of 2019 resulting in the fed funds range finishing next year at 3.25% to 3.50%.
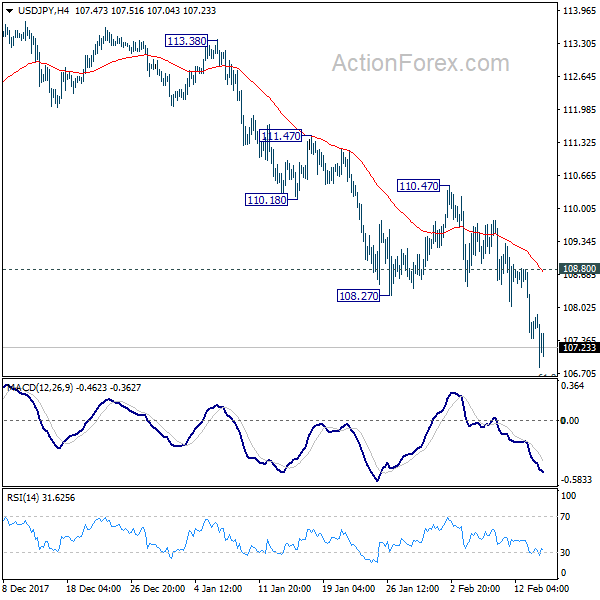
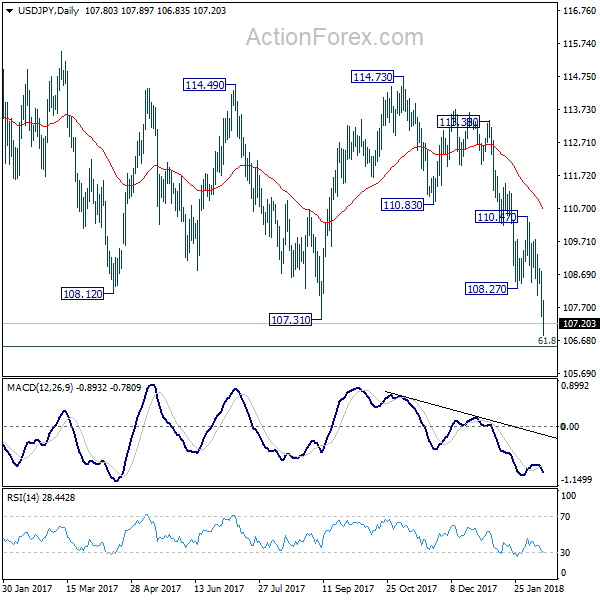
USDJPY – Limited Reaction on Upbeat US Inflation Numbers Keeps Bearish Bias Intact
The pair showed limited reaction on upbeat US inflation data today, as the dollar jumped to 107.53 but quickly fell back, erasing all post-data gains. Unlike from other major currency pairs where the greenback advanced strongly, USDJPY's reaction was mild. Better than expected inflation numbers in January and underlying inflation showing the biggest gains in a year, would further boost expectations for Fed's more aggressive approach towards the monetary policy this year and likely prompt the central bank for more rate hikes than planned. Stronger dollar after release of key data pushed stocks lower, which boosted yen and limited dollar's rally, while Japanese currency also advanced against other major counterparts, registering fresh gains against the Euro and British Pound. USDJPY's near-term outlook did not change significantly after strong US data, maintaining bearish bias after rather mild 106.83/107.50 correction (106.83 is new 15-month low posted overnight while 107.50 is the highest traded after release of US CPI data). Fresh easing cracked 107.00 figure and pressured support at 106.83, eyeing target at 106.51 (Fibo 61.8% of 98.99/118.66, Jun/Dec 2016 rally). Initial resistance lies at 107.53 (post data/European session high), followed by session high at 107.90 which guards former low and key support at 108.28, where stronger upticks should be capped.
Res: 107.53; 107.90; 108.28; 108.87
Sup: 106.99; 106.83; 106.51; 106.00

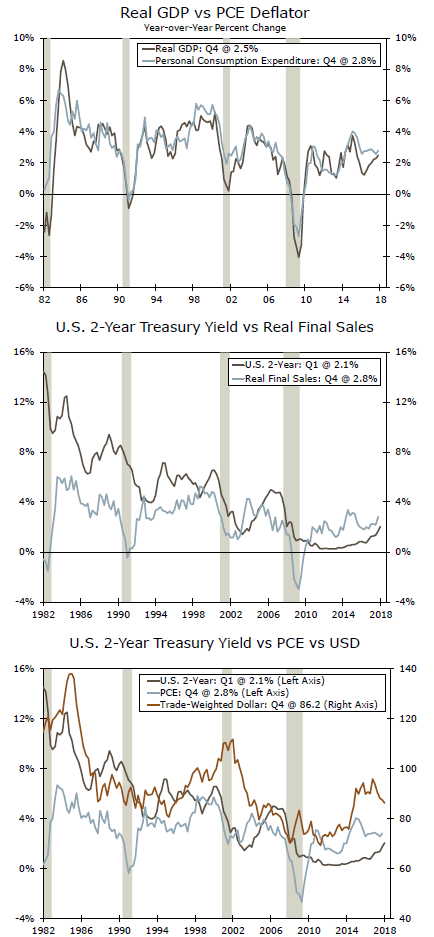
Price Determination: A Web of Interactions
One of the fascinations about economics and finance is the matrix of interactions among prices. For some time now, we have focused on the interaction of prices for goods, capital and exchange rates.
Growth and Goods Inflation: One Way Link
When we first examine the pattern of goods prices, one driver is the growth of GDP. GDP has a one-way causal link to the PCE deflator (top graph). As would be expected in the short-run, stronger economic growth tends to raise the rate of inflation as resource utilization increases, thus driving prices higher.
However, there is a problem: the PCE deflator is a mean reverting series but has an autocorrelation problem. That is, the process of the series returning to its long-run mean is painfully slow. The autocorrelation problem suggests that if the PCE deflator series deviates from the long-run mean, then the series will take an extended period of time to return to the mean. Unfortunately, the same conclusion is true for the core PCE deflator series as well. In fact, both series have, to some extent, shifted downward in the last decade. The average for the 2009-2017 period is just 1.3 percent for the PCE deflator and 1.5 percent for the core PCE deflator.
Domestic Demand and the Price of Capital
A second critical price in the economy is the cost of capital, i.e., interest rates. Consider the relationship in the middle graph between real final sales and the two-year Treasury rate. Here, real final sales have a one-way causality link to the two-year benchmark Treasury rate. This may not be surprising in recent months as the rise in economic strength has been accompanied by a rise in the two-year rate. However, this relationship is based upon data over the entire 1982-2017 period—not upon a short/one-time phenomenon.
The real final sales series underwent a downward break in October 2008 so that the period of "low" interest rates since then is perfectly consistent with the downward shift in its driver—real final sales.
Completing the Web: Dollar, Rates and Inflation
Interrelationships between economic and financial factors are fascinating. Consider that both the US dollar and the two-year Treasury rate have oneway causality link to inflation. That is, both the dollar and the two-year Treasury rate influence the behavior of the PCE deflator but the deflator does not drive the behavior of the dollar nor the two-year rate. Yes, there is some influence as you might expect but the link is not statistically significant and thereby unreliable in the forecasting sense.
For the PCE, growth in GDP is the main driver. For our work, the link from the dollar and the two-year Treasury to inflation reinforces our imperative to focus on a broader model of economic behavior than the linear nonrecursive behavior that so dominates popular commentary. Moreover, these statistical results remind us to focus on the significant links and not be distracted by the myriad of minor forces in the economy.
USD/JPY Mid-Day Outlook
Intraday bias in USD/JPY remains on the downside for the moment. Current fall should extend to 106.48 fibonacci level. We'd look for strong support around there to bring rebound. However, on the upside, break of 108.80 minor resistance is needed to be the first sign of short term bottoming. Otherwise, outlook will remain bearish in case of recovery.
Daily Pivots: (S1) 107.22; (P) 107.99; (R1) 108.59; More...
Intraday bias in USD/JPY remains on the downside for the moment. Current fall should extend to 106.48 fibonacci level. We'd look for strong support around there to bring rebound. However, on the upside, break of 108.80 minor resistance is needed to be the first sign of short term bottoming. Otherwise, outlook will remain bearish in case of recovery.
In the bigger picture, current development argues that the corrective pattern from 118.65 is extending. There is risk of dropping further to 61.8% retracement of 98.97 to 118.65 at 106.48. But this level should provide strong support to contain downside and bring resumption of rise from 98.97. However, sustained break of 106.48 will now likely send USD/JPY through 98.97 to resume the corrective fall from 125.85 (2015 high).
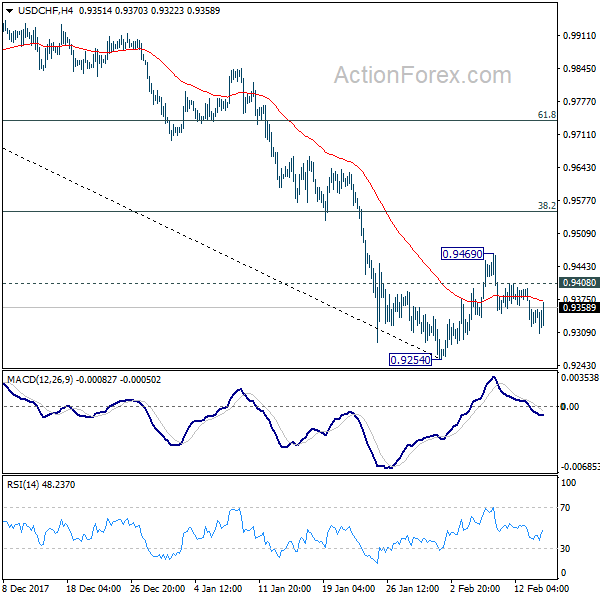
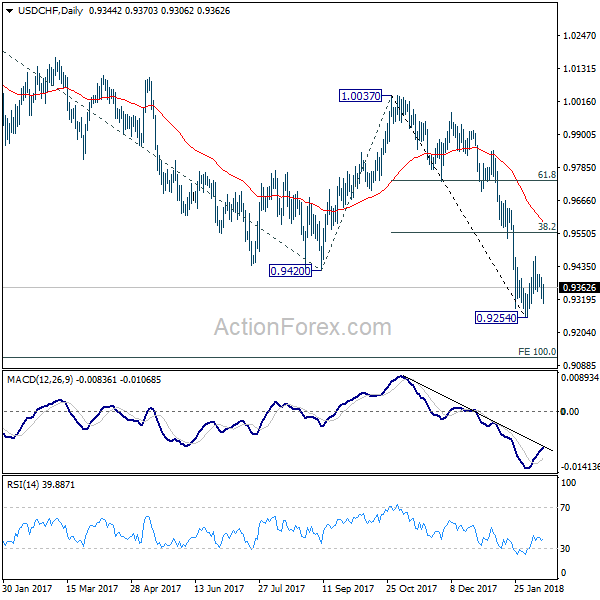
USD/CHF Mid-Day Outlook
Daily Pivots: (S1) 0.9315; (P) 0.9356; (R1) 0.9391; More...
With 0.9408 minor resistance intact, fall from 0.9469 is in favor to extend to retest 0.9254 low. Break will resume larger down trend to next projection level at 0.9115. Above 0.9408 would bring stronger rise through 0.9469. However, note again that there is no sign of trend reversal yet. We'd be cautious on strong resistance from 38.2% retracement of 1.0037 to 0.9254 at 0.9553 to limit upside and bring down trend resumption.
In the bigger picture, fall from 1.0342 is developing into a medium term down trend. Deeper decline should be seen to 100% projection of 1.0342 to 0.9420 from 1.0037 at 0.9115. Break will target 161.8% projection at 0.8545. In any case, sustained trading above 55 day EMA is needed to be the first sign of medium term reversal. Otherwise, outlook will stay bearish even in case of strong rebound.