Sample Category Title
Sunset Market Commentary
Markets:
We can be rather brief about today's trading session on core bond markets. Both the Bund and the US Note future hovered near opening levels with US Treasuries underperforming as the US House passed a two-yr budget bill and ended a brief government shutdown. The eco calendar was empty and risk aversion on European stock markets had little spill-over effects. US yields add 1.5 bps (2-yr) to 2.9 bps (10-yr) at the time of writing. The German yield curve bull flattens with yields declining by 0.7 bps (2-yr) to 3.3 bps (30-yr). On intra-EMU bond markets, 10-yr yield spread changes versus Germany widen up to 4 bps (Italy) with Portugal (+7 bps) and Greece (+28 bps) underperforming.
The dollar developed a similar indecisive trading pattern as was the case yesterday. EUR/USD hovered up and down in the 1.22 big figure. The dollar slightly outperformed the single currency this morning as risk sentiment remained very fragile. However, it was insufficient for the dollar to make a decisive step higher. Later in the session, the dollar ceded again slightly ground as global equity selling eased, at least temporary. EUR/USD trades in the 1.2265 area. USD/JPY hovers around 109. There were no important eco data to guide USD trading. Developments on interest rate markets/interest rate differentials also failed to provide a clear directional driver for USD trading. USD traders still don't really know how to adapt USD positions in the wake of the recent spike in global volatility.
Sterling strengthened temporary yesterday as the BoE signaled that it might raise rates at a faster pace than anticipated until now. However, the gains could not be sustained. Overall risk-aversion and lingering uncertainty on Brexit kept investors cautious to add sterling long exposure. The sterling positive momentum dwindled further today. UK eco data were mixed. Production suffered from a (temporary ) shutdown in an oil pipeline. The UK trade deficit was also wider than expected. Sterling started a new gradual downleg after the data. The decline accelerated around noon as EU's Barnier warned Britain that a post-Brexit transition period is not a given. The comments are another indication that Brexit negotiations are proceeding on a bumpy road. EUR/GBP spiked higher in the 0.88 big figure (currently 0.8875). Cable tumbled temporary below 1.38, but rebounds slightly as the dollar regained some ground this afternoon (currently 1.3840 area).
News Headlines:
The US Congress ended a brief government shutdown by reaching a wide-ranging deal that is expected to push budget deficits into the $1 trillion-a-year zone. The bill passed by a wide margin in the Senate and survived a rebellion of conservative Republicans in the House of Representatives thanks to the support of some Democrats. President Donald Trump signed the measure into law on Friday morning.
Norway's economic recovery continued in the fourth quarter led by rising consumer spending and investments. Mainland economic growth, which excludes oil and shipping, expanded by 0.6% Q/Q. At the same time, January CPI was reported soft at 1.6% Y/Y. Core inflation even slowed to 1.1% Y/Y, raising questions on whether the Norges bank will raise rates this year. The Norwegian Krone came under further pressure. EUR/NOK jumped to the 9.87 area.
A post-Brexit transition period is "not a given", the European Union's Brexit negotiator Michel Barnier warned Britain, saying London had raised "substantial" issues with the plan proposed by the bloc.
British industrial output declined 1.3% M/M in December due to the temporary shutdown of a major oil pipeline, but growth in manufacturing (0.3% M/M and 1.4% Y/Y) pointed to solid growth at the end of 2017.Construction output also showed a surprise surge in December. At the same time, ONS data showed Britain's goods trade deficit widened more than expected to 13.6 billion pounds in December, due to rising crude oil prices and higher imports.
Canada’s Long Streak of Job Gains Finally Ended in January
Highlights:
- Employment fell 88k in January marking the first drop in 18 months.
- Part-time employment plunged 137k and full time jobs rose 49k.
- The unemployment rate ticked up to 5.9% but was still down 0.8% from a year ago.
- Wage growth strengthened to 3.3% on a year-over-year basis - in part because of a large minimum wage hike in Ontario.
Our Take:
Employment plunged 88k in January, bringing an end to an impressive 17-month long streak of gains - the longest such stretch in 17 years - in what is normally a very volatile measure. The monthly drop in headline employment is eye-catching but still only retraced about 60% of the 146 increase over just the last two months. Other details also weren't as bad as the headline employment drop might suggest. Part-time employment dropped a whopping 137k - the largest one-month decline on record - but full-time jobs rose 49k. The unemployment rate ticked up to 5.9% but that was still just slightly above the 5.8% in December that matched the lowest reading on record since 1976. The rate is still down almost a percent from a year ago and more than that if sources of 'hidden' unemployment like discouraged workers are included. Indeed, by our calculations, the Bank of Canada's closely-watched 'LMI' composite labour market indicator appears to have ticked modestly lower in January - consistent with further underlying labour market improvement. Permanent employee wage growth accelerated to 3.3% year-over-year in January. That was probably in part related to a big hike in the minimum wage in Ontario although wages also appeared to accelerate somewhat on balance in other provinces.
Broadly speaking, we don't expect the 36k average monthly employment gain last year to be repeated, and today's report does not change our view that labour markets will nonetheless continue to tighten.
Canada’s Labour Market Winning Streak Ends in January, as the Economy Sheds 88k Jobs
Canada shed 88.8k positions in January, ending the economy's 17-month streak of job gains.
Losses were concentrated in part-time jobs, which fell a staggering 137k. Full-time jobs, on the other hand, were up a healthy 49k.
Despite the magnitude of decline, the unemployment rate edged up just a notch to 5.9% (from 5.8%), as 73.7k people left the labour force. As a result of the exodus, the participation rate ticked down to 65.5% (from 65.8%).
Both public and private sectors shed jobs in the month, with public employment down 41.2k and private-sector jobs down 70.7k. Self-employment bucked the trend, adding 23.9k positions.
Good-producing industries shed 16.2k positions, led by construction (-14.9k). Manufacturing employment, on the other hand, edged up 0.8k. Service-producing employment fell 71.9k, with losses relatively widespread across sectors. Surprisingly perhaps, trade (wholesale and retail) were not major contributors (down just 0.8k).
Regionally, losses were relatively widespread, and gains relatively minimal. Ontario was the biggest loser in January, shedding 50.9k jobs in the month. Despite the drop, Ontario's unemployment edged down ever so slightly (to 5.5%) as 54.8k people left the labor force. In Quebec, employment fell 17.3k and the unemployment rate reversed the prior month's decline, moving back up to 5.4% (from a record-low of 5.0% in December).
Wage growth accelerated in the month to 3.3% (from 2.8% in December).
Key Implications
You win some, you lose some. After a record-breaking string of gains, Canada's job market was due for a pullback. This is a big number on the surface, but so were the gains over the previous several months.
All told, this does not change the story for the Canadian economy much. The unemployment rate is still low with the economy remaining close to full employment.
Wage growth heated up this month but did not accelerate to the pace expected given the minimum wage legislation being implemented in Ontario. Still, more gains may be on the way in the months ahead, with the metric likely to be closely watched going forward.
This report does not much change the outlook for the Bank of Canada, but suggests a more rationale pace of job growth consistent with an economy that is moving toward a more neutral pace of growth after a very robust year.
GBPJPY Plunges Near 2-Month Lows
GBPJPY has plunged sharply lower since Wednesday, almost reaching a two-month low near the 150.00 strong psychological level. Meanwhile, the price has been developing within an upward sloping channel since September, while in the short term technical indicators support a bearish picture.
From the technical point of view, the market could increase negative momentum in the short term. The Relative Strength Index (RSI) is sloping down in the negative territory approaching the oversold area, while the MACD oscillator is holding in the bearish area and is on track to break below its signal line.
If price action remains negative, the next level to have in mind is the 149.40 support level. A slip below the aforementioned level could open the door for the key barrier of 149.00.
On the flip side, if the price creates a bullish movement, then the focus could shift to the upside towards the 23.6% Fibonacci retracement level around 151.60 of the up-leg from 135.50 to 156.60. If this level is breached, it could increase bullish pressure until the price touches the 154.00 psychological barrier.
GBPUSD Strongly Bearish Below 1.3892 Level
The British pound has slumped to a new weekly low against the U.S dollar, hitting 1.3820 during the European trading session, following much weaker than expected UK data and renewed strength in the greenback. The GBPUSD pair saw strong technical selling immediately following worse than expected monthly UK Trade, Industrial Production and Manufacturing numbers. Going forward, RSI and Momentum indicators are currently pointing down, as downside pressures build as we move into the U.S trading session.
The GBPUSD pair remains bearish while trading below the 1.3892 level, further losses towards 1.3800 and 1.3775 now appears likely.
Should the GBPUSD pair move above the 1.3892 level, we may see a relief rally towards the 1.3982 and 1.4000 levels.
EURUSD Further Bearish Below 1.2240 Level
The euro has moved towards the bottom-end of its recent trading range against the U.S dollar, as European equity markets continued to slump lower on Friday. EURUSD price-action is currently probing the key 1.2240 support level, after being swiftly rejected the 1.2280 region earlier. The greenback continues to be supported by overall risk-off trading sentiment, with the U.S dollar index now bouncing back well above the key 90.00 technical level.
The EURUSD pair may see further selling below the 1.2240 level, downside support is now located at the 1.2212 and 1.2180 levels.
Should the EURUSD pair fail to close under the 1.2240 level on a higher-time frame basis, intraday buyers will likely try push price-action back towards the 1.2275 and 1.2305 resistance points.
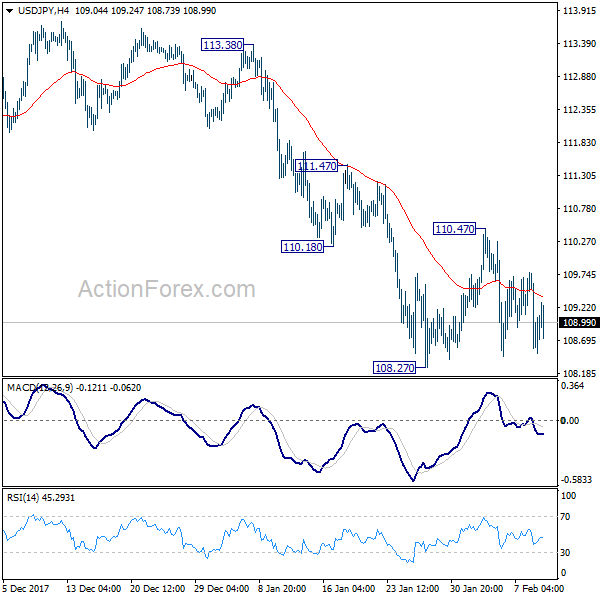
USD/JPY Mid-Day Outlook
Daily Pivots: (S1) 108.29; (P) 109.03; (R1) 109.50; More...
USD/JPY is still bounded in range of 108.27/110.47 and intraday bias remains neutral. As noted before, larger decline from 114.73 is possibly still in progress. Break of 108.27 will also resume the medium term correction from 118.65. That will send USD/JPY through 107.31 to 106.48 fibonacci level. Nonetheless, above 110.47 will turn intraday bias back to the upside and bring stronger rebound.
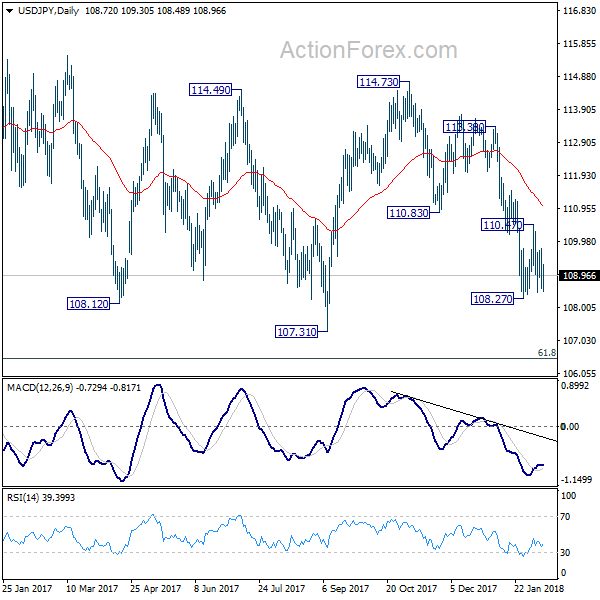
In the bigger picture, current development argues that the corrective pattern from 118.65 is extending. There is risk of dropping further to 61.8% retracement of 98.97 to 118.65 at 106.48. But this level should provide strong support to contain downside and bring resumption of rise from 98.97. However, sustained break of 106.48 will now likely send USD/JPY through 98.97 to resume the corrective fall from 125.85 (2015 high).
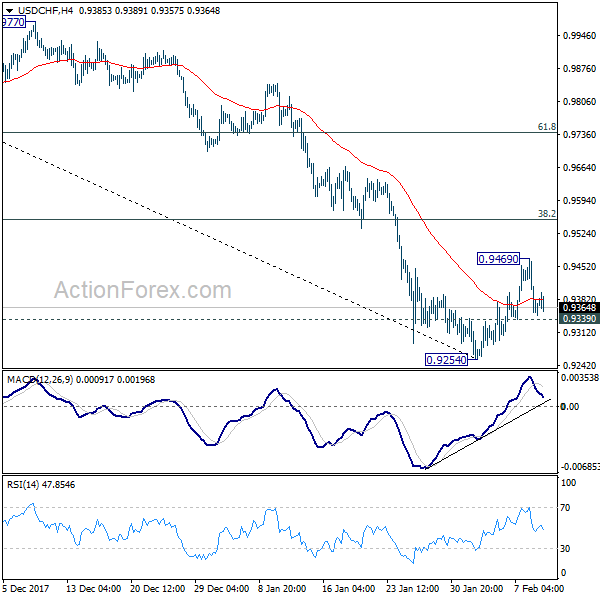
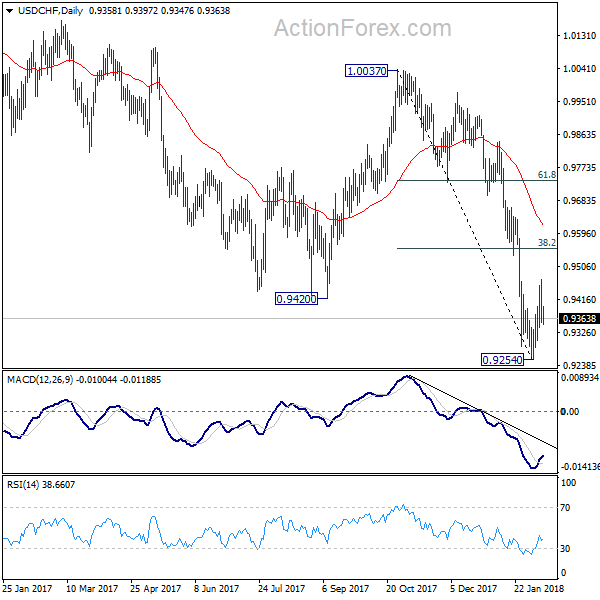
USD/CHF Mid-Day Outlook
Daily Pivots: (S1) 0.9320; (P) 0.9394; (R1) 0.9435; More...
Intraday bias in USD/CHF remains neutral for the moment. On the upside, above 0.9469 will extend the rebound from 0.9254. But at this point, there is no clear sign of trend reversal yet. We'd be cautious on strong resistance from 38.2% retracement of 1.0037 to 0.9254 at 0.9553 to limit upside and bring decline resumption. On the downside, below 0.9339 minor support will turn bias to the downside for 0.9254. Nonetheless, firm break of 0.9553 will bring stronger rebound to 55 day EMA (now at 0.9616).
In the bigger picture, the strong break of 0.9420 support suggests that fall from 1.0342 is developing into a medium term down trend. Deeper fall should be seen to 100% projection of 1.0342 to 0.9420 from 1.0037 at 0.9115. Break will target 161.8% projection at 0.8545. In any case, break of 0.9640 resistance is needed to be the first sign of medium term bottoming. Otherwise, outlook will stay bearish even in case of strong rebound.
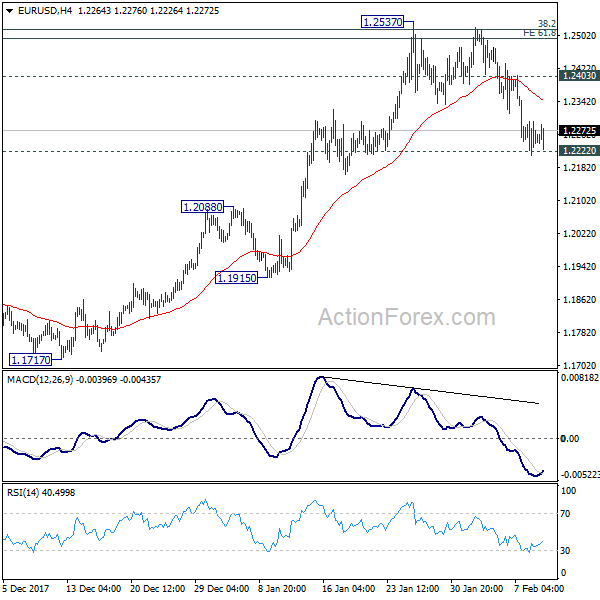
EUR/USD Mid-Day Outlook
Daily Pivots: (S1) 1.2207; (P) 1.2250 (R1) 1.2290; More....
Focus remains on 1.2222 support in EUR/USD. Sustained break of 1.2222 should confirm rejection from 1.2494/2516 key fibonacci level, as well as near term reversal, on bearish divergence condition in 4 hour MACD. That could also signal completion of medium term up trend from 1.0339. In that case, near term outlook will be turned bearish for 1.2091 resistance turned support first. On the upside, though, above 1.2403 minor resistance will revive bullishness and turn focus back to 1.2537.
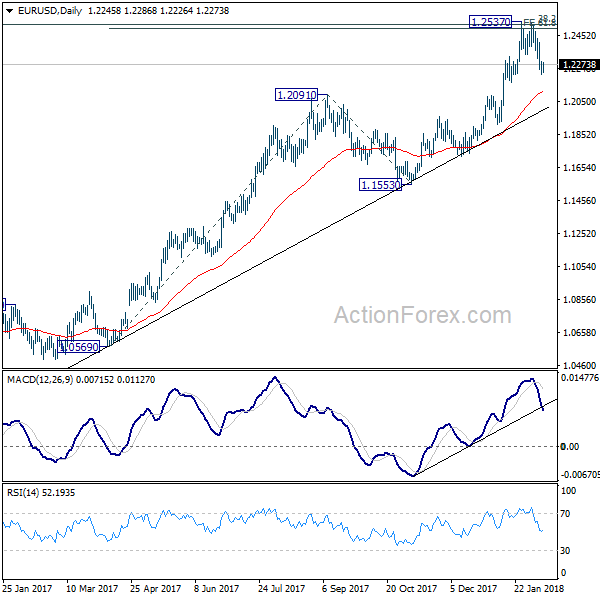
In the bigger picture, rise from 1.0339 medium term bottom is still seen as a corrective move for the moment. But key fibonacci level at 38.2% retracement of 1.6039 (2008 high) to 1.0339 (2017 low) at 1.2516 is looking vulnerable. Sustained break of 1.2516 will carry larger bullish implication and target 61.8% retracement of 1.6039 to 1.0339 at 1.3862. Nonetheless, rejection from 1.2516 will maintain long term bearish outlook and keep the case for retesting 1.0039 alive.
GBP/USD Mid-Day Outlook
Daily Pivots: (S1) 1.3814; (P) 1.3940; (R1) 1.4035; More.....
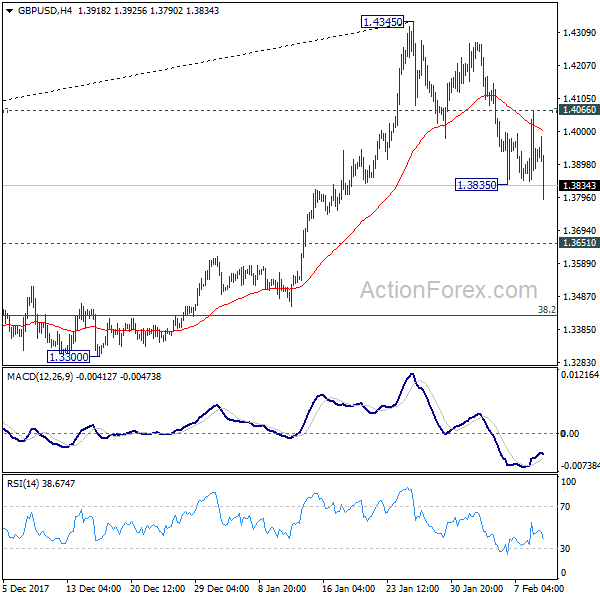
GBP/USD's recovery was limited by 4 hour 55 EMA. Subsequent break of 1.3835 indicates resumption of decline from 1.4345 and intraday bias is turned to the downside for 1.3651 resistance turned support. At this point, it's still unsure whether decline from 1.4345 is correcting rise from 1.3038, or that from 1.1946, or it's reversing the trend. Break of 1.3651 will turn focus to key fibonacci level at 1.3429. For the moment, further decline will remain expected as long as 1.4066 minor resistance holds.
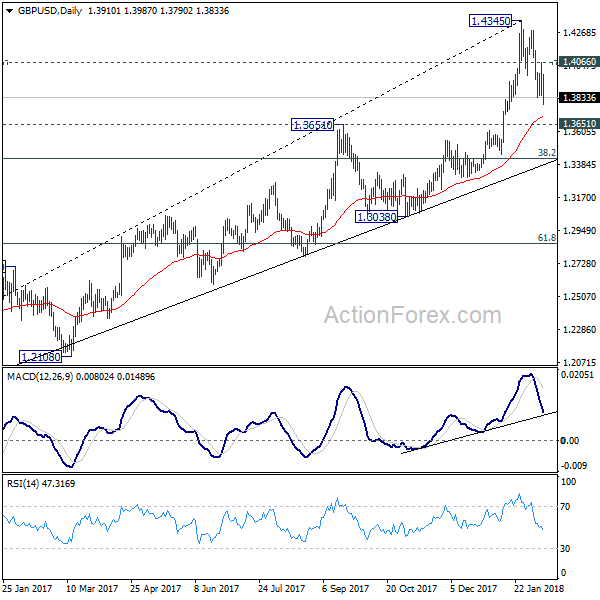
In the bigger picture, sustained break of 1.3835 key resistance level indicates that rebound from 1.1946 is at least correcting the long term down from from 2007 high at 2.1161. Further rise should now be seen back to 38.2% retracement of 2.1161 (2007 high) to 1.1946 (2016 low) at 1.5466. Medium term outlook will stay bullish 38.2% retracement of 1.1946 to 1.4345 at 1.3429, in case of deep pull back.