
Sample Category Title
BITCOIN Bullish Breakout
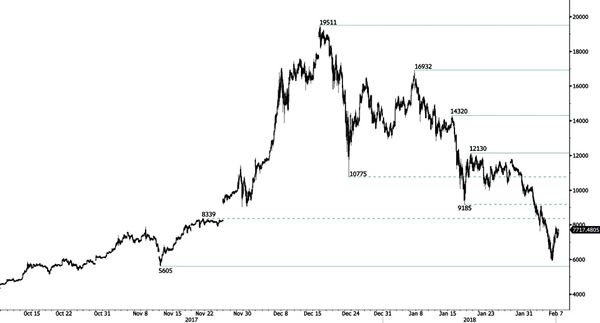
Bitcoin is retracing above 7'500, heading towards 8'339 (21/11/2017 high). Hourly support at 5'605 (13/11/2017 low) is distanced. Hourly resistance remains at 12'130 (18/01/2018 high). The short-term technical structure suggests upside moves.
In the long-term, the digital currency has had an exponential growth but also presented important downturns. There is decent likelihood that the currency could stabilize between 7'000 - 12'000 in 2018. Bitcoin is trading above its 200 DMA (6'000 range).
EUR/CHF Consolidating At 1.1575
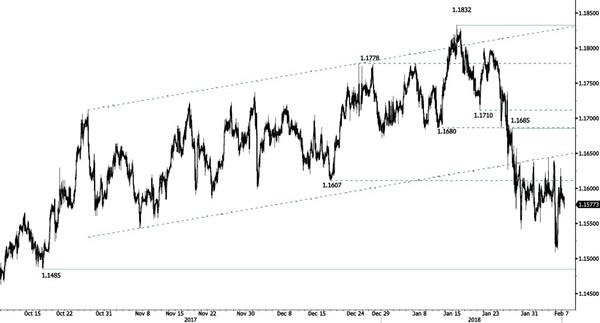
EUR/CHF buying pressure pauses. Hourly resistance is given at 1.1685 (26/01/2018 high). Expected to show further short-term upside moves.
In the longer term, the technical structure has reversed. Strong resistance is given at 1.20 (level before the unpeg). Yet, the ECB's slowing QE program is likely to cause buying pressures on the euro, which should weigh in favour of the EUR/CHF. Supports can be found at 1.0184 (28/01/2015 low) and 1.0082 (27/01/2015 low).
EUR/GBP Waiting For Another Leg Higher
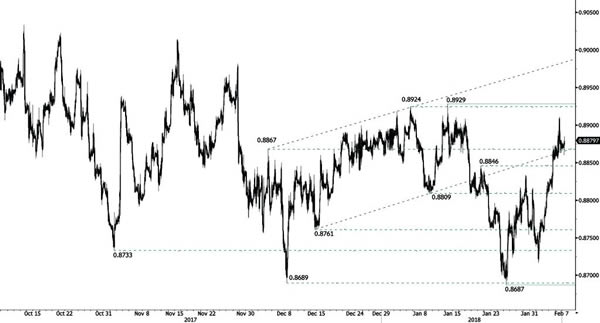
EUR/GBP is trading mixed but seems heading towards hourly resistance at 0.8929 (12/01/2018 high) while hourly support at 0.8687 (25/01/2018) is distanced. The technical structure suggests further short-term upside move.
In the long-term, the pair has largely recovered from lows in 2015. The technical structure suggests further upside pressure. The pair is trading above the range of its 200 DMA. Strong resistance can be found at 0.9500 (psychological level).
AUD/USD Slight Increase
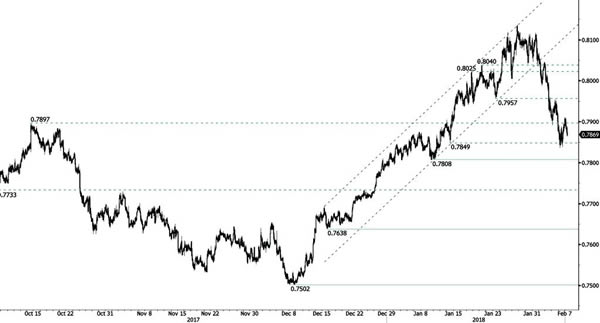
AUD/USD is slowly recovering from its recent decline. Hourly resistance is now at 0.7808 (01/09/2018 low). The technical structure suggests short-term increase.
In the long-term, the trend is turning positive, yet fails reaching key resistance at 0.8164 (14/05/2015 low). Key support stands at 0.6009 (31/10/2008 low). A break of the key resistance at 0.8164 (14/05/2015 high) is needed to invalidate our long-term bearish view.
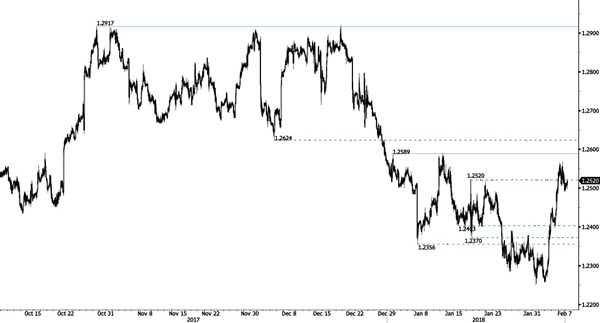
USD/CAD Edging Lower
USD/CAD is trading lower after outreaching 1.2520 (17/01/2018 high) yesterday. Resistance is now given at 1.2589 (01/01/2018). The technical structure indicates that further short-term weakness is expected.
In the longer term, the pair is trading between resistance point at 1.3805 (05/05/2017 high) and support at 1.2128 (18/06/2015 low). Strong resistance is given at 1.4690 (22/01/2016 high). The pair is likely to head lower. The pairs is trading below 200 DMA
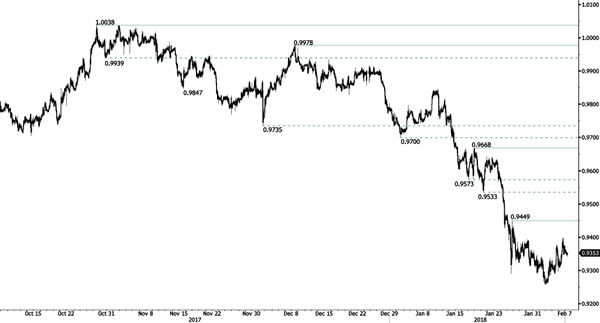
USD/CHF Rise Continues
USD/CHF is strengthening. Hourly resistance is at 0.9449 (25/01/2018 high). Expected to show further short-term upside move.
In the long-term, the pair is still trading in range since 2011 despite some turmoil when the SNB unpegged the CHF. Support at 0.9259 (24/08/2015 low) is attainable. Key support remains at 0.9072 (07/05/2015 low) while resistance at 1.0344 (15/12/2016 high) is distanced. The technical structure favours a long term bullish bias since the unpeg in January 2015.
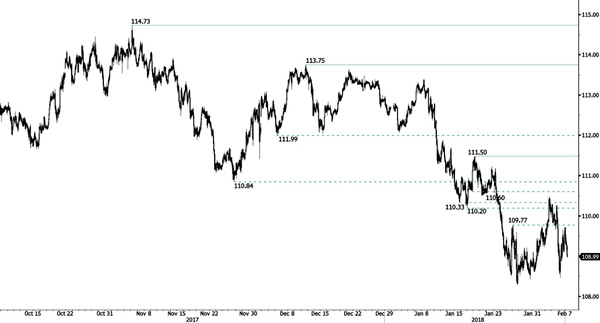
USD/JPY Bouncing Downward
USD/JPY is slightly decreasing but still trades above 109. Hourly resistance remains at 111.50 (18/01/2018 high). The technical structure suggests further short-term downside moves.
We favor a long-term bearish bias. Support is now given at 107.32 (08/09/2017 low). A gradual rise towards the major resistance at 125.86 (05/06/2015 high) seems unlikely. Expected to decline further support at 101.20 (09/11/2016 low).
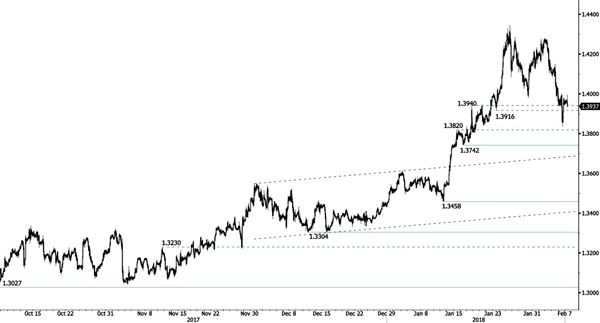
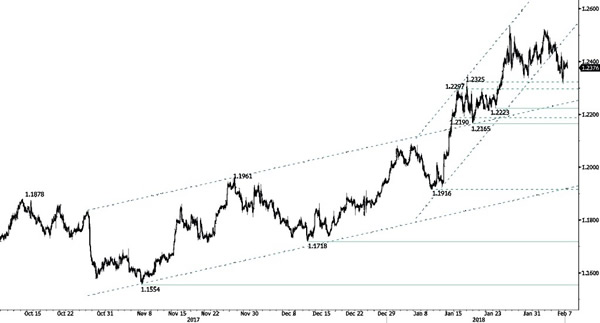
GBP/USD Weakening
GBP/USD's bearish pressure pushed the pair at the range of 1.40. The technical structure suggests further potential downside move. Hourly support at 1.3916 (23/01/2018 low) is now broken.
The long-term technical pattern is reversing. The Brexit vote had paved the way for further decline but the pair is now moving up to 2016 highs. A long-term support given at 1.1841 (07/10/2017 low) and a strong resistance at 1.5018 (24/06/2016 high) are identified.
EUR/USD Sideways Trading
EUR/USD is trading mixed. The pair lies in the 1.24 range. Hourly support is given at 1.2223 (23/01/2018 low). The technical structure suggests further short-term upside moves.
In the longer term, the momentum is turning largely positive. We favor a continued bullish bias. Key resistance is holding at 1.2886 (15/10/2014 high) while strong support lies at 1.1554 (08/11/2017 low).
FX Market Has Remained Stable Despite Sharp Moves In Equities And Bonds
FX market is relatively unaffected by equity sell-off
The FX market has been only slightly affected by the equity market rout of the last few days; the same cannot be said of the bond market. Indeed, it seems that investors’ panic reaction has been contained to the equity and bond market as investors dumped stocks to rush into bonds.
On Monday, US Treasury bonds rallied sharply – not matter the maturity – as equities were on fire sale. The US 2-year sovereign yield dropped 20bps to around 1.95%, the 5-year one slid 26bps to around 2.35%, while the longer-end of the curve the 10-year fell 23bps to 2.65%. On the equity side, the S&P 500 was off more than 5%, while the Dow Jones fell 6%.
Meanwhile, the FX market reacted in a very limited manner. Obviously, the Japanese yen strengthen as the risk-off sentiment spread but the rise was quite limited as USD/JPY fell only by 1.60%, down to 108.50, before stabilizing at around 109.20.
On Wednesday, financial markets are still in recovery mode with European equities trading in positive territory and Treasury yields grinding higher. The VIX is still hanging around 31, suggesting that investors have not let their guard down yet. In the FX market, the greenback is better bid against all of its peers, with the exception of the Japanese yen. We believe this is just a matter of time before investors give up their risk-off stance.
After all, the US inflation outlooks great and the solid jobs report, released last Friday, only add fuel to this rhetoric. We think that the US dollar is oversold right know and that it is just a matter of time before the greenback catches up.
RBNZ Meeting
With markets focused on global yield, curves and risk environment RBNZ policy meeting will increase in relevance. There is growing faith in the reflation and central bank “normalization” story, which, counter to economic data has drifted to New Zealand. We suspect markets have getting way ahead of themselves with hawkish bets. The RBNZ meeting is the final before Adrian Orr undertakes the governorship in March. The RBNZ is expected to hold policy unchanged. As with other G10 countries domestic inflation has disappointed as economic improvement has not translated into price pressures. Jobless rate fell to a fresh nine-year low in the December quarter but an influx of workers has kept wage inflation from accelerating.
Inflation pressures have unexpectedly slowed annual inflation rate to 1.6% from the prior quarter's 1.9% as cheaper food as consumer discretionary all but offset higher cost fuel and housing. The RBNZ is priced to remain on hold this year and a dovish message will dampen speculation for earlier lift off. The net result will likely be a weaker NZD on dovish central bank messaging.
South African President Zuma’s to resign smoothly as the economy is growing
Six weeks after his replacement by new leader Cyril Ramaphosa of his party, the African National Congress (ANC) who was expected to meet today in order to decide whether it would force President Zuma to leave his functions is finally postponed later this month. According to internal sources, Zuma and Deputy President Ramaphosa came closer to an agreement and were “discussing formalities” of current President’s exit. On the schedule was also expected Zuma’s speech as part of the State of the Nation Address at the parliament assembly, which, in turn, had also to be postponed as a result of “fears of violence” among parliamentarians.
Since recent communications of a commonly agreed resignation among participants, and as the transition finally comes to be done “smoothly”, we see no obstacles as to further USD/ZAR depreciation, currently valued at 11.96 (-4.0% YTD). Since the beginning of 2018, ZAR is currently the best performing currency against the greenback (EUR/USD Cross: -2.65%, GBP/USD Cross: -2.61%, USD/JPY: -2.72%). South African economy maintains a strong 2018 economic outlook, boosted by January Business Confidence at 99.70 (December: 96.40), higher-than-expected trade balance surplus of ZAR 15.70 billion (USD 1.313 billion, expected: USD 0.844 billion) and inflation maintained at 4.70%. Since recent steep decrease of FTSE/JSE 40 index, largely due to political uncertainty, we remain confident that South African equities are on the way to recovery.