Sample Category Title
(RBNZ) Official Cash Rate Unchanged at 1.75 percent
Statement by Reserve Bank Governor Grant Spencer:
The Reserve Bank today left the Official Cash Rate (OCR) unchanged at 1.75 percent.
Global economic growth continues to improve. While global inflation remains subdued, there are some signs of emerging pressures. Commodity prices have increased, although agricultural prices are relatively soft. International bond yields have increased since November but remain relatively low. Equity markets have been strong, although volatility has increased recently. Monetary policy remains easy in the advanced economies but is gradually becoming less stimulatory.
The exchange rate has firmed since the November Statement, due in large part to a weak US dollar. We assume the trade weighted exchange rate will ease over the projection period.
GDP growth eased over the second half of 2017 but is expected to strengthen, driven by accommodative monetary policy, a high terms of trade, government spending and population growth. Labour market conditions continue to tighten. Compared to the November Statement, the growth profile is weaker in the near term but stronger in the medium term.
The Bank has revised its November estimates of the impact of government policies on economic activity based on Treasury's HYEFU. The net impact of these policies has been revised down in the near term. The Kiwibuild programme contributes to residential investment growth from 2019.
House price inflation has increased somewhat over the past few months but housing credit growth continues to moderate.
Annual CPI inflation in December was lower than expected at 1.6 percent, due to weakness in manufactured goods prices. While oil and food prices have recently increased, traded goods inflation is projected to remain subdued through the forecast period. Non-tradable inflation is moderate but expected to increase in line with increasing capacity pressures. Overall, CPI inflation is forecast to trend upwards towards the midpoint of the target range. Longer-term inflation expectations are well anchored at 2 percent.
Monetary policy will remain accommodative for a considerable period. Numerous uncertainties remain and policy may need to adjust accordingly.
USDCHF Near 2-Week Peaks; Bulls Take Control in Short Term
USDCHF bears have been leading the market since November, driving the pair to a 2½-year trough of 0.9246 last week. This week, however, bulls seem to be taking back control, with prices being on track to break two-week highs.
In the 4-hour chart, technical indicators suggest that the recent uptrend could be in play in the near-term. The pair managed to enter the Ichimoku cloud for the first time after a month, surpassing the 50-period simple moving average (SMA) which acted as a strong support during that timeframe. Today's bullish (golden) crossover between the 20- and the 50-period SMAs also enhances the bullish signals. Besides that, momentum indicators show that an advance is getting ahead. The RSI increased speed and is currently a breath below 70, hinting that upside movements might lose steam if it successfully breaks into oversold levels (above 70). The MACD has crawled back to positive territory, surpassing its signal line.
Should the pair head up, the Fibonacci retracement levels of the downleg from 0.9639 to 0.9246 (January 22 – February 2) could provide resistance. The 50% Fibonacci of 0.9443 could come first into view and any violation of this long-term support could confirm the start of a bullish phase, extending the uptrend towards the 61.8% Fibonacci of 0.9488. Steeper increases could also test the 78.6% Fibonacci of 0.9556.
On the flip side, if prices decline instead, an immediate support could be found at the 38.2% Fibonacci of 0.9395 and then further below a stronger obstacle could be met at the 23.6% Fibonacci of 0.9336 which coincides with the 20- and the 50-period SMAs. However, only a leg below the previous low at 0.9246 would resume the underlying downtrend, reverting USDCHF back to bearish mode.
USDCAD Remains Tall after Recent Surge But Bulls Show Initial Signs of Stall
The USDCAD holds high levels on Wednesday and trading above 1.25 handle, after strong rally last Fri/Mon which stalled at 1.2566 on Tuesday. Subsequent dip was so far shallow and found footstep just under 1.25, with fresh bullish momentum building on daily chart and 10/20SMA's in bullish setup, continuing to support. Thick hourly cloud (spanned between 1.2515 and 1.2433) underpins near-term action and keeps the downside protected for now. On the other side, overbought slow stochastic on daily chart and converged 55/10 in attempt to form bear-cross, weigh and keep the downside at risk. Break below two-day base at 1.2490 will be initial bearish signal for extension towards pivotal 1.2445 support (Fibo 38.2% of 1.2248/1.2566 rally), loss of which would signal reversal. On the other side, lift above Tuesday's spike high at 1.2566 will be bullish signal, as daily cloud twists tomorrow (1.2699) and could attract for further advance.
Res: 1.2544; 1.2566; 1.2603; 1.2663
Sup: 1.2490; 1.2445; 1.2415; 1.2390
Sunset Market Commentary
Markets:
Global core bonds traded mixed today with German Bunds underperforming US Treasuries. The final German coalition agreement and upward revisions to EMU growth forecasts by the EC might be at play. Trading ranges in both contracts narrowed again following two volatile days. European stock markets and Brent crude recover some of this week's losses. NY Fed Dudley said that the stock market swoon won't alter the FOMC's thinking at the moment. At the time of writing, German yields add 0.6 bps (2-yr) to 2.8 bps (10-yr). Daily US yield changes range between -0.4 bps (2-yr) and -2.1 bps (10-yr). 10-yr yield spreads versus Germany narrow 2 bps with the periphery outperforming (up to -9 bps).
There was again no unequivocal theme to guide USD trading today. There were no market-relevant data in EMU or in the US. Risk sentiment was mixed; European equities rebounded, but US equity futures indicated modest losses. USD/JPY traded with a slightly negative bias holding in the low 109 area during most of the European session. At the same time, the dollar gained slightly ground against the euro with EUR/USD drifting lower in the 1.23 big figure. If anything, interest rate differentials between the US and Germany narrowed slightly, but this was of little significance for EUR/USD trading. The pair returned to the previous 1.2335/23 support, but for now there is still no break yet. Currency investors are still looking for a trigger/new market theme after this week's repositioning on the equity and interest rate markets EUR/USD trades in the 1.2335 area. USD/JPY is currently changing hands around 109.20. The trade-weighted dollar (DXY 89.85) is holding a cautious upward bias.
Sterling was captured in technical trading today. There were no important UK eco data. In its winter forecasts, the European Commission expects UK growth of 1.4% in 2018 and 1.1% in 2019, lagging well behind EMU growth. However, this assessment was no surprise. EUR/GBP drifted temporary higher in the 0.88 big figure, but a sustained break again didn't occur. The pair trades little changed at around 0.8870. Investors await tomorrow's BoE policy decision and the Bank's quarterly inflation report. Markets will look for clues whether Carney and Co are inclined to give more weight to containing inflation rather than to support growth further out in 2018. Cable (1.39 area) declined off the 1.40 barrier, but this move was mainly driven by relative USD strength.
News Headlines:
The EMU economy will expand faster than previously anticipated in 2018 and 2019, the European Commission said in its winter forecast. It sees growth of 2.3% in 2018 (up from 2.1%). The 2019 growth forecast was upwardly revised to 2% percent. Inflation is expected to remain subdued at 1.5% in 2018 and 1.6% in 2019.
German Chancellor Merkel's CDU/CSU and the Social Democrats (SPD) agreed to a coalition deal. According to media reports, Merkel's CDU will get five ministries, including defense and economy. CSU will take three. SPD leader Schulz is said to serve as foreign minister. Hamburg Mayor Scholz will oversee finance, replacing Wolfgang Schaeuble.
Oil prices are little changed today as the boost from a report showing a drop in US crude inventories last week is offset by evidence of growing US output. Brent crude hovers just below $67/b, off the $71/p top late January.
The National Bank of Poland (NBP) left its policy rate unchanged at a record low of 1.5%. Investors are looking out for a press briefing after this report was finished to see whether the NBP intends to change tactics this year or not.
Silver Dips Below 16.73; More Downside Move is Expected
Silver has come under pressure since Tuesday's session, in the short-term timeframe. The price slipped below the 16.73 barrier and continues the strong bearish movement. As a side note, the precious metal has been trading within a descending triangle since July 2016.
In the short-term timeframe, technically, the bias is bearish. Momentum indicators are also endorsing the decline. The MACD oscillator entered the negative territory, while the RSI indicator is heading lower below the 50 level.
If price action remains below 16.73 (immediate resistance), there is scope to test the lower boundary of the triangle at 15.60. This is considered to be a strong resistance area which has been rejected a few times in the past.
If the aforementioned resistance fails to prevail, then the focus would shift to the upside towards the 17.70 barrier. If price breaches that level, it could increase the bullish move above the descending triangle and it could be on path towards the 18.20 level.
EURJPY Bears Back into the Game; Uptrend Line Acts as Support
EURJPY has reversed back down again after finding resistance at the 135.80 barrier during yesterday's and today's trading sessions. The pair has been developing lower, reaching the ascending trend line, which has been standing since August 18. Additionally, over the last hours, prices broke below the 23.6% Fibonacci retracement level at 135.12 of the up-leg from 127.45 to 137.50.
The pair is recording a slightly upside movement and the short-term momentum indicators seem to be in confusion. In the 4-hour chart, the Relative Strength Index (RSI) is holding in the negative area but is pointing up, while the MACD oscillator is moving lower in the bearish area below its trigger line. Moreover, the 20-simple moving average is sloping to the downside, signaling further bearish movement.
On the downside, if prices continue the bearish rally, there is scope to test the 134.10 support level. Penetrating this key level and the uptrend line could see further downside correction towards the 38.2% Fibonacci mark at 133.65.
If prices reverse higher and climb above 23.6% Fibonacci level, immediate resistance should come at 135.80, which overlaps with the 40-SMA in the 4-hour chart.
Is The 37 Year Bullish Bond Market Ending?
The bond market has enjoyed a strong bull market for nearly four decades with yields continuing to go lower. The bull market has been going on for so long that no current active fund manager can imagine what it looks like when interest rates were to be like the 1980s at 20%. If people in the 1980s started trading in their early thirties, they would have been almost 70 years old by now, so chances are they are not active in the market anymore.
The dot com bubble and 2008 financial crisis continue to turbocharge the great bond bull rally with central banks cutting interest rates around the world and multitrillion-dollar-bond-buying programmes. However, the period of easy money could be ending this year. The Fed, ECB, Bank of Japan have all started to taper their bond purchase program. The Fed is the first one to stop the bond buying program and it's also the first to embark in balance sheet normalization, or QT (Quantitative Tightening). As Central Banks have been big buyers of bonds for the past decade, questions arise as to whether this shift to tapering would finally prompt the great bull market to end.
The markets have enjoyed monetary support from global central banks for the past 10 years. When the Federal Reserve stopped its quantitative easing programme in 2014, the Bank of Japan took the baton with an even bigger scheme. When the Fed started raising rates in 2015, the European Central Bank (ECB) started a new quantitative easing programme. Last year, Central Banks bought $1.5 trillion of bonds.
But this year investors for the first time in a decade, central banks can be withdrawing money from the market. The Fed has started to slowly shrink its balance sheet last year. This month, the ECB's bond buying reduced by half to €30 billion a month and the programme would likely end this year. Bank of Japan's purchase of long-dated bonds had also slowed.
Indeed the bond market has started to decline and as a result the yields have been going up as the charts below show:
Weekly Chart of 10 Year Notes (ZN_F)
Ten Year Note (ZN_F) shows a bearish sequence from 7.2012 high (135.15) as well as from 7.2016 high (131.35). The instrument shows 7 swing sequence (in black color) from 7.2012 high and the minimum 100% target at 120.3 has been reached. However, there is another sequence (red color) starting from 7.2016 high and this sequence only shows 5 swing, thus another leg lower is expected to end 7 swing from 7.2016 high and also 7 swing from 7.2012 high.
TNX (10 Year Yields) Daily Chart
10 Year Yields (TNX) is the inverse of ZN_F (10 Year Notes) and the yield shows 3 swing bullish sequence (higher high) from 7.2016 low. 10 year yields potentially can target 3.31 - 3.61% this year to end the third swing. Thus the charts above suggest that 10 Year Notes will continue to sell and 10 year yields will continue to rise this year.
But the bigger question is whether the 38 year bull market in the bonds has ended. We will look at the two long term charts of TNX below: One using linear scale and another one using logarithmic scale
Long Term Charts of 10 Year Yields (TNX) Linear Scale
Looking at the long term charts of 10 year Yields since the 8.1981 high (15.84)%, we can see that the yields have broken above the parallel channel drawn from 8.1987 high. At first glance, this suggests the possibility that the yields may have ended cycle from 8.1987 high and possibly from 8.1981 high as well. However, since we are looking at very long term chart, it's useful to also look at it using logarithmic scale, which is usually more accurate for a long term chart
Long Term Charts of 10 Year Yields (TNX) Logarithmic Scale
Looking at 10 year yields with logarithmic scale, we can draw a trend line from 8.1981 high and so far the yields have not broken and closed above it which comes around 3.05 - 3.10% and descending by 0.05% every month approximately.
Since usually logarithmic scale is more relevant in long term charts, the 10 year yields need to break and close above 3.1% with conviction before the 38 year bull market in the bond could be considered ending.
Spot Gold – Tuesday’s Bearish Outside Day Maintains Pressure and Signals Further Easing
GOLD
Spot Gold stands at the back foot on Wednesday, following limited recovery after strong fall previous day, which hit new three-week low at $1320. Bearish outside day on Tuesday was negative signal and bear-leg from $1366 (25 Jan peak) could extend towards next target at $1316 (Fibo 38.2% of $1236/$1366), as daily techs are bearishly aligned. Performance of global stocks, as the source of recent turbulent movements in the markets, remains in focus. Further recovery of stock prices could pressure gold price for stronger retracement of $1236/$1366 rally. Completion of asymmetric H&S pattern on daily chart was strong bearish signal which could be boosted by break below $1316 Fibo support for extension towards $1301 (50% of $1236/$1366/55SMA) and $1293 (100SMA) in extension). Broken 30SMA marks initial barrier at $1328, with extended upticks expected to stay below $1337 (broken 20SMA) to keep bearish near-term structure intact.
Res: 1328; 1332; 1337; 1340
Sup: 1322; 1320; 1316; 1308
Canadian Dollar Steady, Building Permits Crushes Estimate
The Canadian dollar has posted small losses in the Wednesday session. Currently, the pair is trading at 1.2515, up 0.17% on the day. On the release front, Canadian Building Permits posted an excellent gain of 4.8%, compared t0 the estimate of 2.1%. There are no key releases out of the US. On Thursday, the US publishes unemployment claims.
It's been a volatile week on the stock markets, and the US dollar has taken advantage, posting broad gains. The Canadian dollar has lost ground this week, down close to 1.0%. On Monday, the Dow Jones posted its biggest one-day loss on Monday. The markets were back in green territory on Tuesday. A key factor in the stock market slide was strong employment numbers on Friday, as nonfarm payrolls and wage growth reports beat their estimates. Investors shied away from the stock markets, concerned that the sharp data could lead to higher inflation, which in turn would result in more rate hikes this year. Higher interest rates make the US dollar more attractive for investors, at the expense of other currencies.
Canadian indicators disappointed on Tuesday. Canada's trade deficit widened from C$2.5 billion to C$3.2 billion, well above the estimate of C$2.3 billion. The export sector has been steady, but uncertainty over NAFTA is a dark cloud over the economy, and exports could suffer if the trilateral free trade pact is not renewed. The US has threatened to leave the pact if the Canada and Mexico do not agree to major concessions, such as increasing the percentage of US content in auto parts produced under NAFTA. Elsewhere, Canadian Ivey PMI continues to point to expansion, but slowed to 55.2, down from 60.4 in the previous release. This was well off the forecast of 60.7 points.
The Janet Yellen era is over at the Federal Reserve. On the weekend, Jerome Powell took over as chair, replacing Yellen. On Friday, Yellen waxed optimistic about the economy, saying that strong growth, a red-hot labor market and increased wage growth would require the Fed to gradually raise interest rates. Powell is expected to continue to Yellen's policies, so the markets are not expecting any dramatic shifts. However, the massive US tax cut will have a strong impact on the US economy, and the markets will be looking to the Fed for guidance. If the Fed sounds optimistic about the tax reform package, the US dollar could move higher.
USD/JPY Mid-Day Outlook
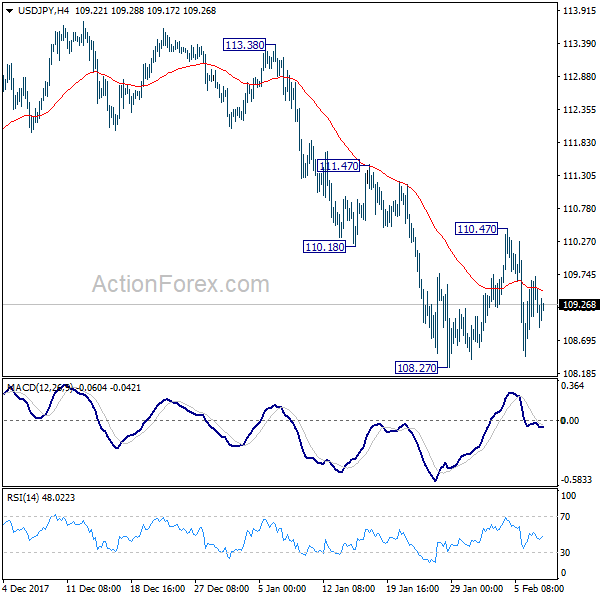
Daily Pivots: (S1) 108.78; (P) 109.22; (R1) 109.98; More...
Intraday bias in USD/JPY remains neutral at this point. As noted before, larger decline from 114.73 is possibly still in progress. Break of 108.27 will also resume the medium term correction from 118.65. That will send USD/JPY through 107.31 to 106.48 fibonacci level. Nonetheless, above 110.47 will turn intraday bias back to the upside and bring stronger rebound.
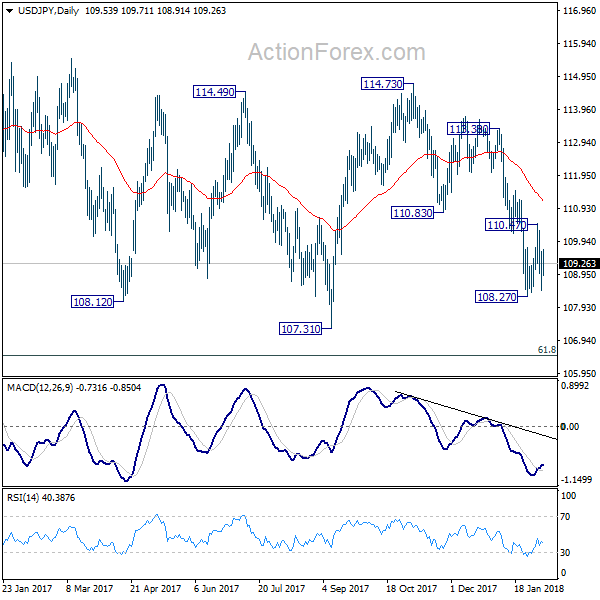
In the bigger picture, current development argues that the corrective pattern from 118.65 is extending. There is risk of dropping further to 61.8% retracement of 98.97 to 118.65 at 106.48. But this level should provide strong support to contain downside and bring resumption of rise from 98.97. However, sustained break of 106.48 will now likely send USD/JPY through 98.97 to resume the corrective fall from 125.85 (2015 high).