
Sample Category Title
Markets Reel Under Trade War Fears, Dollar Gains Traction, Gold Falls
Global stock markets are under heavy selling pressure as risk-off sentiment dominates the final trading day of February. The selloff intensified across major indices, with Japan’s Nikkei plunging -3% and Hong Kong’s Hang Seng Index down -2.8%, following the steep declines in US equities overnight. Investors are increasingly wary of escalating trade tensions, which could further weigh on the fragile global recovery.
Market sentiment took a sharp hit after confirmation that the 25% US tariffs on Mexico and Canada will take effect on March 4. The more consequential reciprocal tariffs, set for April 2, have also drawn attention, particularly with US President Donald Trump threatening to extend a 25% tariff on European Union imports.
NASDAQ was the hardest hit among US indices, tumbling -2.78%, with semiconductor giant Nvidia leading the declines with an -8.5% drop. Despite reporting strong quarterly earnings, the company is facing increased concerns that it won’t be immune to the broader trade war, particularly if Taiwan’s chip industry comes under new US tariff measures. Given Nvidia’s dominant role in the AI sector, any disruption in its supply chain could ripple through the entire tech sector.
In the currency markets, Dollar is now firmly leading the weekly performance rankings after its sharp rally overnight. Swiss Franc follows as the second-strongest, while Sterling also benefits from the broader selloff in Euro. Meanwhile, commodity-linked currencies are bearing the brunt of risk aversion, with New Zealand Dollar plunging the most, followed by Australian and Canadian Dollars. While Euro and Yen are positioned in the middle of the performance spectrum, the single currency is looking rather vulnerable.
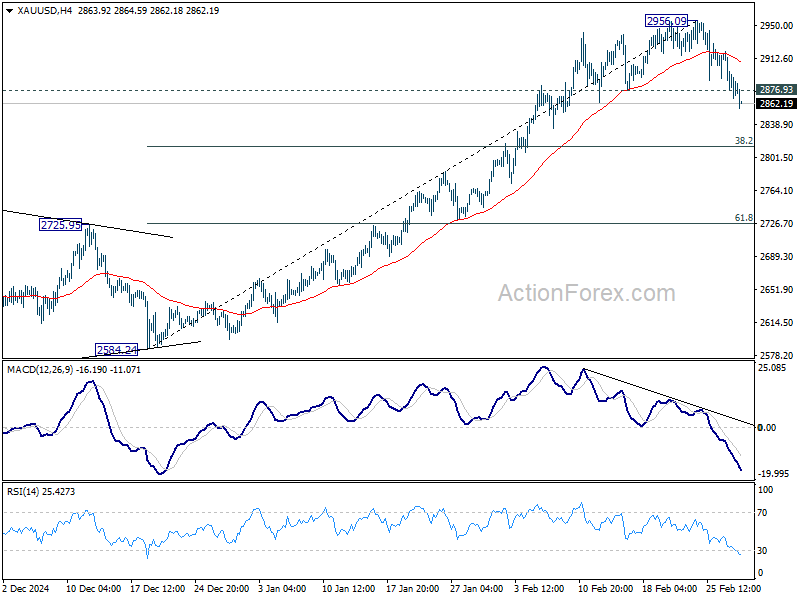
Technically, Gold’s extended decline is another confirmation of the Dollar’s underlying strength. The break of 2876.93 support confirms short-term topping at 2956.09, just below the key psychological 3000 level, with bearish divergence in 4H MACD.
Deeper correction should be seen to 38.2% retracement of 2584.24 to 2956.09 at 2814.04. Rebound from there indicate that it's just a near term correction, and keep the larger up trend intact. However, sustained break of 2814.04 will suggest that a larger scale correction is already unfolding.
In Asia, at the time of writing, Nikkei is down -2.97%. Hong Kong HSI is down -2.58%. China Shanghai SSE is down -1.11%. Singapore Strait Times is down -0.72%. Japan 10-year JGB yield is down -0.023 at 1.373. Overnight, DOW fell -0.45%. S&P 500 fell -1.59%. NASDAQ fell -2.78%. 10-year yield rose 0.036 to 4.285.
BoJ’s Uchida: Yield rise reflects market’s views on economic and global developments
Speaking in parliament today, BoJ Deputy Governor Shinichi Uchida said recent rise in JGB yields "reflects the market's view on the economic and price outlook, as well as overseas developments."
"There's no change to our stance on short-term policy rates and government bond operations," he emphasized, adding that the bond holdings "continue to exert a strong monetary easing effect" on the economy.
When asked whether the prospect of further rate hikes and tapering would continue to drive yields higher, Uchida responded that it is ultimately “up to markets to decide.”
Japan's Tokyo CPI slows to 2.2% yoy in Feb, industrial production down -1.1% mom in Jan
Tokyo’s core CPI (ex-food) slowed to 2.2% yoy in February, down from 2.5% yoy and below market expectations of 2.3% yoy. This marks the first decline in four months, largely due to the reintroduction of energy subsidies. Meanwhile, core-core CPI (ex-food and energy) held steady at 1.9% yoy. Headline CPI slowed from 3.4% yoy to 2.9% yoy.
In the industrial sector, production contracted by -1.1% mom in January, a sharper decline than the expected -0.9%. Manufacturers surveyed by Japan’s Ministry of Economy, Trade, and Industry anticipate a strong 5.0% mom rebound in February, followed by a -2.0% mom drop in March.
On the consumer front, retail sales grew 3.9% yoy in January, slightly missing the 4.0% yoy forecast, but still pointing to resilient domestic demand.
Fed’s Hammack signals cautious approach, stresses policy patience
Cleveland Fed President Beth Hammack said Fed has the "luxury of being patient" given the strength of the labor market and the uneven progress in reducing inflation.
In a speech overnight, she noted that while inflation has moderated, it remains above the 2% target, and policymakers are not yet confident that price pressures will fully subside. As a result, she expects the federal funds rate to stay steady "for some time".
Hammack acknowledged that the current policy stance has helped ease inflation, but she warned that risks remain. While Fed anticipates a gradual return to 2% inflation over the medium term, she stressed that this is "far from a certainty."
She suggested Fed will need to take a "patient approach" in monitoring how inflation and the labor market adjust before making any policy changes.
Fed's Harker says one inflation report shouldn't sway policy in either direction
Philadelphia Fed President Patrick Harker noted in a speech overnight that recent inflation data continues to show an uneven path toward the 2% target. He acknowledged that January’s consumer price data came in hotter than expected, marking the fastest increase in 18 months.
However, he stressed that policymakers should "not be moved to act, in either direction" based on a single month’s data.
Harker reaffirmed his stance that the Fed’s current policy rate remains sufficiently restrictive to keep inflation in check without undermining overall economic stability.
Despite inflation’s persistence, Harker remains optimistic about the economic outlook. He stated, “I am of a position that we let monetary policy continue to work.”
Looking ahead
Germany will release CPI flash, import prices, retail sales and unemployment in European session. Swiss will release KOF economic barometer.
Later in the day, Canada will publish GDP. Focus is also on US PCE inflation, goods trade balance and Chicago PMI.
AUD/USD Daily Report
Daily Pivots: (S1) 0.6207; (P) 0.6261; (R1) 0.6291; More...
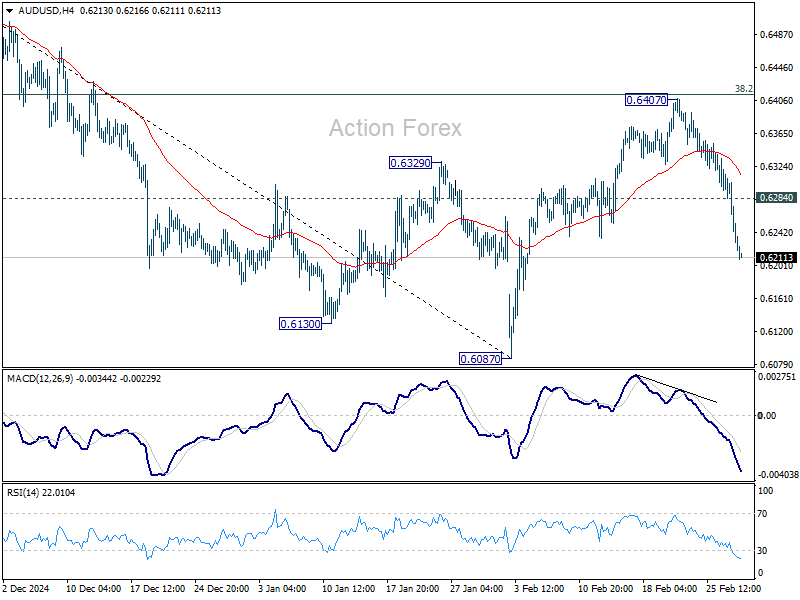
AUD/USD's fall from 0.6407 accelerated lower today and intraday bias stays on the downside for retesting 0.6087 low. Decisive break there will resume larger decline from 0.6941. On the upside, above 0.6284 minor resistance will turn intraday bias neutral first. But outlook will remain bearish as long as 38.2% retracement of 0.6941 to 0.6087 at 0.6413 holds, in case of recovery.
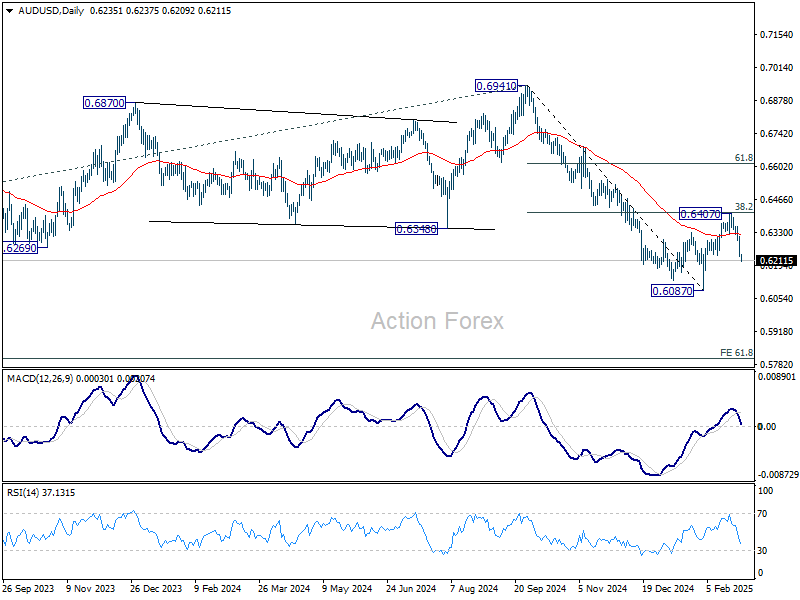
In the bigger picture, fall from 0.6941 (2024 high) is seen as part of the down trend from 0.8006 (2021 high). Next medium term target is 61.8% projection of 0.8006 to 0.6169 from 0.6941 at 0.5806. In any case, outlook will stay bearish as long as 55 W EMA (now at 0.6505) holds.
AUD/USD Daily Report
Daily Pivots: (S1) 0.6207; (P) 0.6261; (R1) 0.6291; More...
AUD/USD's fall from 0.6407 accelerated lower today and intraday bias stays on the downside for retesting 0.6087 low. Decisive break there will resume larger decline from 0.6941. On the upside, above 0.6284 minor resistance will turn intraday bias neutral first. But outlook will remain bearish as long as 38.2% retracement of 0.6941 to 0.6087 at 0.6413 holds, in case of recovery.
In the bigger picture, fall from 0.6941 (2024 high) is seen as part of the down trend from 0.8006 (2021 high). Next medium term target is 61.8% projection of 0.8006 to 0.6169 from 0.6941 at 0.5806. In any case, outlook will stay bearish as long as 55 W EMA (now at 0.6505) holds.
Elliott Wave View: FTSE Should See More Downside
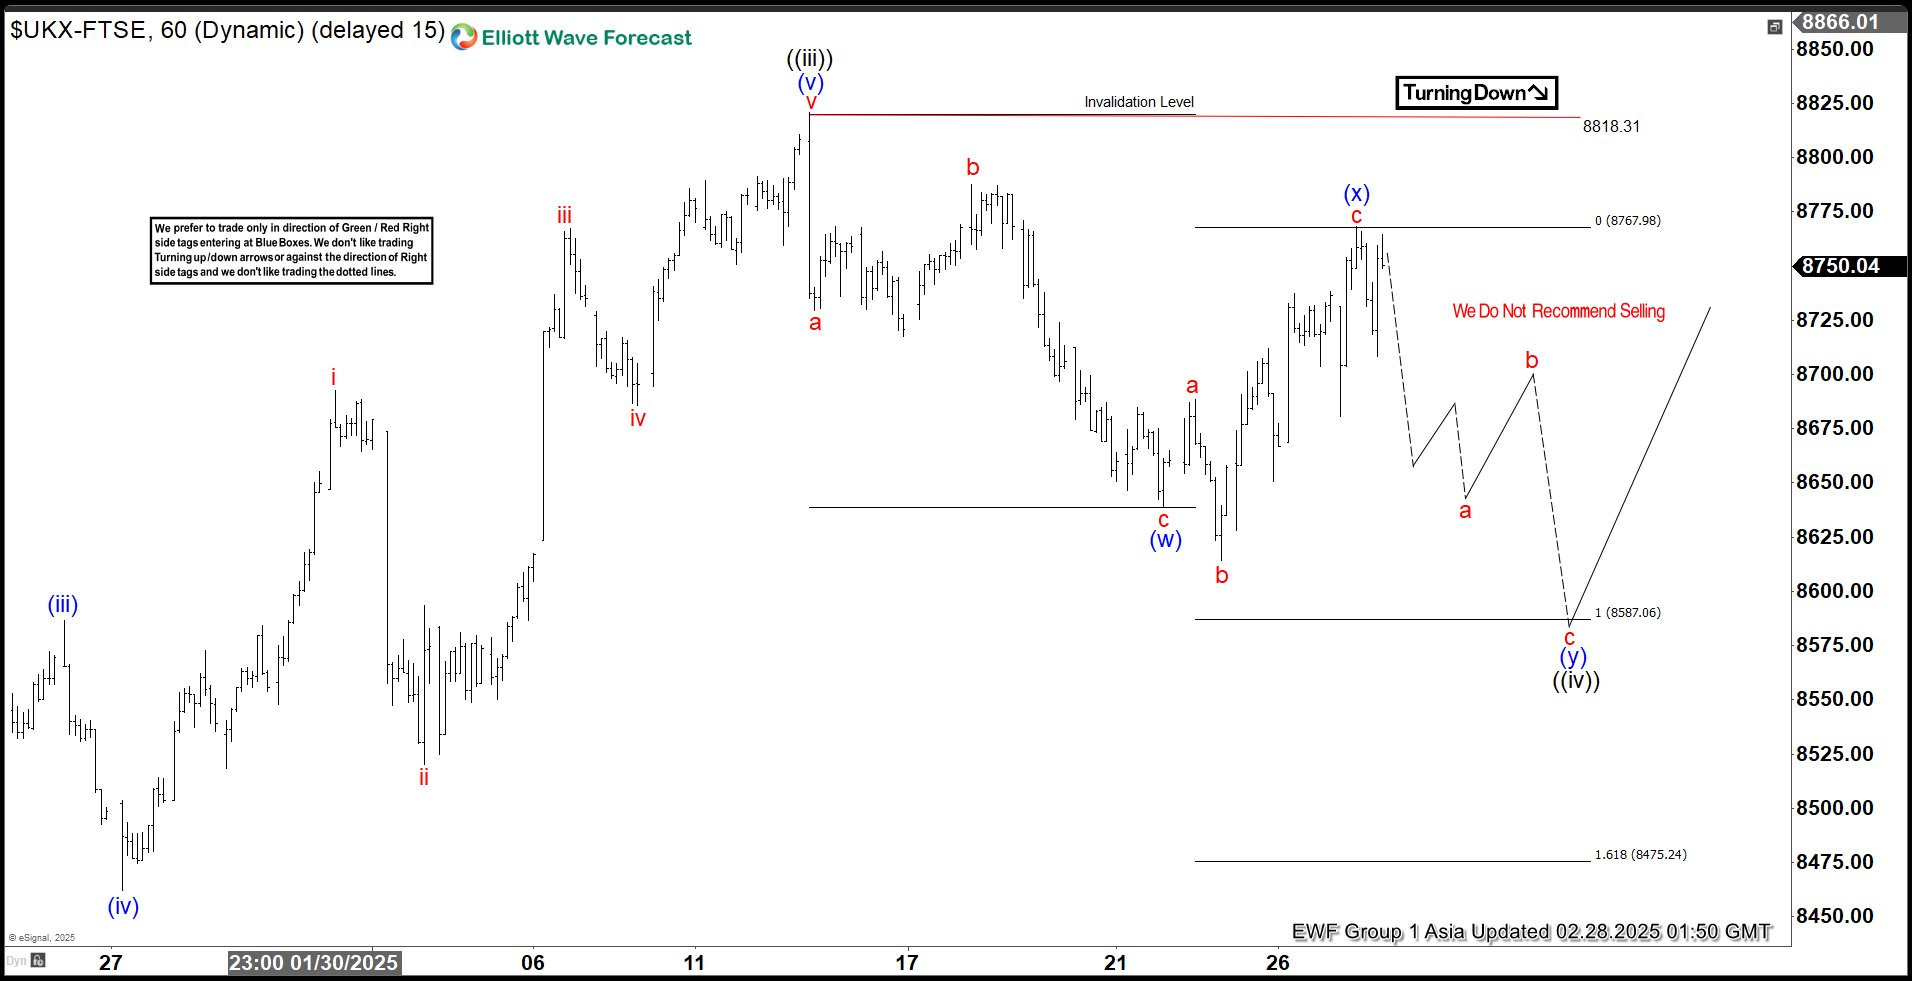
Short Term Elliott Wave View in FTSE suggests that cycle from 11.13.2024 low is in progress as a 5 waves impulse. Up from there, wave ((i)) ended at 8388.37 and pullback in wave ((ii)) ended at 8002.34. Wave ((iii)) higher subdivided into another 5 waves in lesser degree. Up from wave ((ii)), wave (i) ended at 8326.32 and pullback in wave (ii) ended at 8192.31. Wave (iii) higher ended at 8584.73 and dips in wave (iv) ended at 8462.18 as the 1 hour chart below shows.
The Index then resumed higher. Up from wave (iv), wave i ended at 8692.84 and wave ii pullback ended at 8520.2. Wave iii higher ended at 8767.5 and pullback in wave iv ended at 8685.78. Final leg wave v ended at 8820.93 which completed wave (v) of ((iii)). Pullback in wave ((iv)) is currently in progress as a double three Elliott Wave structure. Down from wave ((iii)), wave (w) ended at 8638.63 and wave ((x)) ended at 8768.05. Expect the Index to extend lower in wave (y) of ((iv)) to reach 8475 – 8587 area before it resumes higher. Near term, as far as pivot at 8818.31 high stays intact, expect rally to fail for further downside.
FTSE 60 Minutes Elliott Wave Chart
FTSE Video
https://www.youtube.com/watch?v=a4sMieAdzZQ
BoJ’s Uchida: Yield rise reflects market’s views on economic and global developments
Speaking in parliament today, BoJ Deputy Governor Shinichi Uchida said recent rise in JGB yields "reflects the market's view on the economic and price outlook, as well as overseas developments."
"There's no change to our stance on short-term policy rates and government bond operations," he emphasized, adding that the bond holdings "continue to exert a strong monetary easing effect" on the economy.
When asked whether the prospect of further rate hikes and tapering would continue to drive yields higher, Uchida responded that it is ultimately “up to markets to decide.”
Japan’s Tokyo CPI slows to 2.2% yoy in Feb, industrial production down -1.1% mom in Jan
Tokyo’s core CPI (ex-food) slowed to 2.2% yoy in February, down from 2.5% yoy and below market expectations of 2.3% yoy. This marks the first decline in four months, largely due to the reintroduction of energy subsidies. Meanwhile, core-core CPI (ex-food and energy) held steady at 1.9% yoy. Headline CPI slowed from 3.4% yoy to 2.9% yoy.
In the industrial sector, production contracted by -1.1% mom in January, a sharper decline than the expected -0.9%. Manufacturers surveyed by Japan’s Ministry of Economy, Trade, and Industry anticipate a strong 5.0% mom rebound in February, followed by a -2.0% mom drop in March.
On the consumer front, retail sales grew 3.9% yoy in January, slightly missing the 4.0% yoy forecast, but still pointing to resilient domestic demand.
Fed’s Harker says one inflation report shouldn’t sway policy in either direction
Philadelphia Fed President Patrick Harker noted in a speech overnight that recent inflation data continues to show an uneven path toward the 2% target. He acknowledged that January’s consumer price data came in hotter than expected, marking the fastest increase in 18 months.
However, he stressed that policymakers should "not be moved to act, in either direction" based on a single month’s data.
Harker reaffirmed his stance that the Fed’s current policy rate remains sufficiently restrictive to keep inflation in check without undermining overall economic stability.
Despite inflation’s persistence, Harker remains optimistic about the economic outlook. He stated, “I am of a position that we let monetary policy continue to work.”
Fed’s Hammack signals cautious approach, stresses policy patience
Cleveland Fed President Beth Hammack said Fed has the "luxury of being patient" given the strength of the labor market and the uneven progress in reducing inflation.
In a speech overnight, she noted that while inflation has moderated, it remains above the 2% target, and policymakers are not yet confident that price pressures will fully subside. As a result, she expects the federal funds rate to stay steady "for some time".
Hammack acknowledged that the current policy stance has helped ease inflation, but she warned that risks remain. While Fed anticipates a gradual return to 2% inflation over the medium term, she stressed that this is "far from a certainty."
She suggested Fed will need to take a "patient approach" in monitoring how inflation and the labor market adjust before making any policy changes.
PCE Preview and S&P 500 Forecast: US Economy, Inflation Fears, and Tariff Threats
- The US Personal Consumption Expenditures (PCE) Price Index, the Fed’s preferred inflation gauge, is due Friday.
- Recent US economic data has been weaker than expected, leading to increased market fear.
- Tariff threats by President Trump have added to market concerns about inflation and global growth.
- Technically, the S&P 500 is in bearish territory, having broken key support levels.
The Personal Consumption Expenditures (PCE) Price Index, the Federal Reserve’s preferred gauge of inflation, is set to be released this Friday.
Market expectations indicate that the core PCE, which excludes volatile food and energy prices, could show a 0.3% month-over-month increase, with annual gains of 2.6% for core inflation and 2.4% for the headline figure. These projections suggest only modest cooling from December, signaling that inflationary pressures remain above the Fed’s 2% target.
Does US Data Show Signs of a Stalling Economy?
This week’s US data has underwhelmed and given signs that the economy may be stalling. We have seen market sentiment sour over the past few weeks with the sharp rise in US CPI adding to the market’s skepticism.
The current Fear & Greed Index of 22 reflects a market primarily driven by fear, indicating a very cautious approach among investors. A bounce-back in the US stock market would not be surprising given the extreme fear levels.
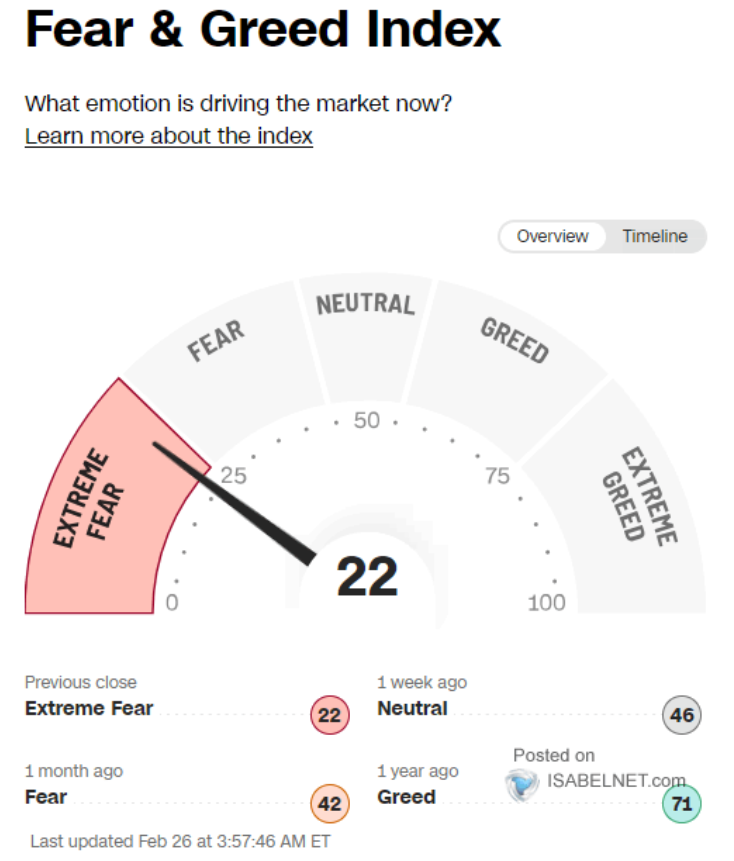
Source: Isabelnet (click to enlarge)
Earlier on Thursday we had the release of US GDP data for Q4 2024. The US economy grew by 2.3% in the fourth quarter of 2024, its slowest pace in three quarters, down from 3.1% in the previous quarter. This matches earlier estimates. Personal spending was the main driver, growing by 4.2%, the fastest since early 2023, with increases in spending on both goods (6.1%) and services (3.3%).
Exports fell slightly less than expected (-0.5% vs -0.8%), and imports dropped more (-1.2% vs -0.8%), which added positively to growth. Government spending also rose more than previously thought (2.9% vs 2.5%). However, private inventories reduced growth by less (-0.81 percentage points vs -0.93).
On the downside, business investments dropped more than estimated (-1.4% vs -0.6%), mainly because of a bigger decline in equipment investments (-9%) and no growth in intellectual property investments (0% vs 2.6%). On the bright side, residential investments improved slightly more than expected (5.4% vs 5.3%).
For the whole of 2024, the economy grew 2.8%.
Despite the lackluster data, today’s tariff comments by President Trump reignited the US Dollar Index rally and weighed on US stocks. President Trump promised reciprocal tariffs are still on course for April 2 while tariffs in Mexico and Canada are set for March 4, next Tuesday.
Tariff Threat to Inflation
Looking at the potential scenarios from tariffs and it continues to weigh on Global markets. OPEC + are having disagreements on a potential output hike in April, with tariffs cited as a key concern.
At present the concerns around tariffs relate largely to its impact on inflation and an impact on Global growth. Inflation fears have been on the rise both in the US and globally, with Central Banks all warning about the upside risks to inflation.
The US CPI print was hot this month while Michigan consumer sentiment and CB Consumer confidence both showed significant increases in the 12 month inflation expectations. This obviously does not bode well for consumers who were hoping for more rate cuts in 2025.
However, Fed Chair Jerome Powell was quick to stress the importance of the PCE data when the inflation print was released a few weeks ago. This has added to the importance of tomorrow’s data release.
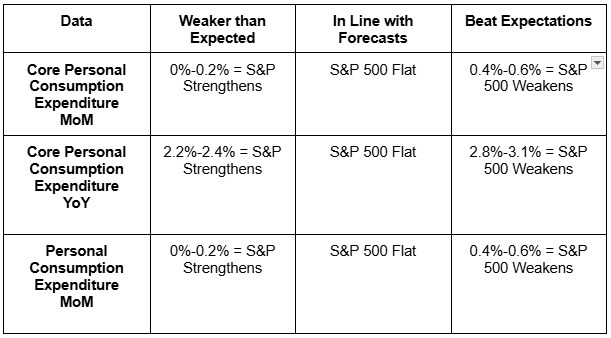
Source: Table Created by Zain Vawda (click to enlarge)
The above table provides an insight into what I expect will happen depending on the PCE prints released later in the day.
My personal expectations are that the data will land quite close to expectations which could lead to some short-term volatility and whipsaw price action before markets settle down.
Technical Analysis – S&P 500
From a technical standpoint, the S&P 500 on a daily timeframe is now firmly in bearish territory having broken below the previous lower high print at 5910.
Price also trades below the 20 and 100-day MAs with immediate support at 5828 and 575 while the 200-day MA rests at 5733.
If there is to be a recovery the S&P 500 will face a challenge at 5910 and 5959 before the 6000 and 6025 handles come into focus.
S&P 500 Daily Chart, February 28, 2025
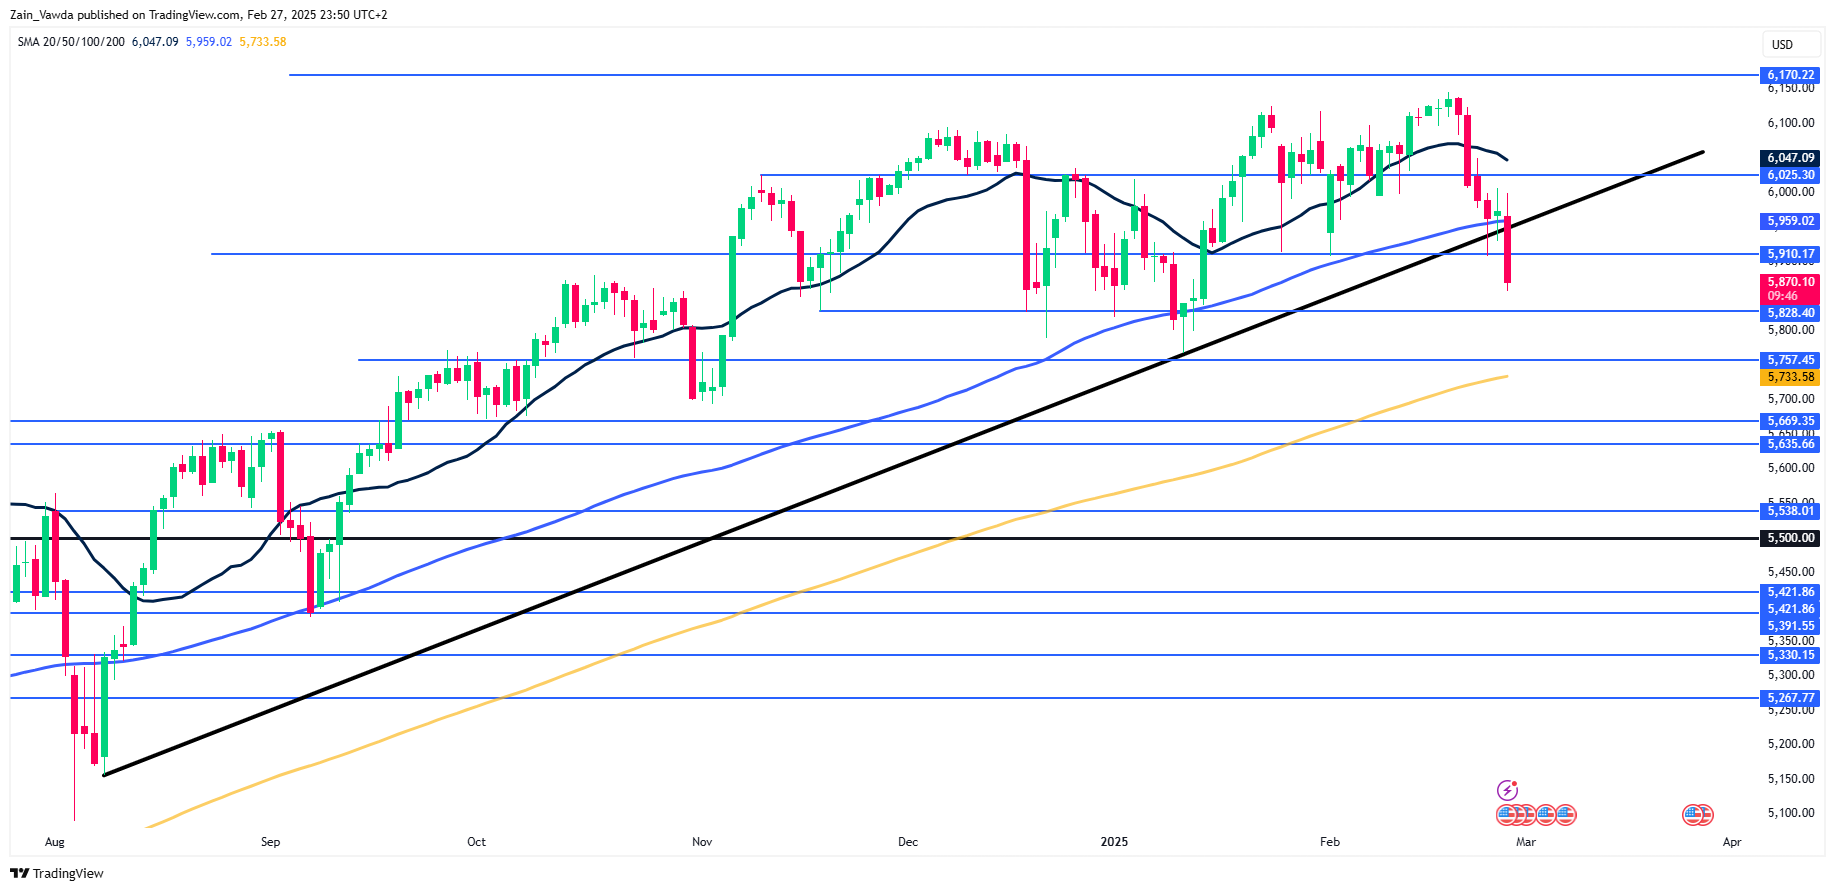
Source: TradingView.com (click to enlarge)
Support
- 5828
- 5757
- 5733
Resistance
- 5910
- 5959
- 6000
- 6025
Cliff Notes: Caution Appropriate, But a Risk to Growth
Key insights from the week that was.
The January Monthly CPI Indicator printed broadly as expected, with prices falling 0.2% in the month, leaving headline inflation up 2.5% over the year to January, the mid-point of the target range. In the monthly detail, there were surprises on both sides. On the one hand, the roll-off of Queensland’s state government energy rebates saw electricity prices jump more than expected. However, dwelling price inflation continues to ease. The trimmed mean estimate printed at 2.8%yr, up slightly from 2.7%yr in December; but, like all other ‘core’ measures of inflation in the month, it remained within the 2-3% target band. One monthly result is not enough to shift expectations, especially as the monthly measure is only a ‘partial’ read on inflation. The next update for the quarterly series is not due until just before the RBA’s May Board meeting.
In the lead-up to Q4 GDP due next week, two partial indicators of investment were also received.
Although construction activity was softer than expected in the quarter, up 0.5% in Q4, the trend over last year points to a solid recovery, up from an annualised pace of 1.3% in H1 to 5.0% in H2. Public infrastructure has played an important role in supporting construction activity; a nascent recovery in private activity has also started to form across both infrastructure and residential construction. Importantly, the price detail suggests capacity constraints are starting to ease.
Private CAPEX subsequently surprised to the downside, the –0.2% fall in Q4 bringing the annual pace down to a tepid 0.6%yr. Weakness was evident across the sectors but concentrated in mining (–0.6% versus -0.1% for non-mining). On investment intentions, 2025-26 CAPEX plans made clear the uncertainty present in both the domestic and global economy, the first estimate reflecting a pullback in firms’ investment expectations.
However, it is important to recognise the variability seen in early estimates of CAPEX expectations for a given financial year and the emerging positives for business, discussed in depth in Westpac’s latest Quarterly Business Snapshot.
Our preview for Q4 GDP will also be published later today on Westpac IQ.
It was a quiet week for international data. Of greatest significance, US consumer confidence data highlighted concern amongst households over the potential economic consequences of tariffs and immigration policy, particularly for inflation. Core durable goods orders meanwhile implied businesses are largely waiting to see how the economy evolves before committing to new capital expenditure, and home sales data the impact of higher mortgage rates on affordability – new and pending home sales down 10.5% and 4.6% respectively in January.
On tariffs, President Trump announced he is pushing ahead with the 25% tariff for all imports from Mexico and Canada (excluding energy) on 4 March. An additional 10% tax will added for China at the same time. European imports will also face a 25% tariff and, come April, reciprocal and product-specific tariffs will follow. Canadian Prime Minister Trudeau quickly vowed an immediate and strong response to the formal introduction of tariffs on Canada, which could elicit a further response from the US. It is unsurprising that the FOMC members who spoke through the week highlighted uncertainty for inflation and inflation expectations and a need for caution with policy.
Back in Asia, the Bank of Korea lowered its base rate by 25bp to 2.75%, the third cut since October 2024. Accompanying the decision was a downgrade to the 2025 growth forecasts, from 1.9% for 2025 to 1.5%, owing to the impact of tariffs and dwindling domestic demand. Tariffs are now expected to be imposed in Q1 2025, earlier than previously thought, and are also expected to be larger. Allowing policy to respond, core inflation is expected to be lower in 2025 at 1.8% (previously 1.9%). The Bank of Thailand also cut rates by 25bps to 2.0%, surprising markets. The cut came as structural problems in the manufacturing sector threaten growth. Tariffs and trade tensions in the region will only further exacerbate existing problems.
Without the inflation concerns of the US, emerging market economies in Asia have the capacity to take a proactive approach to managing the growth risks that will eventuate from geopolitical tensions and tariffs.
It Matters That ChatGPT Can’t Build Houses
Macroeconomics tends to treat the economy as a single thing. But most shocks and every new technology skews in some way towards particular industries or activities.
One of the limitations of macroeconomics is that we tend to assume that everything is the same across the whole economy – it’s a reflection of the ‘macro’ in the name. We talk about a single inflation rate, even though the CPI is comprised of the prices of a wide array of goods and services. We talk about a single unemployment rate, even though different people will experience that unemployment rate differently, depending on whether they are one of the unemployed. We treat each economy-wide phenomenon as a ‘thing’ and start our analysis from the models we learned at university that assume some amorphous ‘representative agent’.
Better data availability has improved the situation and encouraged a more sectoral approach. And there are newer models that allow some variation between people or firms, or ‘heterogeneous agents’ in the economics jargon. But too often, people assume that company-level or industry-level shocks wash out in the overall outcome, even though the conditions for that to be true do not actually hold. Most of the time, this simplifying assumption doesn’t matter – until it does.
As we have previously argued, when it comes to setting monetary policy, it is appropriate to focus on overall inflation and not pick and choose the bits of inflation you will focus on. But that is not the same as pretending that the divergences in the total do not exist. It is all very well to be alert to sectoral or regional differences. But if the models of inflation used to forecast implicitly assume a single-good economy, there is a risk your forecasts will go astray.
This issue is particularly salient because the shocks that have hit the Australian economy over the past quarter-century have, in essence, been sectoral shocks. First was the dot-com boom and bust, which rather obviously hit the tech sector hardest, though the longer-run boost to productivity was more widespread. The GFC was a crisis in the finance sector. The mining investment boom and bust was even more consequential for the Australian economy than the dot-com boom, and even more skewed to a few sectors and regions.
The pandemic was the quintessential sectoral shock. In-person services were shut down to reduce the spread of COVID-19. Demand for certain goods spiked as people set themselves up to work from home, at the same time as supply chains for these goods were disrupted by pandemic-related restrictions. Goods inflation and services inflation had completely different trajectories – though to be far, that is true most of the time.
One could reasonably object that in a well-functioning market, labour and other resources will move and we can treat the economy as a single goods market, or the labour market as one market. But in the real world, it takes time – and changes in relative prices – to get resources to shift.
In fact, a key lesson from the mining investment boom and bust was that, when a sector that had previously dominated growth and squeezed out all the other sectors eventually turns around and retrenches, it is hard for the rest of the economy to bounce back quickly and fill the gap. The other sectors just do not adjust as fast as the models assume, especially if that means people moving states as well as jobs.
This is why we are a little nervous about what happens when the incredible ramp-up in the care economy finally matures. The non-market sector (health & social care, education and public administration & defence) accounted for about 85% of all the jobs growth over 2023 and 2024 (we will have Q4 data for 2024 next week to confirm). This was despite this sector accounting for just 27% of total hours worked. It is probably a large part of the reason why the vacancy rate and business survey measures of labour market tightness remain elevated. While the market sector is not increasing employment much, firms in that sector are still having to replace workers who have left to take care economy jobs, and they are finding that difficult.
This outsized growth will eventually end, as we have previously flagged. Will the market sector bounce back quickly enough to fill the gap? Currently our forecasts assume that the handover is reasonably smooth and the overall labour market weakens only modestly. But we are mindful that a shaky handover between public demand and private demand, between non-market and market sector employment, is a risk scenario.
The expansion in the care economy has also led to some discussion about the implications for measured productivity growth. (Though possibly not actual productivity growth, as anyone who has benefited from keyhole surgery or moonboots can attest.) But there is another layer to the issue of productivity and sectoral differences.
Productivity growth is not an economy-wide phenomenon. It is the product of many individual decisions about how we use our time (recall that labour productivity is just ‘Stuff’ Divided by Time). In particular, it is partly the result of decisions about whether and how to innovate – in particular by adopting new technologies. Productivity growth is not some trend that is bestowed from the heavens – it is kicked along by waves of new technologies.
The point is that every new technology – even the so-called ‘General Purpose Technologies’ – is tuned to different activities and thus industries. Steam power and electricity had general application, but they were more transformative to energy-intensive activities in manufacturing. Computers and the internet revolutionised information-intensive activities like finance far more than, say, the hospitality industry.
So it will also be for the AI revolution. Generative AI and related innovations leverage our ability to produce content or transform information. In the real ‘meatspace’ world of physical action, it has less to offer (though probably not nothing, to the extent that improved robotics are also part of the story). This means the impact will be greater, and faster, in some industries than others.
In particular, that very ‘meatspace’ physical industry of construction is likely to be less impacted. AI could improve scheduling and procurement for projects, and could simplify and speed up regulatory processes (something Vancouver is already doing). But there is a big difference between generating a realistic picture of a bricklayer and actually laying bricks.
As noted above, we do not regard the overall trend in (non-mining) market sector productivity growth as particularly alarming. But again, this is an area where it pays to dig below the surface total and examine the detail. In the construction industry, the story is far less benign. The
Productivity Commission has recently released a report showing the long-run decline in construction productivity. The building part of the sector has seen an outright trend decline in the level of productivity for the past two decades. This is an international phenomenon, not Australia-specific. The volume and nature of regulation matters here, but so does the structure, culture and composition of the industry.
Even with population growth now rolling over, the imperative to house a growing population becomes all-the-more acute. Rising productivity will be a key enabler, and that means leveraging technological innovation. The problem is that the innovations we are currently in early-stage adoption of might not be the ones best tuned to that task.