Sample Category Title
Crypto: Is Lowest Sentiment Best Moment to Buy?
Market Picture
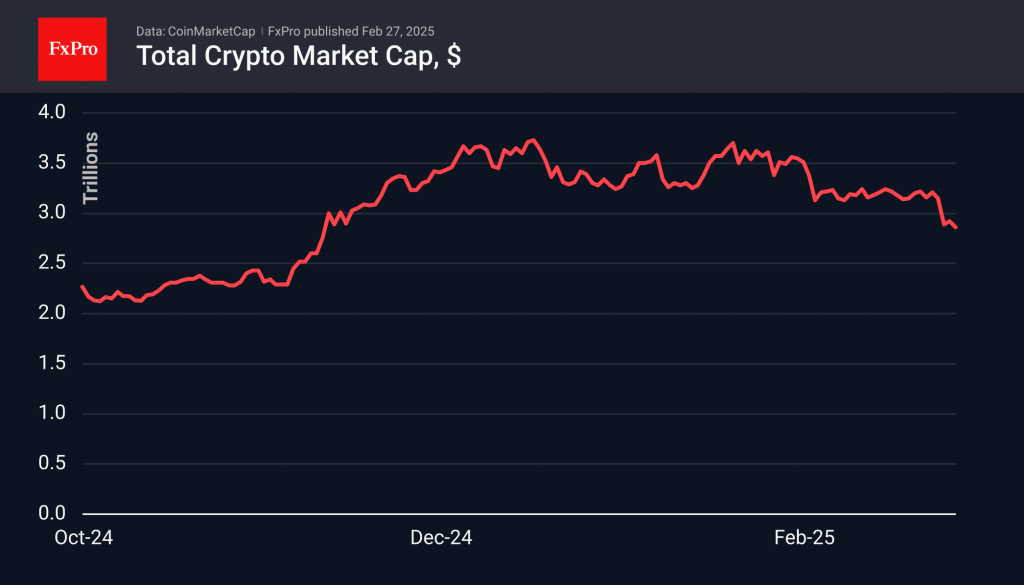
The cryptocurrency market stabilised in the first half of Wednesday, but by the end, a new wave of selloffs began, leading to new lows since early November at $2.75 trillion. In the morning, attempts were again made to stabilise the market. Increased trading activity was accompanied by increased volumes, indicating both accelerated liquidation of positions and interest in buying on declines.
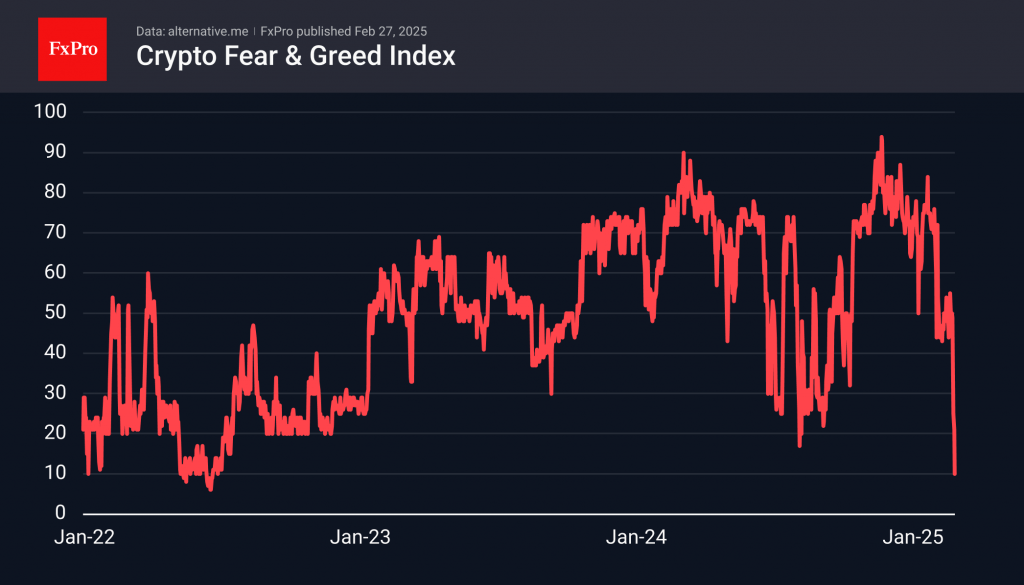
The Fear and Greed Index fell to 10, which is an indicator of extreme fear and was last recorded in June 2022. The index has only been below this value for 19 days in its seven-year history. While the indicator is intended to be a good buy point, experience trading other markets suggests that this may be far from a lower price point.
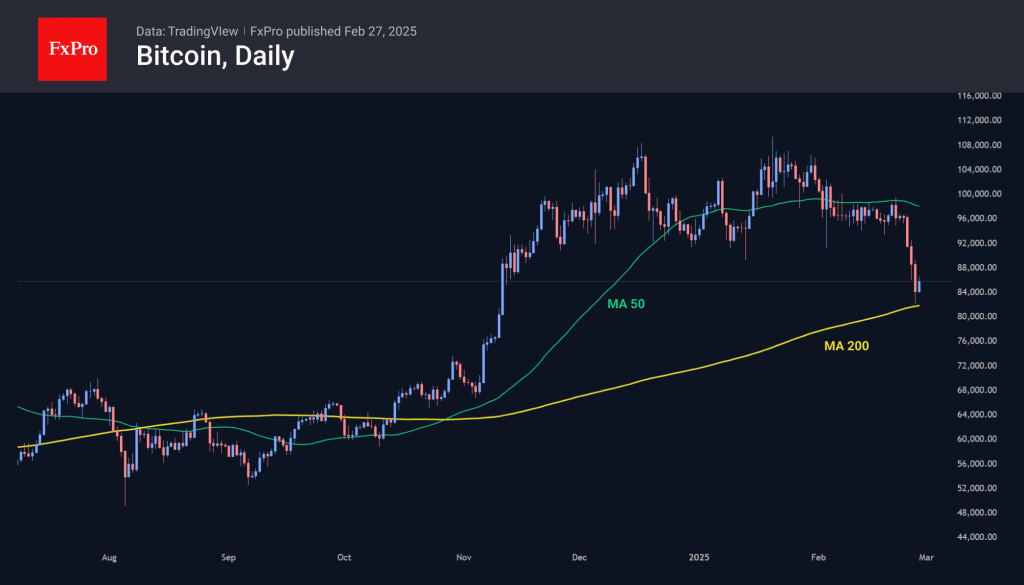
Bitcoin is trading around the $86,000 mark, although the previous evening, it was approaching $82,000 and touching its 200-day moving average. Earlier in the week, the consolidation pattern was broken, and now market participants are trying to determine the endpoint of the decline.
Unusually, the largest altcoins remained within the range established the day before despite the significant decline over the week.
News Background
Institutional investor demand for BTC has reached its limit, according to QCP Capital. The period of high uncertainty in the market will continue for a few more weeks against the backdrop of the Trump administration’s decision to impose duties on goods from Canada and Mexico, as well as to limit investments of Chinese companies in the American economy.
Experts at QCP Capital warn that in volatile markets, cryptocurrencies remain the first assets to be liquidated as traders seek to reduce risk.
In Ethereum options, open interest in contracts with a $2000 strike is growing, reflecting investor caution. At the same time, CF Benchmarks noted a rotation out of calls as market participants reduced expectations of a breakout.
The US Department of Justice has allegedly initiated an investigation into Argentine President Javier Miley’s role in promoting LIBRA, according to the Argentine publication La Nacion.
Gold: Extension Below $2,900 to Mark Healthy Correction Ahead of Fresh Push Higher
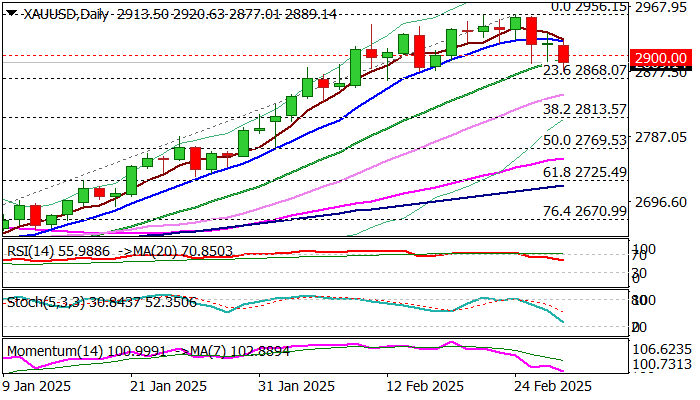
Gold price dips below important support at $2900 where the price action showed hesitation in past two days, but initial negative signal from double downside rejection and long tails of daily candles, is likely to be offset by fresh drop today.
It seems that investors opted for stronger profit-taking after President Trump signaled that tariffs on imports from Canada and Mexico could be postponed for another months, with deeper pullback to provide better buying levels.
The notion is supported by growing uncertainty over tariffs and threats of trade war, while geopolitical situation remains fragile that keeps strong safe haven demand.
Close below $2900 to validate fresh bearish signal and expose supports at $2868 (Fibo 23.6% of $2582/$2959 upleg) and $2845 (30DMA) with dips expected to find ground at $2813/10 zone (Fibo 38.2% / lower 20-d Bollinger band) to mark healthy correction and keep larger bulls in play.
Res: 2900; 2919; 2942; 2956.
Sup: 2868; 2845; 2810; 2769.
Elliott Waves Shows Gold Turning South for Corrective Retracement
Gold started the year bullish with a strong extended leg to the upside close to 3k, but the move looks impulsive and may have found a temporary top near 2950. The reversal this week is coming from an ending diagonal, with the price now attempting to break the lower trendline support of the bullish channel. This suggests gold could be entering a corrective wave 4, likely unfolding in three waves. For those looking to join the trend, it’s better to wait for a deeper correction and a retest of lower support in this wave four pullback. Supports are at 2864 and 2789
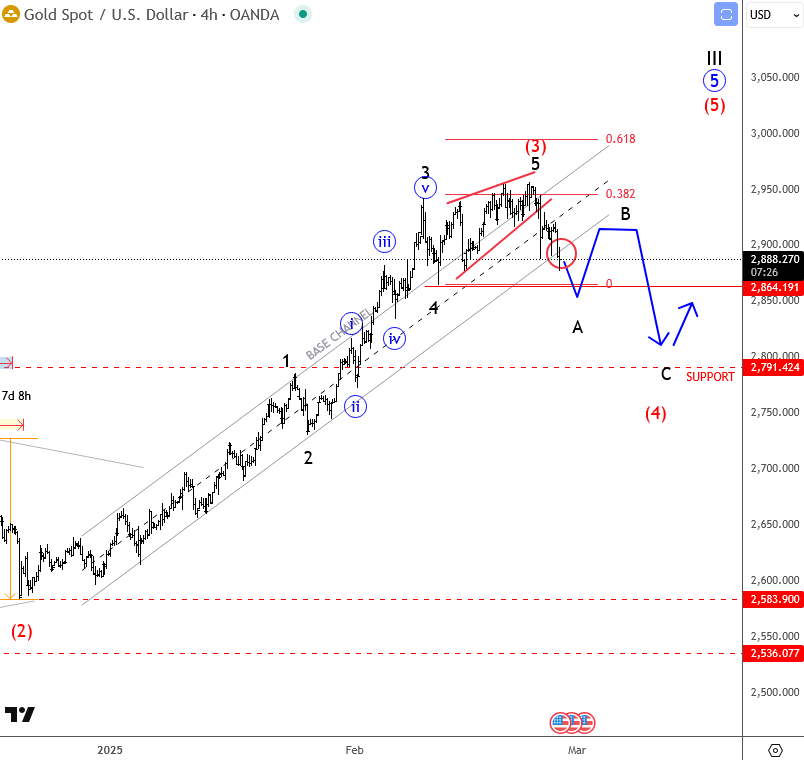
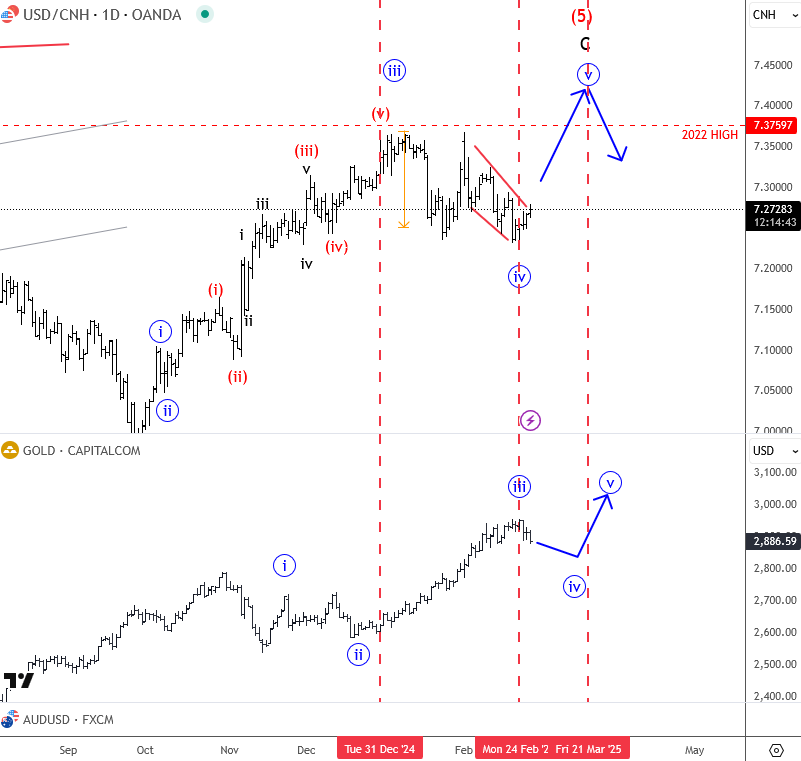
At the same time, keep an eye on USD/CNH—if it pushes higher to retest its 2022 highs, gold could remain sideways for a while. Better opportunities to rejoin the gold uptrend may come after USD/CNH completes its recovery from the 2024 lows, possibly around 7.40.
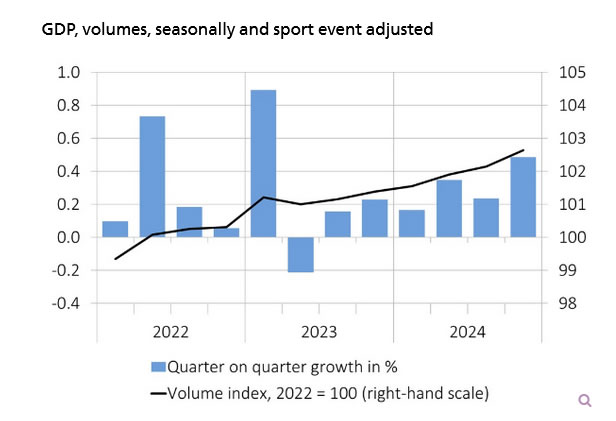
Swiss GDP expands 0.2% qoq in Q4, driven by domestic demand
Switzerland's economy maintained steady growth in Q4, with GDP expanding 0.5% qoq when adjusted for sporting events. Without the adjustment, GDP rose 0.2% qoq, in-line with expectations.
Private consumption increased by 0.5%, supported by higher spending on health, recreation, and culture. Government consumption also grew at the same pace, slightly exceeding historical trends.
Investment in equipment rebounded 1.0%, breaking a two-quarter decline, largely due to higher spending on aircraft and other volatile categories.
The increase in domestic demand also led to a 0.9% rise in imports of goods and services, with foreign trade contributing positively to GDP growth.
USD/JPY Steadies as the Market Consolidates After Fresh Lows
USD/JPY is consolidating near 149.33 on Thursday, with the yen pausing its rally while holding near four-month highs against the USD. This stabilisation follows renewed support for the US dollar amid concerns that US President Donald Trump’s trade tariff policies could escalate once again.
Key drivers influencing USD/JPY
Trump recently announced plans to review the possibility of imposing reciprocal 25% tariffs on European cars and other goods. Additionally, he confirmed that tariffs on imports from Mexico and Canada will take effect on 2 April rather than the initially planned 4 March. These developments have intensified trade tensions, lending support to the USD.
Despite today’s consolidation, the yen remains strong, with expectations that the Bank of Japan (BoJ) may continue raising interest rates this year following Q4 inflation data.
Additionally, the JPY remains in demand as a safe-haven asset amid ongoing uncertainty and underlying risks in global financial markets.
A crucial set of economic data will be released on Friday, including figures on industrial production, retail sales, and Tokyo’s inflation rate. These reports could provide further insight into the BoJ’s future monetary policy trajectory.
Technical analysis of USD/JPY
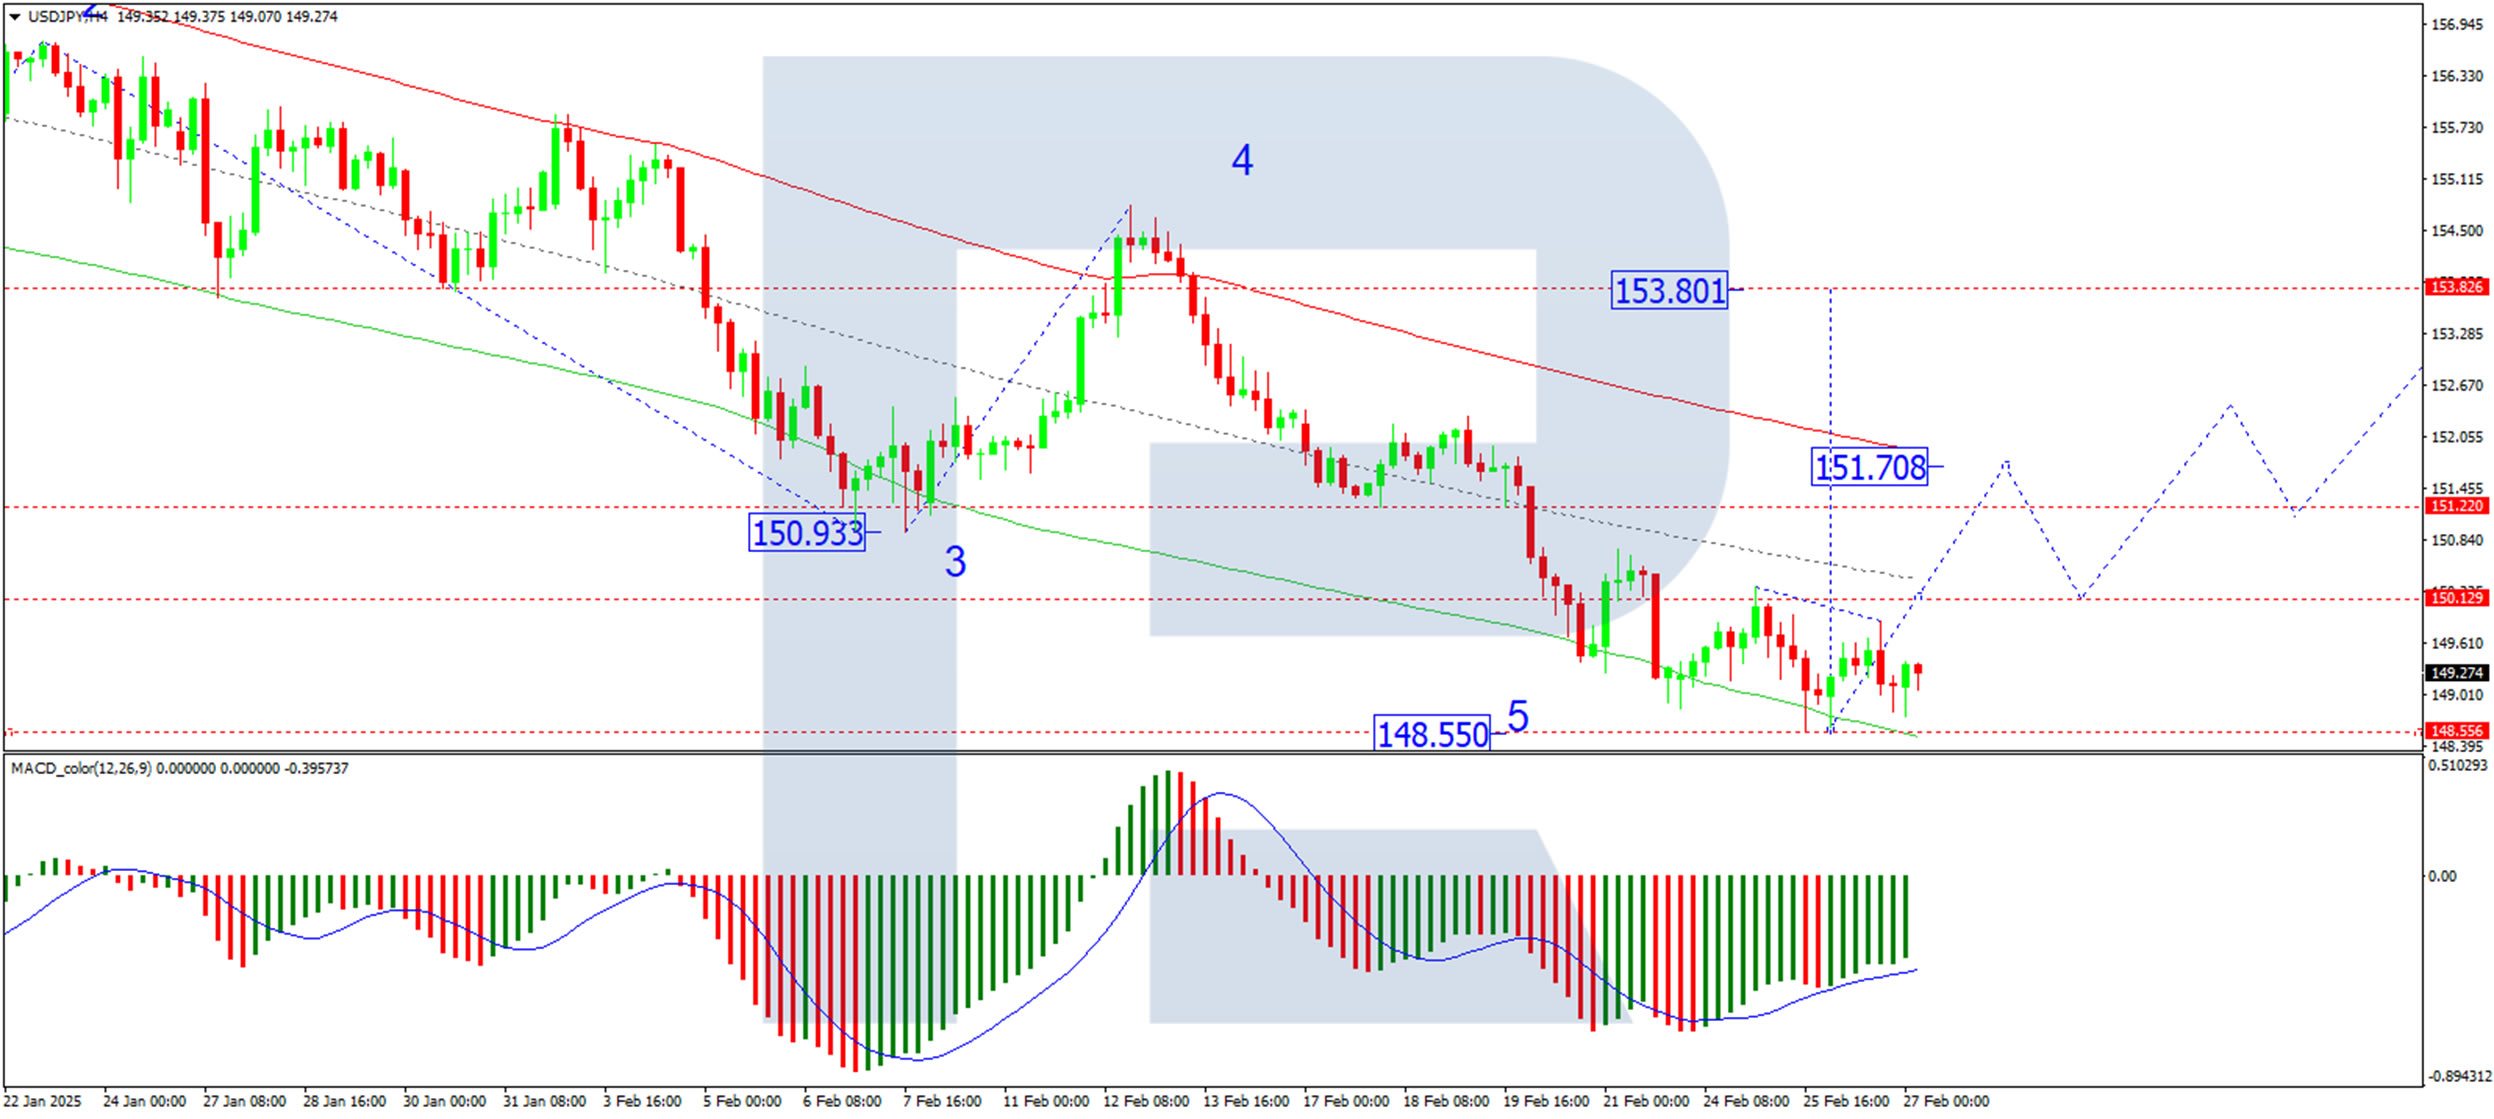
On the H4 chart, USD/JPY completed a downward wave to 148.55. The market is now forming a consolidation range at this low. A corrective move towards 151.80 could develop if the price breaks upward, marking the first key target. Upon reaching this level, a further corrective decline towards 150.20 may follow. The MACD indicator confirms this scenario, with its signal line positioned below zero but pointing upward, indicating potential correction.
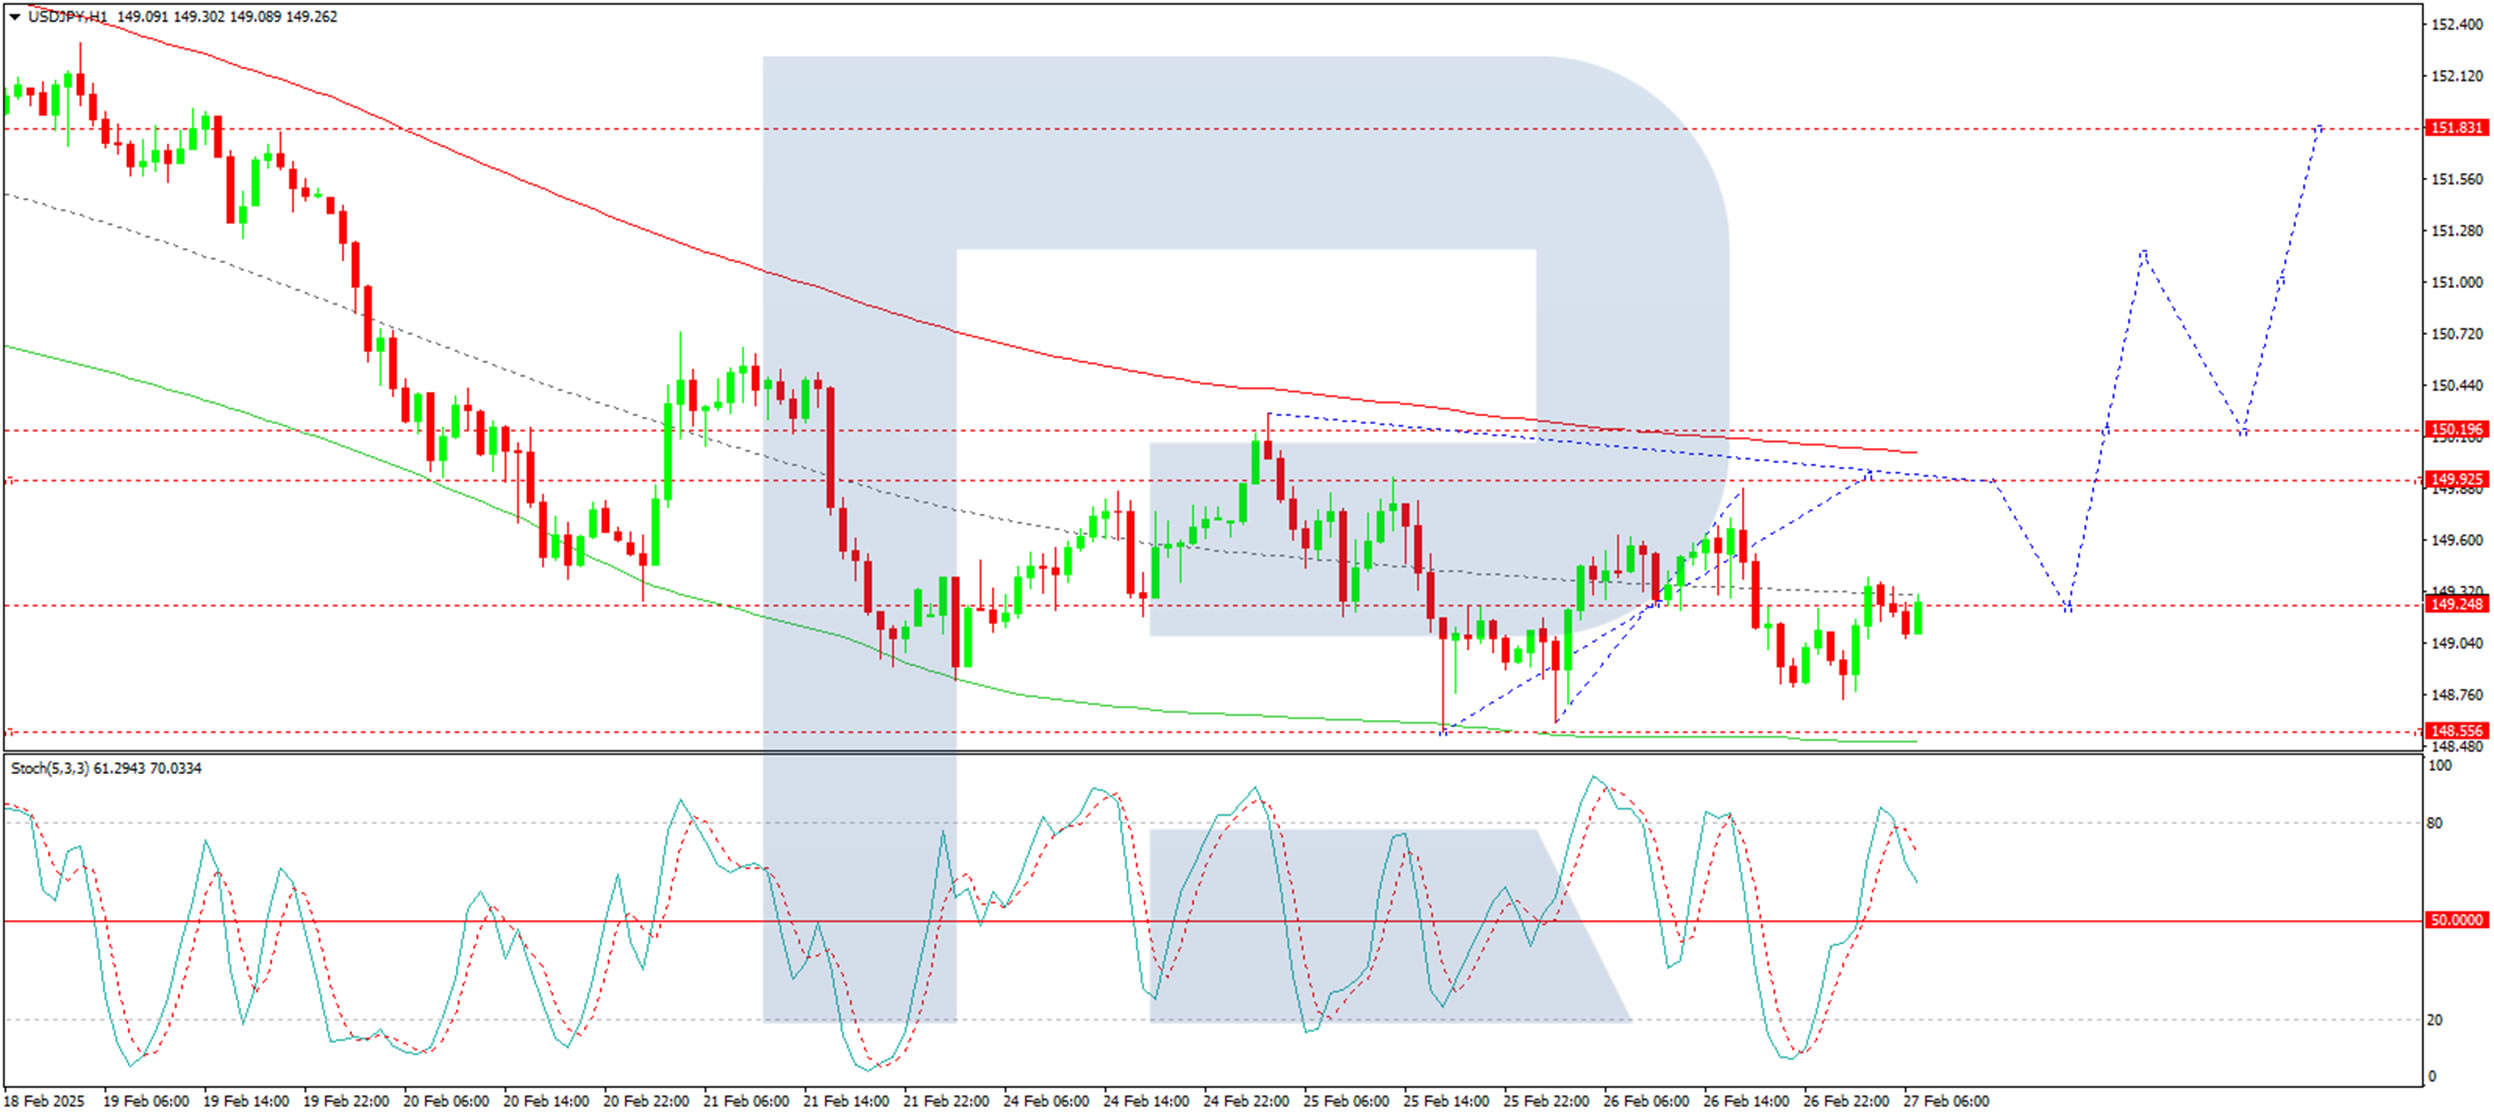
On the H1 chart, USD/JPY is forming an upward wave structure towards 150.00. A broad consolidation range is developing around 149.25. If the price breaks upwards from this range, a correction towards 151.80 could unfold. After reaching this target, the pair could pull back to 150.20. The Stochastic oscillator supports this outlook, with its signal line above 50 and pointing upwards, suggesting short-term bullish momentum.
Conclusion
USD/JPY has temporarily stabilised after recent declines, with technical indicators suggesting a potential corrective move towards 151.80. However, upcoming Japanese economic data and ongoing geopolitical uncertainties could introduce volatility. Market participants will closely monitor BoJ signals and further developments regarding US trade tariffs, which could impact the yen’s safe-haven appeal.
Gold Price Drops Towards Key Support Zone
As shown on the XAU/USD chart, the price of gold per ounce has already fallen by more than 1% today. This bearish sentiment may be driven by:
→ A strengthening US dollar, influenced by President Trump’s plans to impose international trade tariffs.
→ Market positioning ahead of key US economic data releases, including GDP growth figures and the Core PCE Price Index.
→ A sharp decline in China’s gold imports via Hong Kong—the country’s main gateway for bullion purchases—which fell to a near three-year low in January.
Technical Analysis of XAU/USD Chart
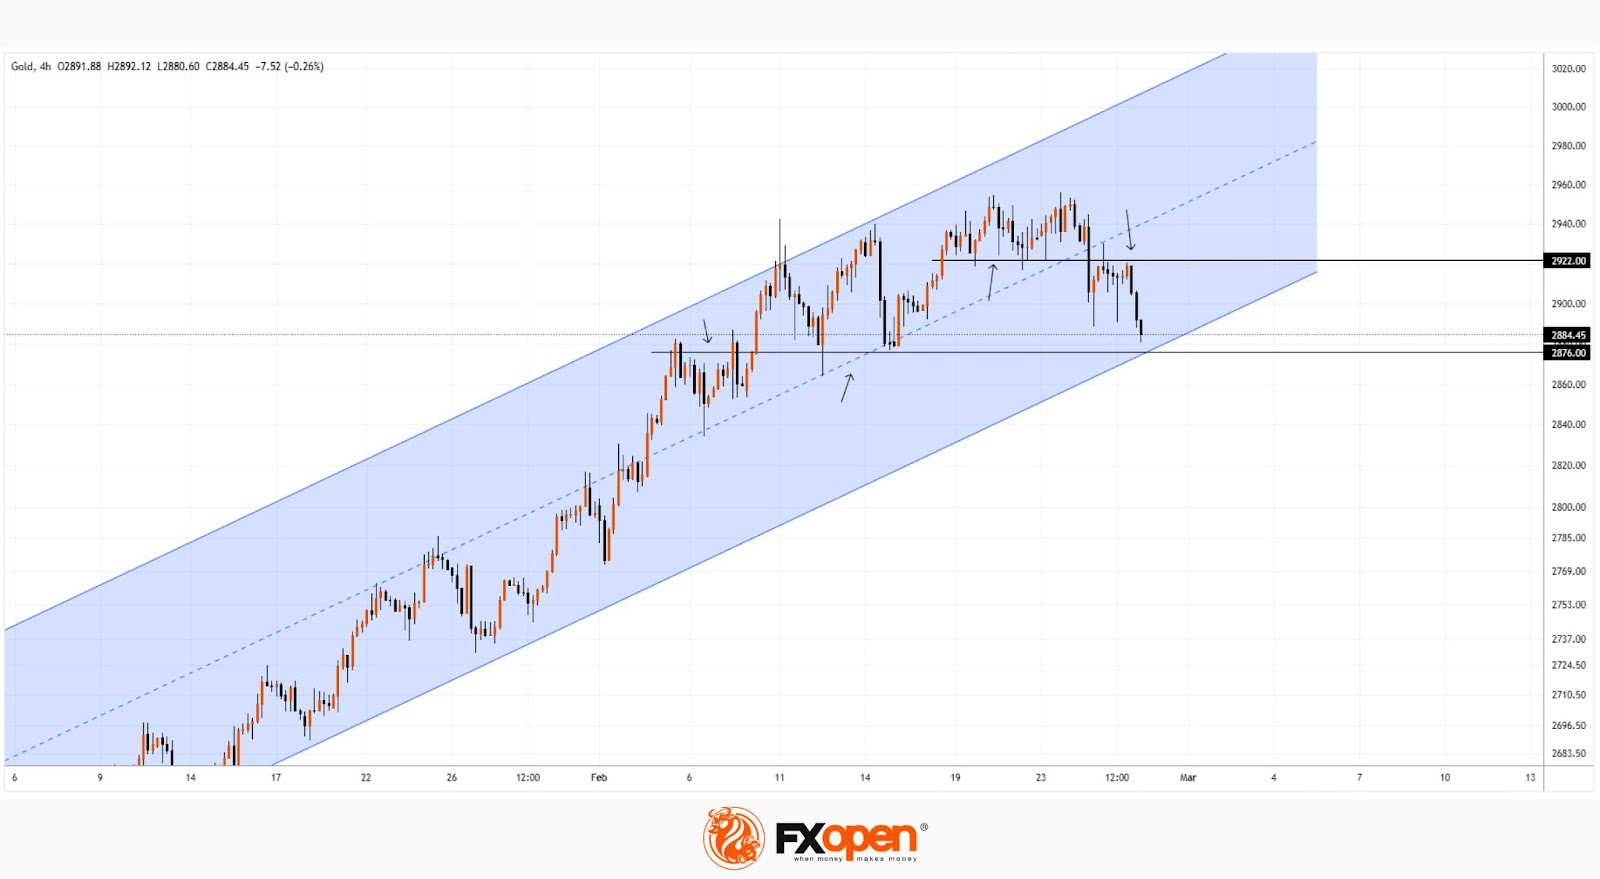
Gold price fluctuations have formed an upward trend channel, marked in blue, with the current decline bringing the price close to its lower boundary.
Key levels to watch:
→ $2,922 has shifted from support to resistance.
→ $2,876, which previously acted as resistance, may now serve as a support level.
Given these factors, the intersection of the lower boundary of the blue channel and the $2,876 support level could trigger a rebound, offsetting some of the bearish momentum seen so far.
Start trading commodity CFDs with tight spreads. Open your trading account now or learn more about trading commodity CFDs with FXOpen.
This article represents the opinion of the Companies operating under the FXOpen brand only. It is not to be construed as an offer, solicitation, or recommendation with respect to products and services provided by the Companies operating under the FXOpen brand, nor is it to be considered financial advice.
All the Tariff Comments Changes Trading Vibes
Markets
The rally in US Treasuries was briefly interrupted yesterday after the US House passed a budget resolution in a first important step towards extending tax cuts, stemming stagflation fears. The US-Ukraine mineral deal and Ukrainian president Zelensky’s planned trip to Washington helped create a positive risk climate during European dealings. Even EC von der Leyen’s new Clean Industrial Deal was thrown in the mix. It hopes to cut ties (“high energy costs and fierce and often unfair global competition”) that still hold European companies back and make a clear business case for Europe. US stock markets equally took a flying start, recovering from a 3-day setback in the run-up to Q4 earnings by AI-bellwether Nvidia.
Enter US President Trump… At the first cabinet meeting of his second term, he said that a decision was made on plans for EU tariffs and that an announcement would come very soon: “It will be 25% generally speaking, and that will be on cars and all other things.” EC spokesman Gill said in response that the EU will react firmly and immediately against unjustified barriers to free and fair trade. “We’re ready to partner if you play by the rules. But we will also protect our consumers and businesses at every turn.” Trump’s comments were messy though as he suggested that levies on Canada and Mexico would take effect on April 2, suggesting a delay from the current March 4 deadline, only to be corrected by commerce secretary Lutnick who noted that neighboring countries still had to satisfy the president’s demands on fentanyl. Lutnick added that April 2 is the starting date of baseline reciprocal tariffs. All the tariff comments changes trading vibes after the European closing bell. The S&P 500 lost for example 1% intraday after the initial comments. US Treasuries swapped losses for gains with a strong $44bn 7-yr Note auction making it three in a row. US yields eventually lost 2.4 bps to 4.6 bps with the front end of the curve underperforming. EUR/USD was changing hands just below first resistance at 1.0533 ahead of the tariff comments, to slip back to 1.0470 currently. Overall damage remains contained. European equity futures are crawling back from bottoms set in after-hours trading yesterday. Nvidia earnings were strong, but didn’t trigger a strong directional move in the company’s share price afterwards and don’t set the tone for trading this morning. Today’s eco calendar contains Minutes of the previous ECB meeting and US durable goods orders, but risk sentiment will remain the key market driver. Despite this morning’s “muted” response, we’d continue to err on the side of caution at the moment.
News & Views
The EU pushes ahead with plans that were still under discussion last week to relax targets for the intermediate gas storage levels. Member States currently need to have filled storage capacity at 90% by November 1, ahead of the winter when gas demand is at its highest. The rule came after Russia’s invasion of Ukraine after which the EU cut (almost) all of the Russian gas imports. But traders say this distorts the market as countries now are forced to buy all at the same time. Gas is typically bought in the summer months because it trades cheaper due to lower demand. It then gets resold at a profit during the winter peak season. Because of the EU rule, however, and due to already unusually low storage levels (colder weather, low renewable energy production) summer prices are currently trading at its largest premium ever over the winter. Such a similar disincentive to buy gas to put into storage has required government intervention back in 2022. The EU has not explained in detail what it plans to do yet but traders say that lowering the 90% threshold to 80% would help calm down the market. Natural gas prices (Dutch TTF) extended a sharp decline yesterday. After hitting a 2-yr peak just shy of €60/MWh mid-February, prices trade around €41.
A major labor union in Japan representing several household name manufacturers such as Toyota, Panasonic and Nippon Steel, said its members are aiming for a record wage increase in the annual negotiations. They demand a 14% bump, the largest since tracking began in 2014. It’s further evidence of a virtuous spiral between rising wages and sustainable inflation that the Bank of Japan is seeking to underpin future rate hikes. Japan’s largest labor union, Rengo, based on early demands of its members, already suggested they aim for a pay increase similar to last year’s three-decade high. Rengo will release the official requested rise on March 6, followed by an initial report on the actually agreed terms a month later.
Nvidia Beats, But
Nvidia continues to do an amazing job. The revenue grew 78% in Q4 compared to a year earlier and came in at $39.3bn, higher than the $38.5bn pencilled in by analysts. Net income hit $22.1bn, an 80% surge from a year ago, also beating analysts’ expectations. The revenue from data center was up by 93%. And the revenue from the Blackwell chip – launched last quarter – hit an eyepopping $11bn. The company also gave a higher-than-expected revenue forecast of around $43bn for the current quarter. If we put in perspective, the revenue was just about $6bn when the AI buzz stared in 2023.
But there is a catch: manufacturing of Blackwell chips proved to be complex and costlier, and could squeeze the profit margins more than anticipated earlier. But the company’s gross profit margin is 73.5% today, comfortably high. Cherry on top, the CEO Jensen Huang repeated that the demand for Blackwell chips remains ‘amazing’, the Stargate project will likely keep the AI spending robust, and in all cases Nvidia’s biggest clients have pledged to continue to spend big on AI this year. And about 90% of Nvidia’s profits came from data center segment last quarter – that’s basically the business that comes from large cloud service providers and other tech firms.
In summary, the numbers looked good, the forecast sounded good too. There is no doubt that Nvidia’s business is still rolling on silk and that the company will continue to thrive. But if you look at the market reaction, you would hardly guess that the company reported such strong results. Nvidia’s stock price fluctuated in the afterhours trading and printed a 1.50% decline, warning that
1. Investors are getting harder to impress with smaller revenue beats (and the fact that the company didn’t hit the $40bn mark certainly played a role)
2. The valuation is pretty high today. Finimize analyst writes that the company should print a 30% growth every year for the next decade to justify its actual valuation.
3. And of course, the rising competition, the risk that the Big Tech clients launch their own chips and reduce demand for Nvidia chips, the tariffs and the risk that we may have overestimated AI demand will continue to hang in the air.
Nvidia is expensive but not exaggeratedly overpriced (PE ratio around 50). The dips could still serve as interesting buying opportunity for long-term investors.
Zooming out
Nvidia may not boost the market sentiment in the same way it boosted over the past two years after its results, but the AI mascot’s earnings will sure not harm the AI outlook, or be an additional drag. S&P500 and Nasdaq futures are up this morning. Let’s see if optimism could survive to the tariff talk, with the ongoing comfusion regarding when Trump’s 25% tariffs on Mexico and Canada would go live: March, April?
Of course, the tariff threats are weighing on global sentiment but also on US’ own growth expectations. The US growth update is due today and is expected to show a slowdown from 3.1% to 2.3% in Q4. If that’s the case, you could argue that the dovish Federal Reserve (Fed) expectations will get a boost. BUT the tariffs complicate the Fed outlook as they boost inflation expectations at a time inflation is already giving signs of heating up and will certainly limit the Fed’s ability to step in and assist.
As such, the US dollar index has been trending lower on Trump fatigue, but the index has rebounded yesterday near an important Fibonacci support, the 106 level that is the major 38.2% Fibonacci retracement on September to January Trump-boosted rebound. The EURUSD is down for a second session. Failure to clear the 1.05 sustainably could weigh on sentiment. There is optimism on the other hand that the US could agree with Ukraine on sharing its minerals to end the war with Russia. The end of the war would be good news for Europe. And better if the war ends with Europeans getting their own share of the pie. The DAX rallied 1.71% on hope that the Ukrainian war could soon end, and release pressure on energy prices and help the nation go back to growth after years of slowing. If the European Central Bank (ECB) continues to give support with lower rates, that would be even better. But the ECB’s ability to cut rates depends on inflation outlook, as well. So watch Spain release its preliminary CPI update for February today, and France, Italy and Germany update their numbers tomorrow. If the CPI update is softer-than-expected, we could see a further downside pressure on the euro but a sustained appetite for equities.
Focus on US GDP and Fed Speak
In focus today
In the US, 2nd estimate of Q4 GDP will be released in the afternoon. The flash release showed GDP growth cooling to 2.3%, but with private consumption growth remaining solid. Several Fed speeches are also scheduled for today, including ones from Hammack, Harker, Barkin and Schmid.
In the euro area, we look out for data on credit and money growth in January. Credit growth will indicate the degree of restrictiveness of monetary policy, thus serving as a notable datapoint for the ECB.
In Spain, inflation data for February is released, providing signals of the euro area print on Monday. We expect inflation to decline in February due to lower energy inflation and services inflation. Services inflation is expected to decline significantly in the coming months due to base effects from the large increases recorded in the same months last year.
In Norway, we expect Norges Bank's Expectations Survey to show that inflation expectations will continue to fall in both the short and long term. We will also focus on the wage expectations of the labour market organizations for 2025 and 2026. We are also keeping an eye on whether the preliminary employment figures for January will confirm the weak trend seen in December, or whether it was noise.
In Sweden, we receive the Economic Tendency Indicator from the National Institute of Economic Research. We will be looking closely at the companies' pricing plans following yesterday's high PPI figures and last week's high inflation figures. Data on the trade balance and household lending is also released.
Economic and market news
What happened yesterday
In the US, mixed signals came from the White House, as President Trump reportedly opened the door for postponing the tariffs on imports from Mexico and Canada, stressing they could take effect on 2 April. Conversely, a White House official stated that Trump's initial 4 March deadline remained in effect. Simultaneously, Trump also threatened to impose 25% tariffs on EU goods - "that will be on cars and all other things". All in all, the ambiguous tariff signals could suggest that Trump is using them as a negotiation tool, also underscored by a modest market reaction to the remarks. Hence, tariff uncertainty remains.
In geopolitics, President Zelenskyy was on the wire, emphasizing that the success of the minerals deal with the US hinges on this upcoming talks with President Trump. At the same time, Zelenskyy reiterated statements from his deputy prime minister and justice minister, noting that the agreement is part of broader deals with the US, while it could also be included in future security guarantees. Trump confirmed that Zelenskyy will travel to the US on Friday to sign the deal but indicated that the US would not provide any far-reaching security guarantees, saying that Europe should take on that responsibility.
We are hosting a webinar today at 09:30-10:00, guiding you through the status and what to expect in terms of possible outcomes and the channels of economic impact. To listen in, please use the following link: Webinar - The new security disorder in Europe - what are the economic implications?, 27 February.
In the euro area, the EU commission presented its "Clean Industrial Deal" comprising its business plan for reviewing economic growth and achieving decarbonisation by unlocking investments in clean industries. The deal aims to boost demand for made-in-Europe products, making energy more affordable, securing access to raw materials, and sharply cut the number of SME companies affected by reporting requirements. We do not expect to a short-term impact on growth from the deal, since there is no significant increase in public spending as part of the plan. The Commission aims at mobilising EUR 100bn (which is merely 0.6% of EU GDP) for EU clean manufacturing in "short-term relief", but is unclear where the money should come from, and it will mostly likely be mainly private capital as the EU faces financing constraints. All in all, any effect of the deal is years out in the future, but it will likely be positive.
Equities: The rotation into Europe continued Wednesday. S&P 500 closed unchanged while Stoxx 600 gained a full 1%. Despite new tariff threats, US markets stopped the bleeding following four-straight declines, with most indices modestly higher. Another sign that investors have recovered was renewed cyclical preference in the sector space. Cyclicals beat defensives by a full 1% globally. This was led by tech consumer discretionary and banks. The Nvidia earnings report helped pushing back AI capex bubble concerns, after crushing earnings expectations and upbeat commentary. US futures are a notch higher this morning.
FI: Another trading session with a mild bid for European duration, amid concerns about the (particularly) US growth outlook. Since late last week with disappointing US macro data, 10y UST has declined more than 30bp to 4.25%. At the same time, 10y Bunds have declined "only" 10bp, thereby narrowing the transatlantic spread to 181bp. Last night it was reported that the potential US tariff hikes have been postponed to early April. On the data front, we get Spanish inflation releases today for February.
FX: JPY, GBP and USD gained yesterday, where Scandies and AUD and NZD lost on a day whene risk sentiment overall was mixed. EUR/USD traded close to 1.05, EUR/SEK climbed above 11.15 and EUR/NOK hovered around 11.70.
GBP/JPY Daily Outlook
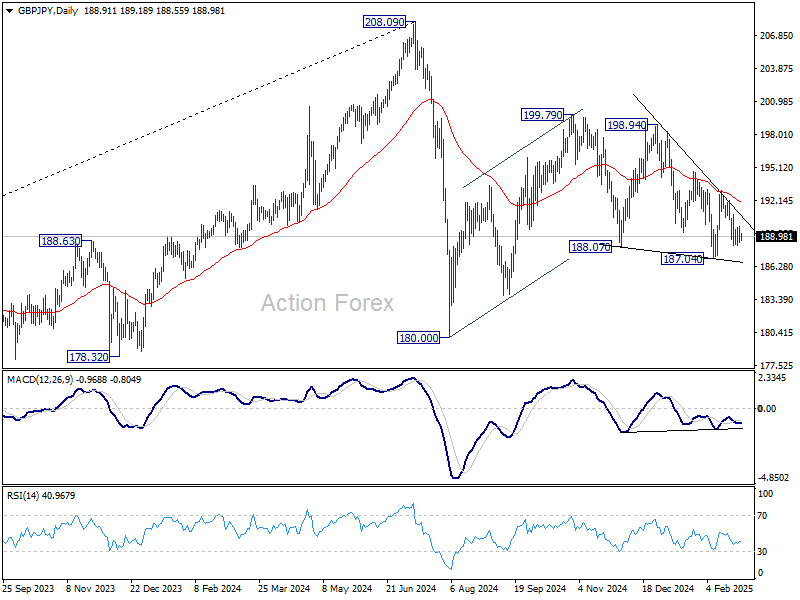
Daily Pivots: (S1) 188.32; (P) 189.09; (R1) 189.77; More...
Intraday bias in GBP/JPY remains neutral and outlook is unchanged. Risk will be mildly on the downside as long as 193.04 resistance holds. On the downside, firm break of 187.04 will extend the fall from 199.79 towards 180.00 support.
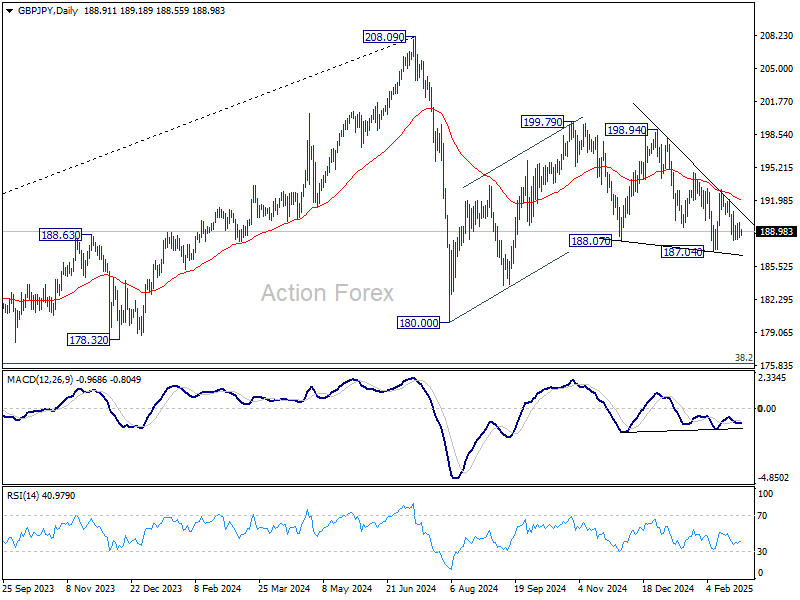
In the bigger picture, price actions from 208.09 are seen as a correction to rally from 123.94 (2020 low). Strong support should be seen from 38.2% retracement of 123.94 to 208.09 at 175.94 to contain downside. However, sustained break of 152.11 will bring deeper fall even still as a correction.