Sample Category Title
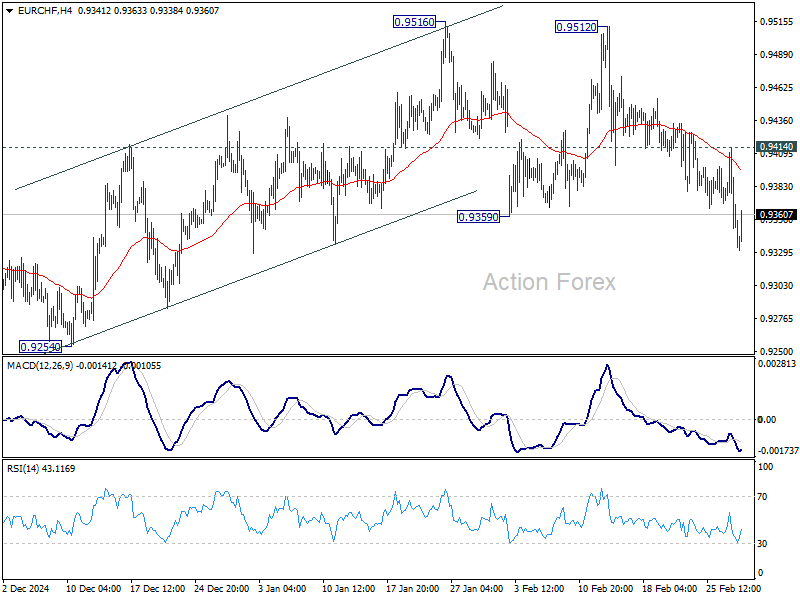
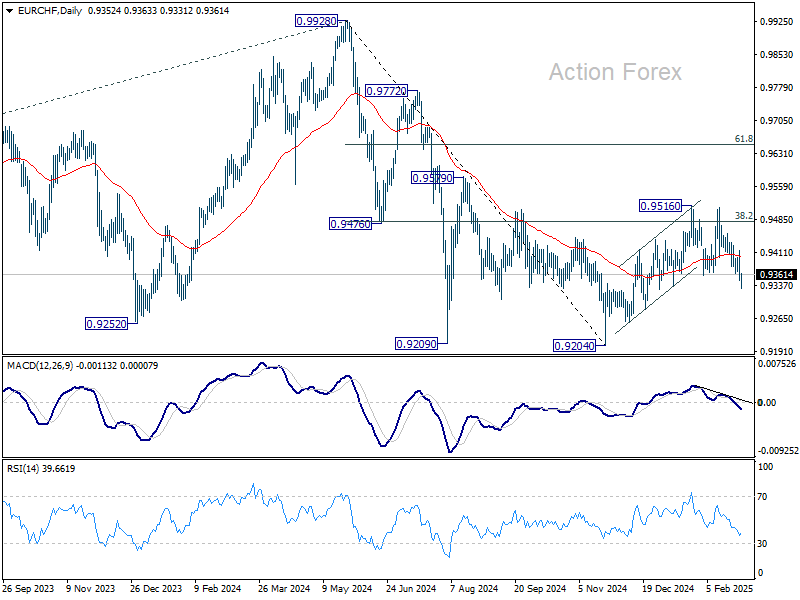
EUR/CHF Daily Outlook
Daily Pivots: (S1) 0.9332; (P) 0.9374; (R1) 0.9397; More....
EUR/CHF's break of 0.9359 support revives the case that corrective rebound from 0.9204 has completed after rejection by 0.9481 fibonacci resistance. Intraday bias is back on the downside for retesting 0.9204 low. On the upside, though, break of 0.9414 resistance will mix up the outlook again and turn intraday bias neutral.
In the bigger picture, sustained trading above 38.2% retracement of 0.9928 to 0.9204 at 0.9481 should confirm that whole fall from 0.9928 has completed at 0.9204. Further rally should then be seen back to 61.8% retracement at 0.9651 and above. However, another rejection by 0.9481 will keep outlook bearish for extending larger down trend through 0.9204 at a later stage.
EUR/AUD Daily Outlook
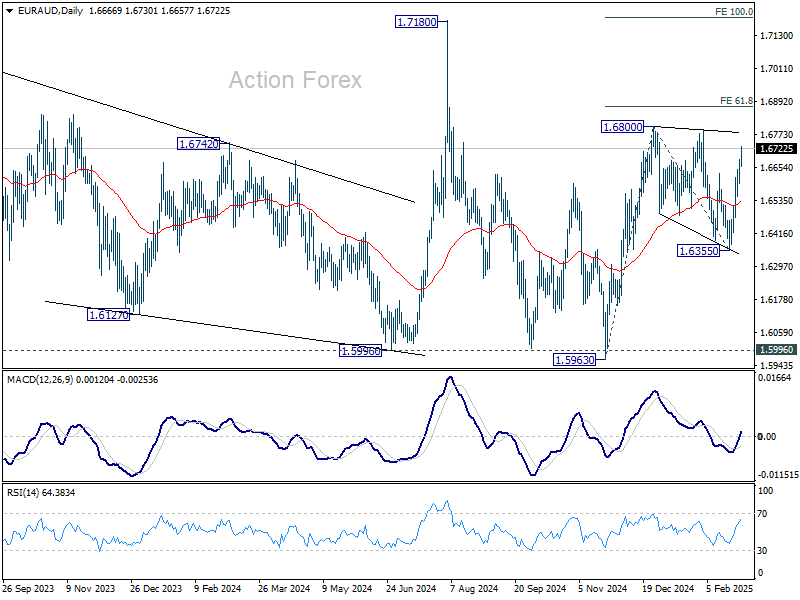
Daily Pivots: (S1) 1.6621; (P) 1.6654; (R1) 1.6709; More...
Intraday bias in EUR/AUD stays on the upside for retesting 1.6800 resistance. Break there will resume the rise from 1.5963 to 61.8% projection of 1.5963 to 136800 from 1.6355 at 1.6872. Sustained trading above there should bring upside acceleration to 100% projection at 1.7192, which is close to 1.7180 high. On the downside, below 1.6597 minor support will delay the bullish case and turn intraday bias neutral first.
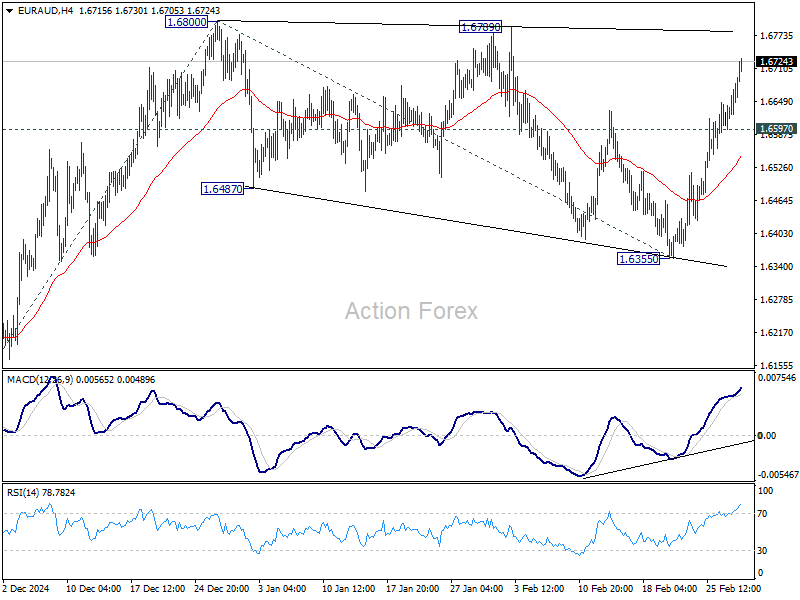
In the bigger picture, with 1.5996 key support (2024 low) intact, larger up trend from 1.4281 (2022 low) is still in favor to resume through 1.7180 at a later stage. Nevertheless, sustained break of 1.5996 will indicate that such up trend has completed and deeper decline would be seen.
EUR/GBP Daily Outlook
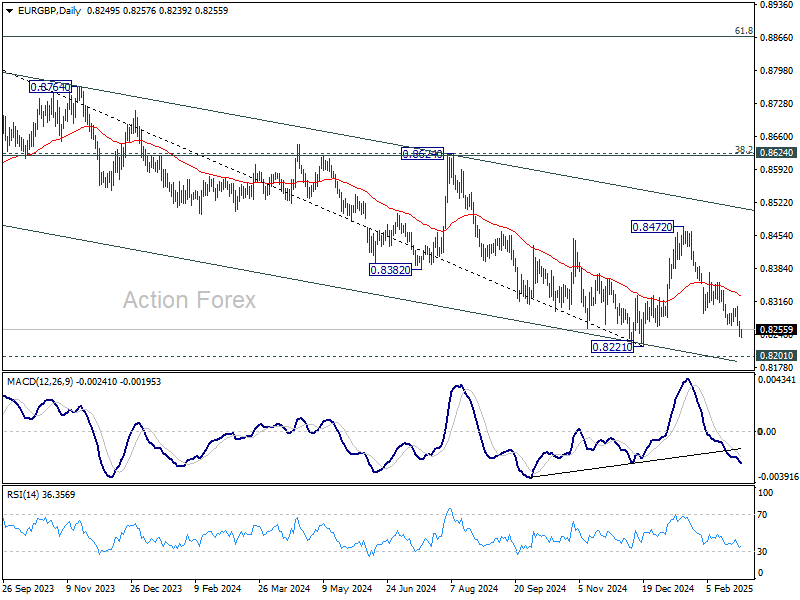
Daily Pivots: (S1) 0.8238; (P) 0.8256; (R1) 0.8271; More...
Intraday bias in EUR/GBP remains on the downside as fall from 0.8472 is in progress for retesting 0.8201/21 key support level. Firm break there will carry larger bearish implications. For now, risk will stay on the downside as long as 0.8304 resistance holds, in case of recovery.
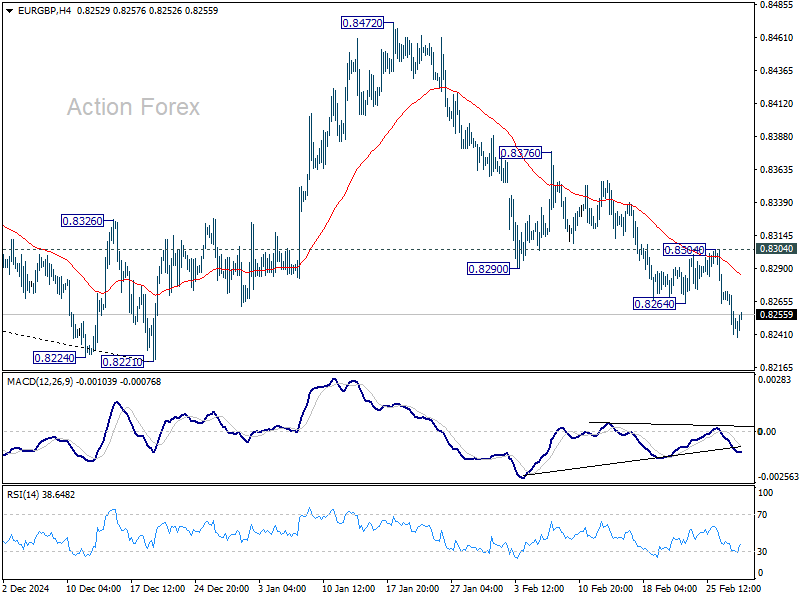
In the bigger picture, the medium term down trend remains intact with EUR/GBP staying well inside the falling channel. Prior rejection by 55 W EMA (now at 0.8431) also affirm bearishness. Decisive break of 0.8201/8221 support zone will resume whole down trend from 0.9449 (2020 high) and carry larger bearish implications.
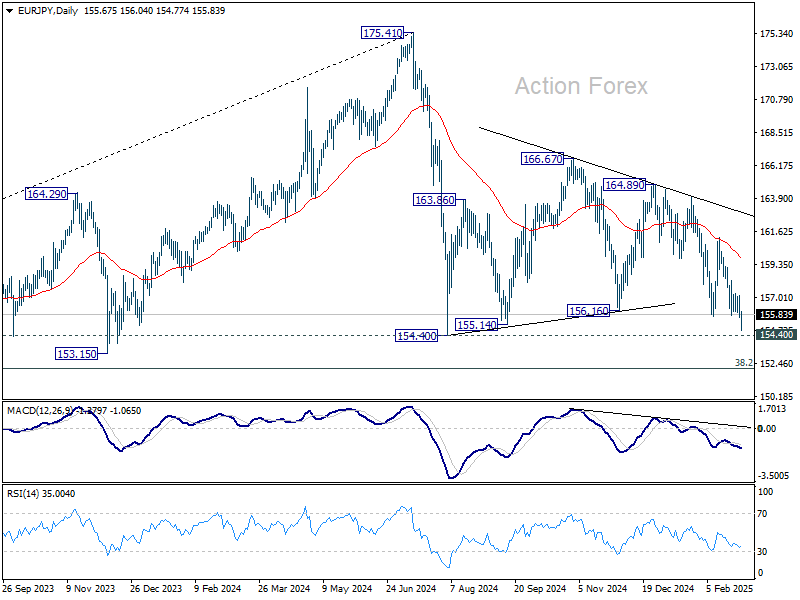
EUR/JPY Daily Outlook
Daily Pivots: (S1) 155.21; (P) 156.22; (R1) 156.77; More...
Intraday bias in EUR/JPY is back on the downside with break of 155.72 support, and deeper fall should be seen to 154.40 key support. Firm break there will confirm resumption of whole decline from 175.41 and target 152.11 fibonacci level next. On the upside, above 157.29 resistance will turn intraday bias neutral again first.
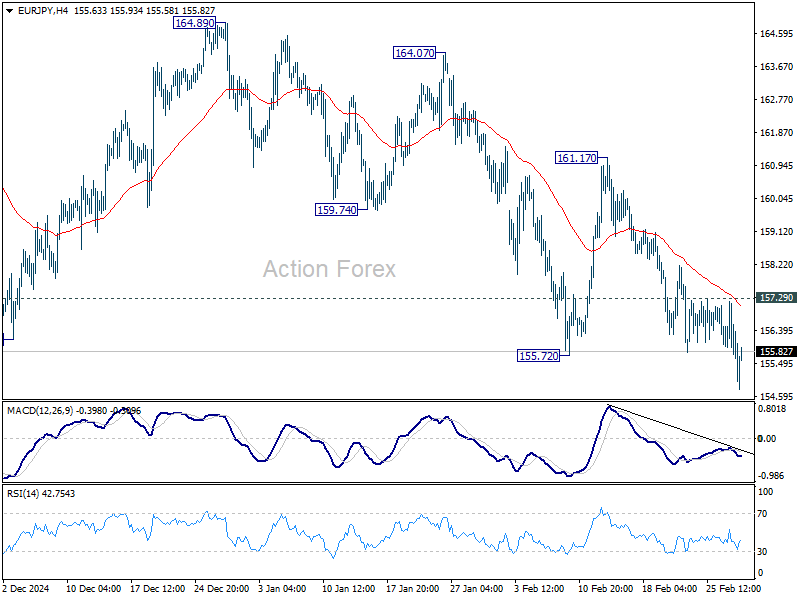
In the bigger picture, price actions from 175.41 are seen as correction to rally from 114.42 (2020 low). Strong support should be seen from 38.2% retracement of 114.42 to 175.41 at 152.11 to contain downside. However, sustained break of 152.11 will bring deeper fall even still as a correction. Next target will be 100% projection of 175.41 to 154.40 from 166.67 at 145.66.
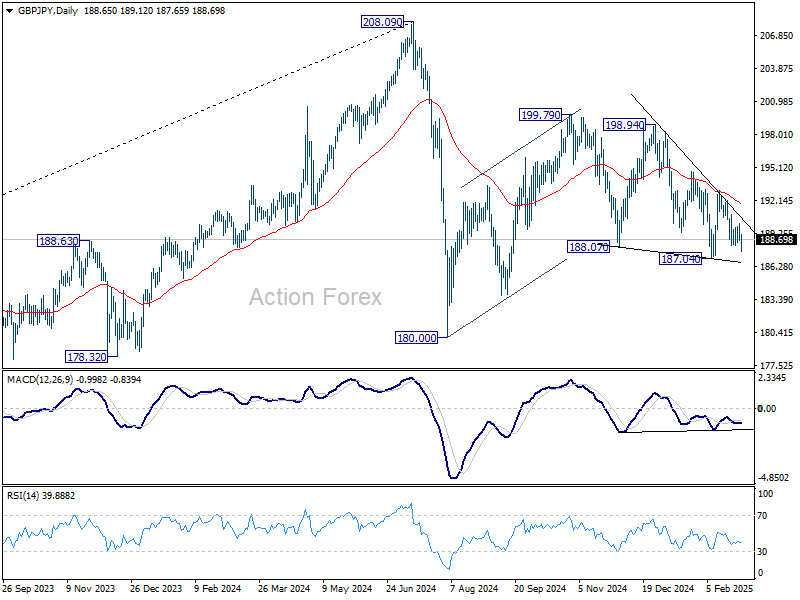
GBP/JPY Daily Outlook
Daily Pivots: (S1) 188.20; (P) 189.15; (R1) 189.73; More...
Intraday bias in GBP/JPY remains neutral for now, and risk stays mildly on the downside with 193.04 resistance intact. On the downside, firm break of 187.04 will extend the fall from 199.79 towards 180.00 support. That will also raise the chance that correction from 208.09 is resuming downward.
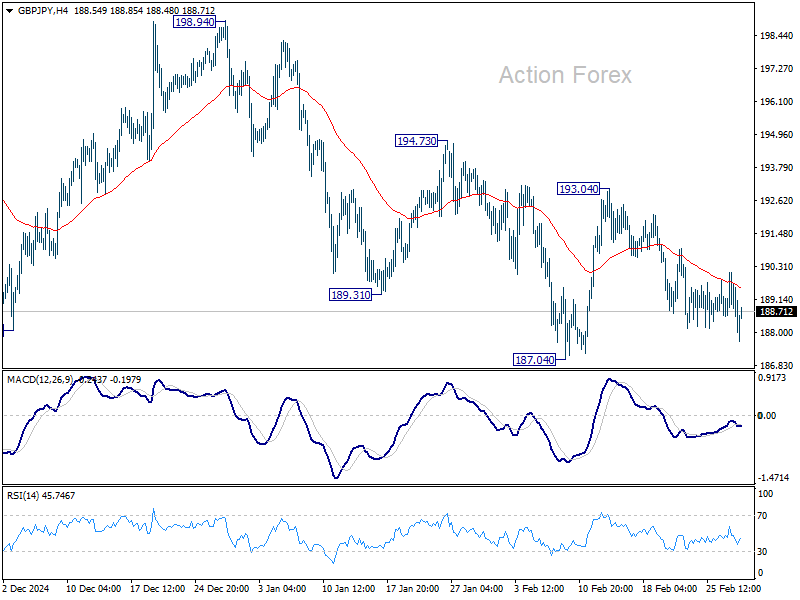
In the bigger picture, price actions from 208.09 are seen as a correction to rally from 123.94 (2020 low). Strong support should be seen from 38.2% retracement of 123.94 to 208.09 at 175.94 to contain downside. However, sustained break of 152.11 will bring deeper fall even still as a correction.
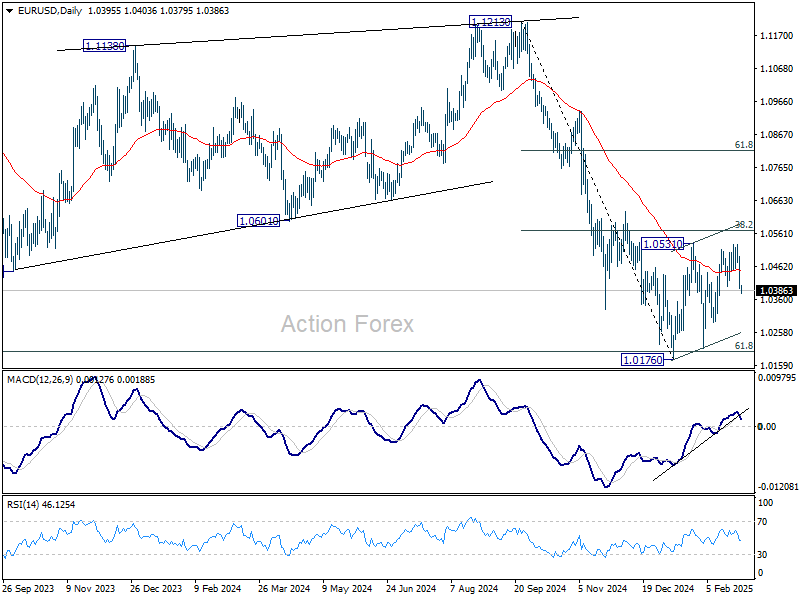
EUR/USD Daily Outlook
Daily Pivots: (S1) 1.0365; (P) 1.0430; (R1) 1.0462; More...
EUR/USD's break of 1.0400 support suggests that consolidation from 1.0176 has already completed at 1.0527, ahead of 38.2% retracement of 1.1213 to 1.0176 at 1.0572. Intraday bias is back on the downside for retesting 1.0176/0210 support zone. Firm break there will resume whole decline from 1.1213. For now, risk will stay on the downside as long as 1.0527 holds, in case of recovery.
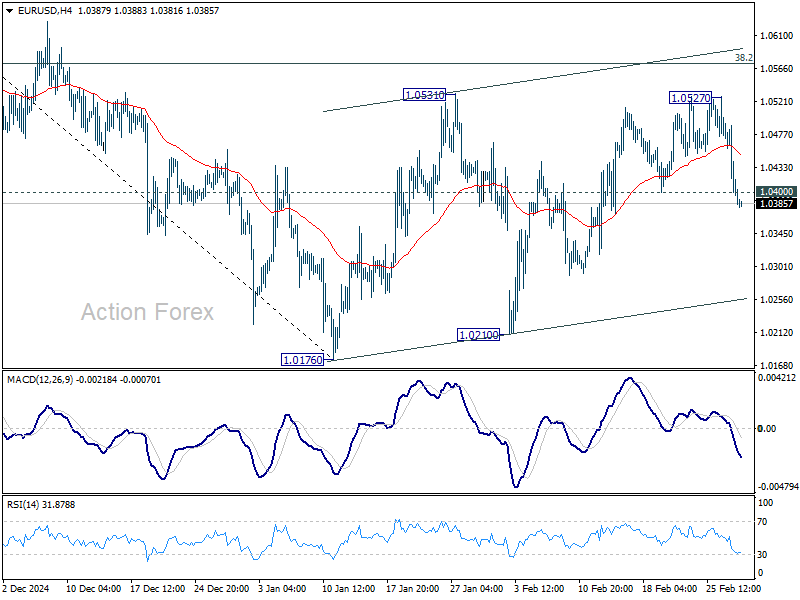
In the bigger picture, immediate focus is on 61.8 retracement of 0.9534 (2022 low) to 1.1274 (2024 high) at 1.0199. Sustained break there will solidify the case of medium term bearish trend reversal, and pave the way back to 0.9534. However, reversal from 1.0199 will argue that price actions from 1.1274 are merely a corrective pattern, and has already completed.
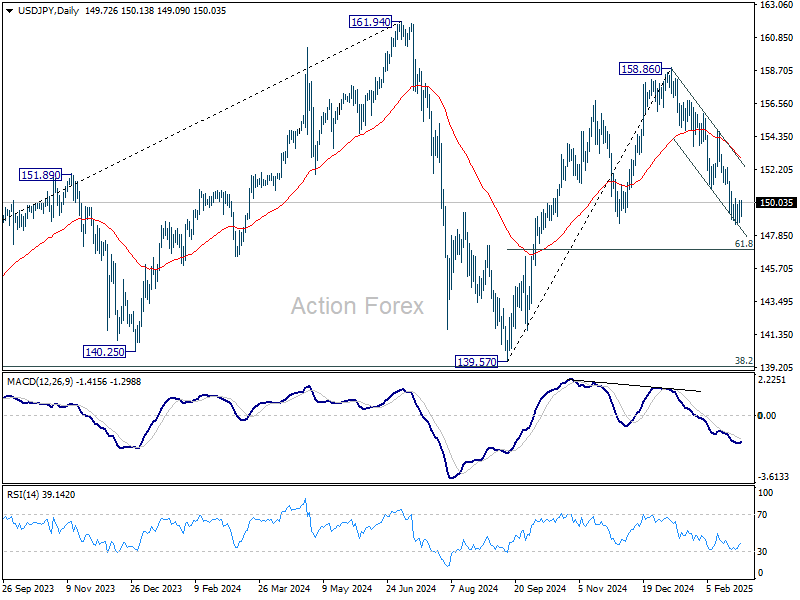
USD/JPY Daily Outlook
Daily Pivots: (S1) 148.98; (P) 149.57; (R1) 150.39; More....
Intraday bias in USD/JPY remains neutral and further decline is expected with 150.92 support turned resistance intact. Current fall from 158.86 is seen as the third leg of the pattern from 161.94 high. Below 148.55 will target 61.8% retracement of 139.57 to 158.86 at 146.32 next. On the upside, however, break of 150.92 will indicate short term bottoming and bring stronger rebound.
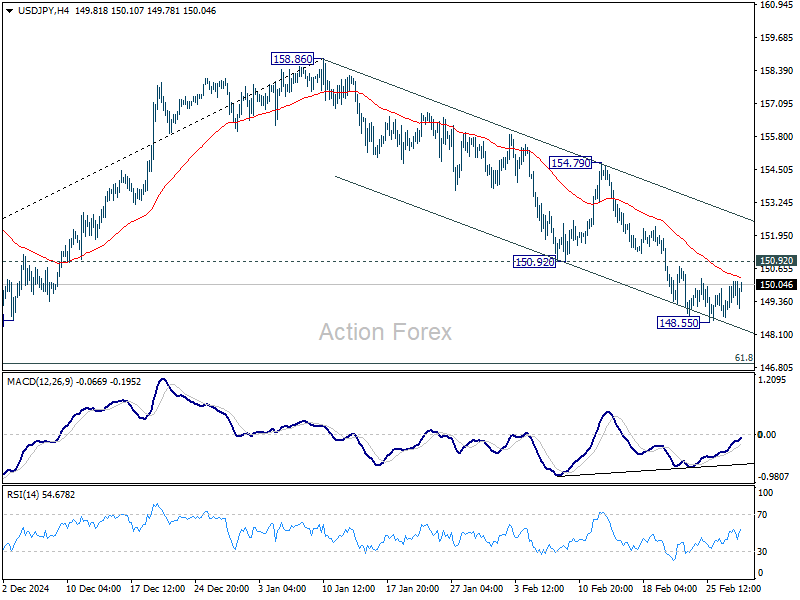
In the bigger picture, price actions from 161.94 are seen as a corrective pattern to rise from 102.58 (2021 low). In case of another fall, strong support should be seen from 38.2% retracement of 102.58 to 161.94 at 139.26 to bring rebound. However, sustained break of 139.26 would open up deeper medium term decline to 61.8% retracement at 125.25.
GBP/USD Daily Outlook
Daily Pivots: (S1) 1.2569; (P) 1.2630; (R1) 1.2663; More...
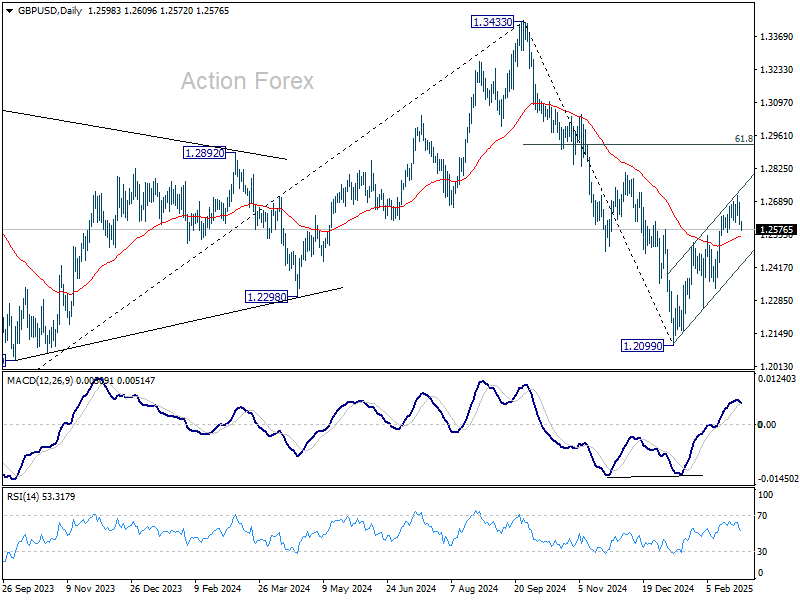
GBP/USD's break of 1.2602 support suggests that a short term top is already formed at 1.2715, on bearish divergence condition in 4H MACD. Intraday bias is back on the downside for near term channel support (now at 1.2424). Firm break there will argue that whole rebound from 1.2099 has completed as a correction. On the upside, though, break of 1.2715 will resume the rebound to 1.2810 resistance next.
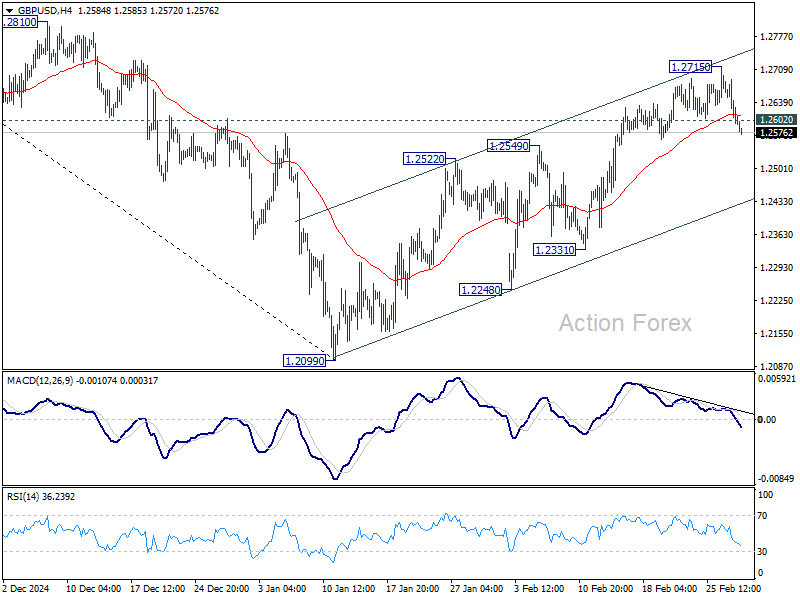
In the bigger picture, rise from 1.0351 (2022 low) should have already completed at 1.3433 (2024 high), and the trend has reversed. Further fall is now expected as long as 1.2810 resistance holds. Deeper decline should be seen to 61.8% retracement of 1.0351 to 1.3433 at 1.1528, even as a corrective move. However, firm break of 1.2810 will dampen this bearish view and bring retest of 1.3433 high instead.
USD/CHF Daily Outlook
Daily Pivots: (S1) 0.8953; (P) 0.8980; (R1) 0.9023; More…
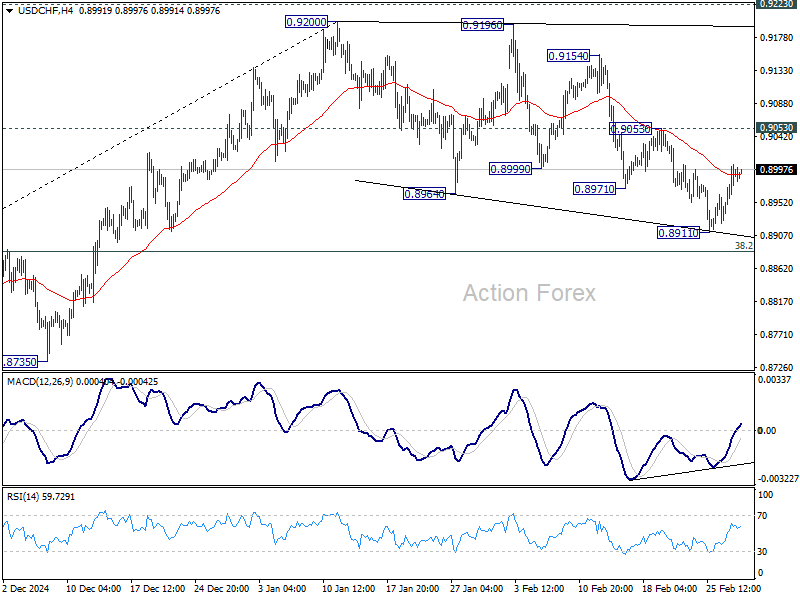
Intraday bias in USD/CHF remains neutral for the moment. On the upside, firm break of 0.9053 resistance will suggest that corrective pattern from 0.9200 has already completed. Further rally should then be seen to retest 0.9200 resistance. In case of another fall, downside should be contained by 38.2% retracement of 0.8374 to 0.9200 at 0.8884 to bring rebound.
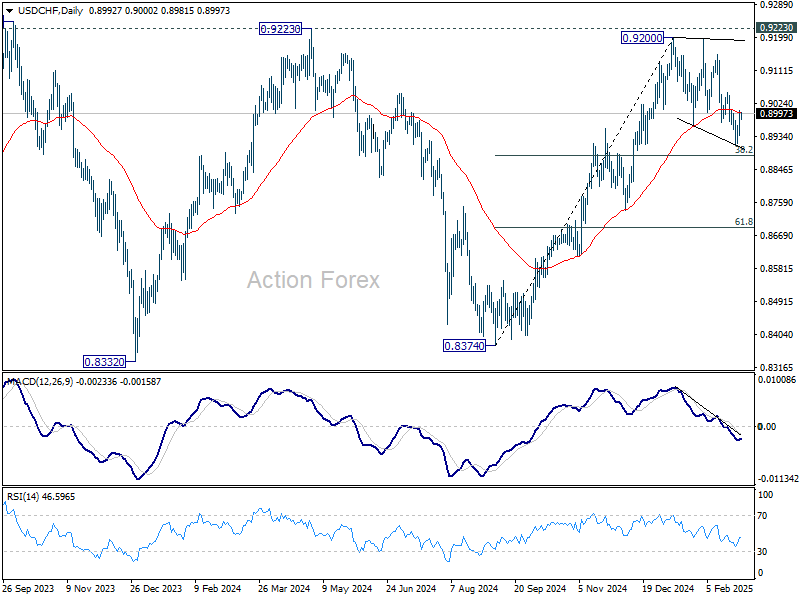
In the bigger picture, decisive break of 0.9223 resistance will argue that whole down trend from 1.0342 (2017 high) has completed with three waves down to 0.8332 (2023 low). Outlook will be turned bullish for 1.0146 resistance next. Nevertheless, rejection by 0.9223 will retain medium term bearishness for another decline through 0.8332 at a later stage.
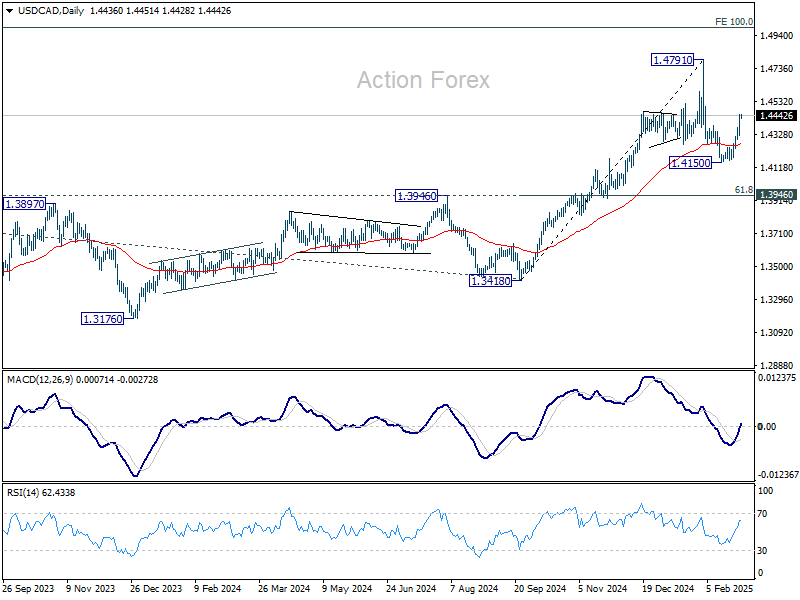
USD/CAD Daily Outlook
Daily Pivots: (S1) 1.4356; (P) 1.4402; (R1) 1.4483; More...
Intraday bias in USD/CAD remains on the upside for the moment. Corrective pullback from 1.4791 should have completed at 1.4150 already. Further rise should be seen to retest 1.4791. Firm break there will resume larger up trend. ON the downside, below 1.4298 minor support will turn intraday bias neutral and bring consolidations before staging another rally.
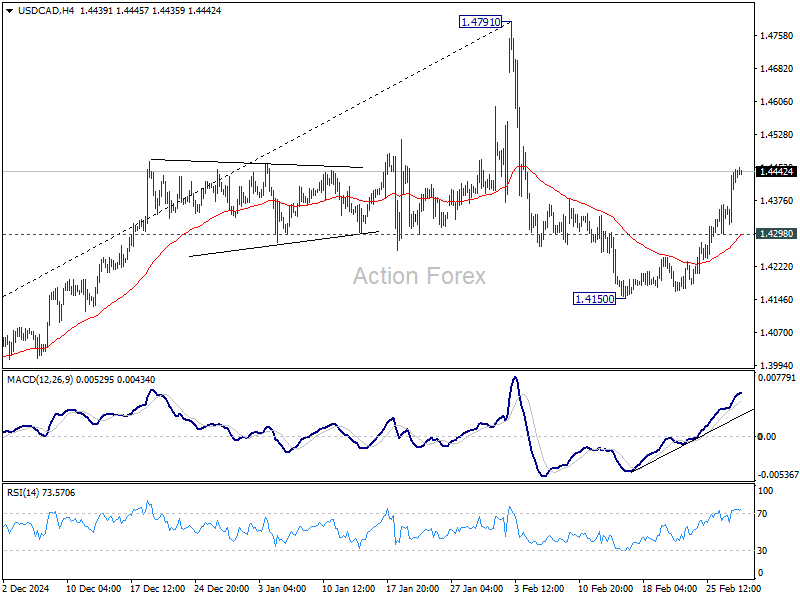
In the bigger picture, long term up trend is tentatively seen as resuming with prior breach of 1.4667/89 key resistance zone (2020/2015 highs). Next target is 100% projection of 1.2401 to 1.3976 from 1.3418 at 1.4993. This will remain the favored case as long as 1.3976 resistance turned support holds (2022 high), even in case of deep pullback.