Sample Category Title
USD/CAD Continued Decline
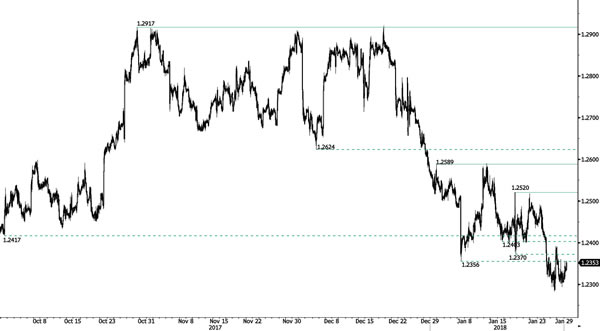
USD/CAD is decreasing. Hourly resistance is given at 1.2520 (17/01/2018 high) while further resistance given at 1.2589 (01/01/2018) is momentarily out of reach. The technical structure indicates that additional weakness is achievable.
In the longer term, the pair is trading between resistance point at 1.4690 (22/01/2016 high) and support at 1.2128 (18/06/2015 low). Strong resistance is given at 1.4690 (22/01/2016 high). The pair is likely to head lower. The pairs is trading below 200 DMA.
USD/CHF Downward Pressure
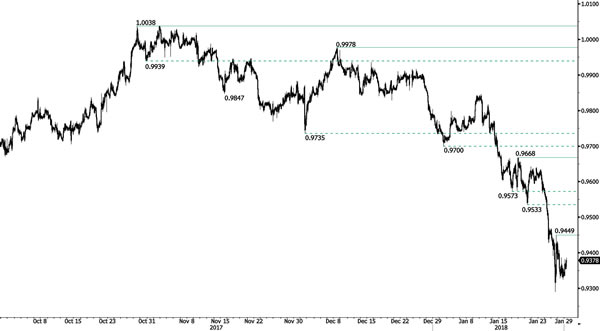
USD/CHF is trading mixed. The technical structure indicates that further weakness is likely. Hourly resistance is at 0.9449 (25/01/2018 high). Expected to show further short-term downside move.
In the long-term, the pair is still trading in range since 2011 despite some turmoil when the SNB unpegged the CHF. Key support can be found at 0.9072 (07/05/2015 low). The technical structure favours nonetheless a long term bullish bias since the unpeg in January 2015.
USD/JPY Bearish Bias
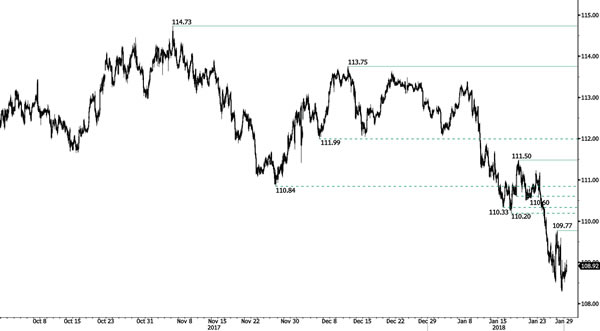
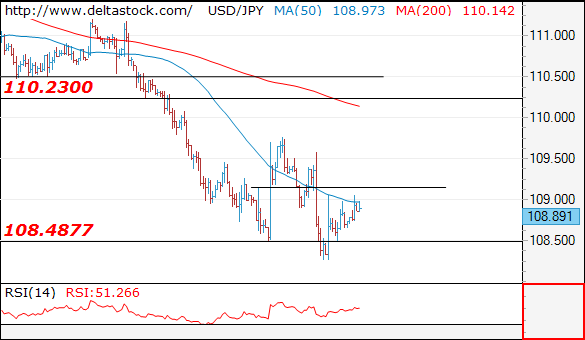
USD/JPY is trading below 109. Hourly resistance is at 109.77 (26/01/2018 high). The technical structure suggests further short-term downside moves.
We favor a long-term bearish bias. Support is now given at 107.32 (08/09/2017 low). A gradual rise towards the major resistance at 125.86 (05/06/2015 high) seems unlikely. Expected to decline further support at 101.20 (09/11/2016 low).
GBP/USD Ready For Another Leg Higher
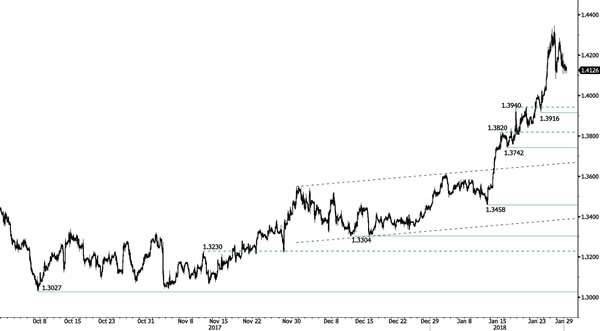
GBP/USD buying pressure in still lively. The technicals structure suggest further potential upside. Hourly support is given at 1.3916 (23/01/2018 low).
The long-term technical pattern is reversing. The Brexit vote had paved the way for further decline but the pair is now moving up to 2016 highs. A long-term support given at 1.1841 (07/10/2017 low) and a strong resistance at 1.5018 (24/06/2016 high) are identified.
EUR/USD Sideways Price Action
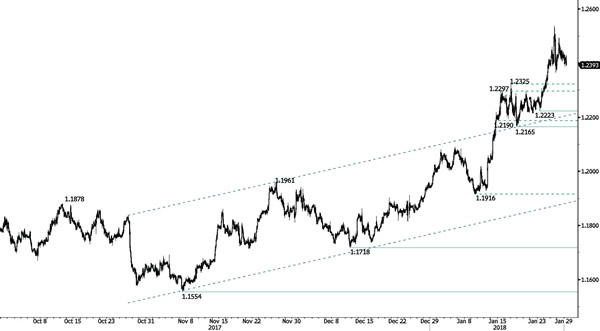
EUR/USD is trading mixed around 1.24. The pair lies in a bullish short-term momentum. Hourly support is given at 1.2223 (23/01/2018 low). The technical structure suggests further short-term upside moves.
In the longer term, the momentum is turning largely positive. We favor a continued bullish bias. Key resistance is holding at 1.2856 (15/10/2014 high) while strong support lies at 1.1554 (08/11/2017 low).
Forex Technical Analysis: EUR/USD, USD/JPY, GBP/USD
EUR/USD
Current level - 1.2396
The intraday bias is negative, for a slide towards 1.2330 major static support and the latter is expected to initiate the next leg upwards, to 1.2800 area.
| Resistance | Support | ||
| intraday | intraweek | intraday | intraweek |
| 1.2450 | 1.2500 | 1.2367 | 1.2330 |
| 1.2540 | 1.2870 | 1.2330 | 1.2220 |

USD/JPY
Current level - 108.89
Despite the recent low at 108.25, my outlook is positive, for a break through 109.10 area, towards 109.75 zone.
| Resistance | Support | ||
| intraday | intraweek | intraday | intraweek |
| 109.15 | 110.20 | 108.25 | 108.50 |
| 110.20 | 112.00 | 108.25 | 107.30 |
GBP/USD
Current level - 1.4093
The intraday bias is bearish, for a tight test of 1.4050 support zone. Initial resistance lies at 1.4205.
| Resistance | Support | ||
| intraday | intraweek | intraday | intraweek |
| 1.4205 | 1.4340 | 1.4050 | 1.3940 |
| 1.4340 | 1.4730 | 1.4050 | 1.3730 |

EUR/AUD 4H Chart: Bearish Movement
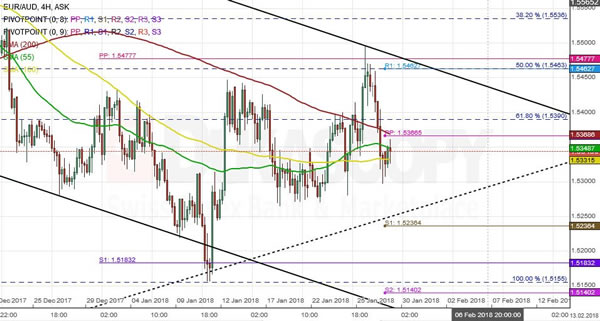
After approaching the upper trend-line of a dominant channel down pattern, EUR/AUD currency exchange rate began to decline.
After reaching the 50.00% Fibonacci retracement level. The common European currency is slowly moving downwards to test the dominant channel down-trend line up pattern. This retracement can be measured with the high of 1.5772 and the low of 1.5183.
Regarding the short term, the pair is set to approach the lower trend-line of the dominant channel and is likely to be stopped by the weekly PP at 1.5140. Afterwards a temporary retracement upwards should occur.
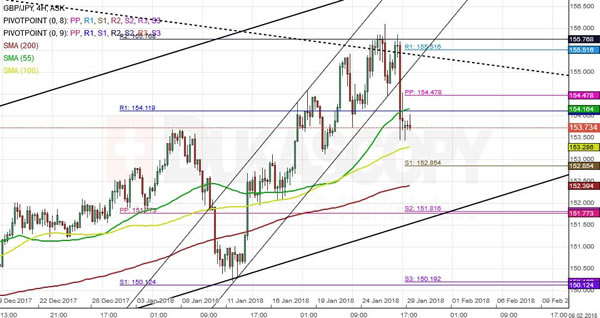
GBP/JPY 4H Chart: Full Review
A full review was made for the GBP/JPY pair, due to previously drawn pattern being broken. The pair was smoothly moving north until it was stopped by the combination of the monthly and weekly PPs near the 155.78 mark.
A new junior channel has been mapped, and by the end of Friday’s trading session, a breakout has occurred to the south.
Meanwhile, in regards to the future movement, the bear is likely to grow stronger until it is stopped by the combination of the weekly PP and the 200—hour SMA at 151.81 mark. If and when it happens, there might be a retracement upwards.
EUR/USD Analysis: Breaches Strong Support Early In Session
Despite trying to accelerate against the US Dollar early on Friday, the common European currency failed to overcome the psychological 1.25 mark. The subsequent reversal was followed by a breach of the 55-hour SMA and the monthly R3 which left the rate between this resistance and the 100-hour moving average.
Technical indicators are generally neutral, thus pointing to a possible period of consolidation. Given that the Euro managed to breach the 55-hour SMA, it is likely that traders see the strengthening of the bearish sentiment within this session and even beyond.
The dashed line on the chart represents a three-week trend-line. A breakout of this line and the 100-hour SMA and the weekly PP circa 1.2380 should confirm the aforementioned scenario.
GBP/USD Analysis: Points To Soon Secline
Similarly to other major currencies, the Pound retrieved from its recent highs against the US Dollar and edged lower on Friday. It breached the 55-hour SMA and was testing the longer-term moving average and the weekly PP circa 1.4130 on Monday morning. This level coincides with the bottom boundary of a three-week ascending triangle which has constrained the pair's recent period of appreciation.
Meanwhile, this trading session started with low volatility, as bears were reluctant to breach the nearest support. This area, however, is expected to surrender, thus allowing the Pound to approach the 200-hour SMA located near the 1.40 mark.
The pair is likely to remain in the 1.4050/1.4100 range by Tuesday morning.