Sample Category Title
CAC Edges Lower as French Industrial Production Contracts
The CAC index has rolled off five straight winning sessions, but is in red territory in the Wednesday session. Currently, the index is at 5506.50, down 0.34%. It's a light day on the release front, with no eurozone indicators. French Industrial Production disappointed, posting a decline of 0.5%, edging below the estimate of -0.4%. On Thursday, the eurozone releases Industrial Production and the ECB will publish the minutes of the December policy meeting.
Global stock markets have jumped out of the gates in 2018, and the CAC has also pushed higher, posting strong gains of 3.8% in January. Investors are giving the eurozone economy a thumbs-up, as the bloc is on track for a solid fourth quarter, as growth continues and unemployment falls. Inflation has also moved higher, although the ECB is unlikely to reconsider its current stimulus program, which ends in September.
The year 2017 was a good one for the eurozone, marked by strong growth. The labor market has also rebounded, as unemployment steadily declined over the course of 2017. In December, the reading dropped to 8.7%. This marked its lowest level since March 2009, when the rate stood at 8.5%. This is yet another indication of the impressive rebound in the eurozone economy, as growth has been steady and the employment picture has improved. Retail Sales, the primary gauge of consumer spending, posted a strong gain of 1.5% in December, after a decline of 1.1% in November. European stock markets have responded with strong gains, and the CAC has gained ground since the New Year. If the eurozone economy continues to impress early in 2018, the CAC should continue to move higher.
The political deadlock in Germany has been a setback for French President Emmanuel Macron, a staunch proponent of European unity. Macron has grandiose plans for the further integration of the eurozone, such as harmonizing corporate tax regimes and establishing a eurozone budget. Merkel would make an ideal partner to reform the bloc, but she has her hands full trying to set up a new government in Germany. The election in Germany was inconclusive, and talks between Merkel's conservative bloc and two smaller parties floundered. Merkel has started talks with the Social Democrats, but German coalition talks tend to move slowly, and could last for several more months. Macron's grand plans for Europe will have to remain on the shelf until Merkel has a government in place.
Canadian Dollar Inches Upwards
USD/CAD continues to move sideways this week. In the Wednesday session, the pair is trading at 1.2447, down 0.14% on the day. On the release front, Canada releases Building Permits, a major construction indicator. The markets are braced for a decline of 0.7%. In the US, today's key event is Import Prices, with an estimate of 0.4%.
The Canadian dollar made up some ground against the greenback in December, and the currency hasn't missed a beat in January, with gains of 1.2% percent. Recent economic indicators have pointed upwards, led by excellent employment numbers. In December, the economy added 78.6 thousand jobs, defying experts who predicted a minuscule gain of 1.8 thousand. This release comes on the heels of a superb November release, when the economy added 79.5 thousand news jobs. The unemployment rate dropped to 5.7% in December, down from 5.9% a month earlier. Last week marked a third winning week for the rejuvenated Canadian dollar, and on Friday the currency hits its highest level against the US dollar since late September.
Another factor which has boosted the Canadian dollar has been the recent rise in oil, which has jumped 6.8% since mid-December. Geopolitical tensions have boosted oil prices, in particular tensions with North Korea and the recent civil unrest in Iran. Still, there is pressure on the Bank of Canada to raise its benchmark rate of 1.0%, which is lagging behind the Federal Reserve rate of between 1.25%-1.50%. With the Fed widely expected raise rates in January, the recent gains by the Canadian dollar could evaporate if the BoC doesn't raise rates at its policy meeting on January 17. However, the BoC has voiced concerns about the Canadian economy, and as things stand, the BoC is not planning to raise rates. This could mean a rough ride for the Canadian currency next week.
Interest rates may be in the headlines, but another important parameter is the Federal Reserve's balance sheet. As of this month, the Fed has started to shrink its massive balance sheet of $4.4 trillion. The balance sheet ballooned during the financial crisis of 2008-2009, and good times have allowed the Fed to begin trimming its portfolio. Incoming Fed Chair Jerome Powell, who takes over in February, has estimated that the balance sheet could drop to anywhere between $2.4 trillion to $2.9 trillion after several years of cuts. Fed policymakers have not indicated a magic number for the balance sheet, but the cuts indicate a vote of confidence in the US economy.
US Futures Tumble on China Treasuries Reports
Equities, Bonds and USD Slide as China Questions Attractiveness of Treasuries
US futures are coming under pressure ahead of the open on Wednesday, following reports from a Chinese official that the country is considering cutting or halting its purchases of US Treasuries.
If the reports turn out to be true and China no longer sees Treasuries as an attractive option, the repercussions could be significant as the country is one of the biggest holders of US debt. A significant change in policy could put considerable upside pressure on US yields, the result of which would be an effective tightening for the US. US 10-year yields spiked on the reports but have since settled and are up around three basis points on the day, having already risen in line with other countries yields on Tuesday.
The tightening effect of such measures would likely have an impact on how many times the Federal Reserve raises interest rates this year, which is why we've seen a corresponding drop in the dollar. The euro has spiked back above 1.20 against the dollar on the back of the reports before settling just below, while cable has moved back into the green on the day having been down around half a percent earlier in the session.
Yields Rise For Second Day as BoJ Move Provides Additional Upward Pressure
The move in Treasuries comes a day after yields generally rose on Tuesday in response to the Bank of Japan buying slightly fewer long-term JGBs, which traders took as a sign that the central bank is preparing to take its foot off the easing gas. While the BoJ has repeatedly rejected speculation that its preparing to reduce its accommodation, there was a lot of talk towards the back end of last year that it was being considered and that's why traders have been so quick to jump on it.
Oil Spikes on API Report as Traders Eye EIA Release
Oil is trading higher for a second day after surging to fresh 3-year highs on Tuesday, as API reported a huge decline in inventories last week, the biggest drop since September 2016. EIA will release its inventory data on Wednesday and its release typically carries more weight than the API number. Should EIA report a similar figure to API, it could trigger another push higher in oil - with markets previously anticipating only a 3.89 million barrel drawdown - while a smaller number may see it pare its gains.
API Weekly Crude Oil Stocks
Oil has already made substantial gains over the course of the last six months - with both Brent and WTI crude up just shy of 50% from their June lows - driven primarily by the agreement to cut production between OPEC and some non-OPEC countries, including Saudi Arabia and Russia. While some doubted whether the countries would follow through on the deal and how effective it would be, the results are clear for all to see with oil now trading back at more sustainable levels, despite US output continuing to rise. I do wonder how much more upside we'll see though before countries involved in the deal either reduce the size of the cuts or end them altogether.
Follow the Yield, and Then Follow the Currency
Wednesday January 10: Five things the markets are talking about
Global equities have taken a well-deserved pause overnight as investors access the recent surge in sovereign bond yields.
Higher global yields was always going to be one of the major trading themes for 2018, and in week-two of the new trading year, investors are having to adapt probably a tad more quicker to rates backing up. Some U.S analysts are already calling U.S yield curve moves a 'bear' market.
This morning's Swedish Riksbank December minutes are being viewed as more 'hawkish' with Governor Ingves hoping to hike rates before the ECB. Even Norway's CPI data is validating Norges view of bringing its first potential hike forward.
Last Friday's 'out of the ball park' Canadian employment numbers have bond dealers repricing the possibility that Governor Poloz can afford to be more proactive on tightening. Current odds are at +83% for a +25bps hike on Jan.17.
Elsewhere, 10-year sovereign yields from the U.S, Germany, China, Japan and Korea are trading at multi-month and -year highs.
What to watch: U.S inflation data this Thursday and Friday – will price pressures remain mute for now?
1. Equities take a breather
One day after posting more record gains stateside, global equities seem to be taking a much-needed time out.
In Japan, the Nikkei share average took a breather overnight after sharp gains; with some index-heavy stocks losing ground after the index hit a 26-year high in the previous session. The Nikkei ended -0.3% lower, while the broader Topix was up +0.2%.
Down-under, the main benchmarks in New Zealand and Australia fell -0.6%, while in S. Korea the Kospi fell -0.4% on a -3.1% drop for index heavyweight Samsung Electronics.
In Hong Kong, Hong Kong stocks extended their winning streak to a 12th day, again aided by strong inflows from mainland China. At the close of trade, the Hang Seng index was up +0.2%, while the Hang Seng China Enterprises index rose +0.27%.
In China, stocks gain for the ninth day as banks and consumer firms rally. At the close, the Shanghai Composite index was up +0.24%, while the blue-chip CSI300 index was up +0.45%.
Note: China's producer prices rose at their slowest pace in a year in December, while the country's consumer inflation accelerated less than expected to +1.8%last month from +1.7% in November.
In Europe, regional markets opened slightly lower, but have bounced from their lows with some mixed results. Oil prices continue to support energy stocks. Elsewhere, market attention is turning to upcoming inflation data from the U.S and corporate earnings stateside.
Futures on the S&P 500 Index have decreased -0.2%, the first retreat in more than a week.
Indices: Stoxx600 -0.1% at 399.6, FTSE +0.3% at 7752, DAX -0.5% at 13320, CAC-40 -0.1% at 5520, IBEX-35 +0.4% at 10468, FTSE MIB +0.4% at 23095, SMI -0.3% at 9587, S&P 500 Futures -0.2%
2. U.S oil hits highest in three years, gold prices mixed
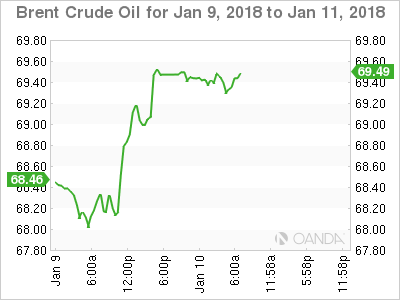
Ahead of the U.S open oil prices have hit their highest since 2014 as OPEC-led production cuts and healthy demand helped to balance the market. But, there continues to be fears that the market is overheating.
Brent crude futures are at +$69.10 a barrel, +28c above Tuesday's close. Brent touched +$69.29 in late Tuesday trading, the highest since May 2015. U.S West Texas Intermediate (WTI) crude futures are at +$63.42 a barrel, up +46c. Earlier prices rose to +$63.57, the highest since Dec., 2014.
Note: OPEC together with Russia and a group of other producers, last November extended an output-cutting deal to cover all of 2018. The cuts were aimed at reducing a global supply overhang.
Data yesterday from API further supported prices – it showed that U.S crude inventories fell by -11.2m barrels in the week to Jan. 5, to +416.6m barrels. This came as the U.S EIA raised its 2018 world oil demand growth forecast by +100k bpd from its previous estimate.
Note: Traders are expected to take direction from this morning's official EIA weekly stocks data, which is due at 10:30 EDT.
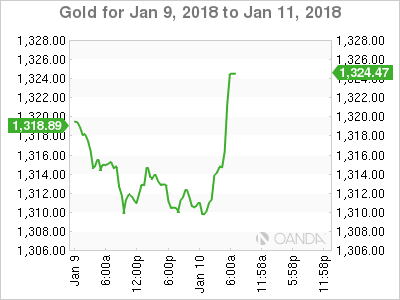
Gold prices have done a u-turn on the news that China officials suggesting that U.S treasuries are less attractive and are recommending halting buying. Spot prices have rallied hard in the last hour to +$1,324.26 an ounce.
Note: Prices fell -0.6% on Tuesday, its biggest one-day loss in a month.
3. Fixed income to watch this week's U.S price data
U.S government bonds have edged higher as the market prepares to see how an important theme for 2018 may start to play out – inflation.
Tuesday, U.S 10-year yields backed up +7 bps to +2.55%, a level last 10-months ago, and the Treasury curve steepened the most in three-weeks, as a plethora of sovereign bond supply from the U.S, the U.K, Japan and Germany come to the market this week coincided with a surprise cut in purchases of long-dated Japanese government bonds by the BoJ.
Fixed income dealers are looking ahead to tomorrow's U.S PPI report and CPI Friday.
Note: With the U.S unemployment rate holding at +4.1% for the last three months of 2017 and Treasury Inflation-Protected Securities (TIPS) signaling faster inflation coming, the Fed has yet to find a way to bring inflation to the +2% level. With U.S policy makers having penciled-in three-rate increases for 2018, this week's data could confirm that the Fed can stay on track.
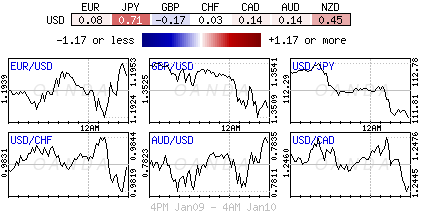
4. Dollar hurt by China official's view that treasuries are less attractive
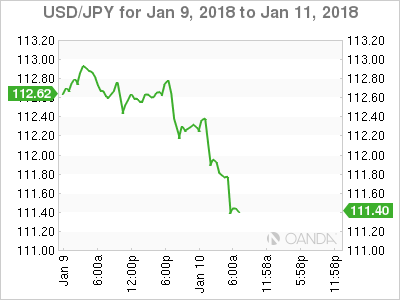
Ahead of the U.S open, some Chinese officials recommended slowing or halting U.S Treasury buying. This has had an immediate negative impact on the U.S dollar across the board (+0.52% €1.2000, +0.11 £1.3547, -0.75% ¥111.44)
In Asia, the yen climbed for a second day as traders unwound short positions in the wake of the BoJ's paring back purchases of ultra-long dated bonds.
Mixed UK data forced the sterling initially lower in the Euro session. GBP/USD tested below £1.35 as wider trade deficit in Nov offset better Industrial Production data (see below).
With Scandinavian central banks becoming a tad more 'hawkish' the Scandi currency pairs have gotten more attention this morning. EUR/NOK fell to 2-month lows after higher-than-expected Norwegian CPI data for Dec. Pair tested €9.60 before stabilizing, while the EUR/SEK cross was lower by -0.3% as the Dec. Riksbank minutes were deemed a bit more 'hawkish' than expected.
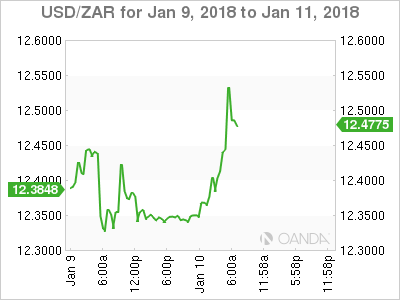
Elsewhere, USD/ZAR ($12.4805) was higher by over +1% on reports that South Africa President Zuma relents on inquiry into South African state capture.
5. U.K manufacturing rose in November
Data this morning showed that U.K manufacturing grew again in November, posting its seventh monthly expansion in a row for the first time on record. This would suggest that U.K producers are continuing to benefit from the pound's (£1.3494) weakness and strong global demand.
Note: U.K Manufacturing accounts for about a fifth of the country's largely services-driven economy.
Factory output grew by +0.4% compared with October, slightly above market expectations of +0.3% expansion. The monthly figure for October was revised up to +0.3% from +0.1%.
Separately, the ONS said the U.K. goods trade deficit with the rest of the world widened slightly in November to -£12.2B from the revised October figure of -£11.7B.
EURUSD Turning Bullish Above 1.1989 Level
The EURUSD pair has made a strong move to the upside during the European trading session, reaching 1.2010, following a quick reversal in the U.S dollar index towards the 92.00 support level. Weakness the U.S dollar index was caused by sharp upside moves in the U.S bond market, as speculation mounts that the Bank of Japan may soon normalize Japanese fiscal policy. Moving into the U.S trading session, EURUSD buyers may try to keep price-action above the 1.1989 level, to maintain bullish trading momentum.
The EURUSD pair is likely to remain bullish while trading above the 1.1989 level, buyers will look to the 1.2030 and 1.2050 resistance levels while price-action holds above the 1.1989 zone.
Should price-action move below the 1.1989 level, downside support for EURUSD is currently found at 1.1958 and 1.1920 levels.
GBPUSD Now Bullish Above 1.3550 Level
The British pound has quickly reversed fortunes against the U.S dollar, rising back above the 1.3550 level, following a sharp move lower in the value of the U.S dollar index. The GBPUSD pair had slipped to a weekly-low of 1.3482 during the European trading session, despite better than expected Manufacturing and Industrial production figures from the United Kingdom. U.S dollar weakness is now the main theme for financial markets moving into the U.S session, with sterling likely to press higher while the greenback remains pressured.
The GBPUSD pair has now turned intraday bullish, and will likely continue to gain towards the 1.3567 and 1.3612 levels while price trades above the pivotal 1.3550 zone.
Should price-action on the GBPUSD pair slip back below the 1.3550 level, intraday support is now found at 1.3537 and 1.3500.
UK 100 Index Posts Record High Though RSI Overbought
The UK 100 index hit a fresh all-time high of 7,756.10 during today's trading, with the index posting a notable rally since the beginning of December.
The Tenkan- and Kijun-sen lines are positively aligned, pointing to a bullish picture in the short-term. The RSI is supporting this view: the indicator remains on the rise, though it has crossed above the 70 overbought level, rendering a short-term pullback a possibility.
Further advancing could see the index finding a barrier around the 161.8% Fibonacci extension at 7,781.43 of the downleg from 7,588.60 to 7,276.30. The 7,800.00 handle – a potential psychological level – would be eyed next for additional resistance.
On the way down, support might come around the current level of the Tenkan-sen at 7,682.85 and further below at the top from early November of 7,588.60.
The medium-term picture is beginning to look increasingly bullish after a period of significant sideways movement. Price action is taking place above the Ichimoku cloud, as well as above the 50- and 100-day moving average lines, with both lines starting to turn higher. A bullish (golden) cross was also recorded in late October when the 50-day MA moved above the 100-day one; given that to a large extent the MAs have moved sideways since the cross, it might be early to perceive this as a strong positive signal though.
Overall, the short-term bias is bullish with some caveats given that RSI is at overbought levels, and the medium-term looks to have entered a bullish phase.
DAX Slips, Investors Eye ECB Minutes
The DAX has posted considerable losses in the Wednesday session. Currently, the index is at 13,291.50, down 0.71% on the day. On the release front, there are no German or eurozone indicators. On Thursday, the eurozone releases Industrial Production and the ECB will publish the minutes of the December policy meeting.
Stronger growth in the Eurozone has also led to a steady decline in unemployment over the course of 2017. In December, the reading dropped to 8.7%. This marked its lowest level since March 2009, when the rate stood at 8.5%. This is yet another indication of the impressive rebound in the eurozone economy, as growth has been steady and the employment picture has improved. Retail Sales, the primary gauge of consumer spending, posted a strong gain of 1.5% in December, after a decline of 1.1% in November. The DAX has received a boost from the strong numbers, and has gained 2.2% since the New Year. If the eurozone economy continues to improve, the DAX rally should continue.
World stock markets have been pointing upwards early in the New Year, and the DAX has also looked sharp in January. Led by a robust German economy, the eurozone is on track for a strong fourth quarter. Inflation has also moved higher, although the ECB is unlikely to reconsider its current stimulus program, which ends in September. One area of concern is the political vacuum in Germany. President Angela Merkel is running a caretaker government, as she has been unable to form a coalition, following the September elections. Merkel is now looking at the Social Democrats to help her make a new government, and preliminary talks are scheduled to begin on Sunday. The negotiations are moving slowly, and are likely to continue for several more months.
Euro Reverses Slide, Climbs To 1.20
After three losing sessions, EUR/USD has reversed course in the Wednesday session. Currently, EUR/USD is trading at 1.1993, up 0.47% on the day. On the release front, there are no German or eurozone indicators. French Industrial Production disappointed, posting a decline of 0.5%, edging below the estimate of -0.4%. In the US, today's key event is Import Prices. On Thursday, the eurozone releases Industrial Production and the ECB will publish the minutes of the December policy meeting.
The unemployment rate in the eurozone declined steadily in 2017, and the December reading dropped to 8.7%. This marked its lowest level since March 2009, when the rate stood at 8.5%. This is yet another indication of the impressive rebound in the eurozone economy, as growth has been steady and the employment picture has improved. Retail Sales, the primary gauge of consumer spending, posted a strong gain of 1.5% in December, after a decline of 1.1% in November. The euro has received a boost from the strong numbers, gaining 2.7% since November 1. Fourth-quarter numbers have been solid, and the positive trend is expected to continue in early 2018.
When the Federal Reserve is in the headlines, it's usually on the topic of interest rates. However, another important parameter is the Fed balance sheet, which has ballooned to $4.2 trillion. Starting this month, the Fed will reduce its portfolio, which grew tremendously during the financial crisis of 2008-2009. However, a strong US economy has allowed the Fed to begin trimming the balance sheet. Incoming Fed Chair Jerome Powell, who takes over in February, has estimated that the balance sheet could drop to anywhere between $2.4 trillion to $2.9 trillion after several years of cuts. Fed policymakers have not indicated a magic number for the balance sheet, but the cuts indicate a vote of confidence in the US economy.
Silver Remains Under Pressure, Maintains Short-Term Bearish Bias
Silver has come under pressure over the last couple of days, in the short to medium-term timeframe, following the sharp bullish rally in the previous days where the price touched a two-week high of 17.25.
The price plummeted more than 1.5% in the last two bearish daily sessions and during European trading today, it hit the 50.0% Fibonacci retracement level of the last down-leg with the high at 18.19 and the low at 15.60. The aforementioned Fibonacci mark stands near the 16.87 price level.
If price action remains above 16.87 (immediate support), there is scope to test 61.8% Fibonacci level at 17.18 or moreover the 17.25 resistance barrier. This is considered to be a strong resistance area which has been rejected a few times in the past. Rising above it would see prices re-test the 18.19 peak and penetrate the descending triangle to the upside, which has been holding in the weekly timeframe since June 2016. The downtrend line starts from the 21.10 resistance level and is forming a significant support barrier near 15.60.
If 16.87 support fails, then the focus would shift to the downside towards the 38.2% Fibonacci mark at 16.57, which overlaps with the 40-day simple moving average. This is an important level, which if breached, would increase downside pressure and the price would be on path towards the 23.6% Fibonacci retracement level at 16.18.
Overall, the momentum remains to the downside. Technical indicators are also endorsing the bearish scenario. The MACD oscillator lost its strong momentum, while the RSI indicator is heading lower after the bounce off on the 70 level.