Sample Category Title
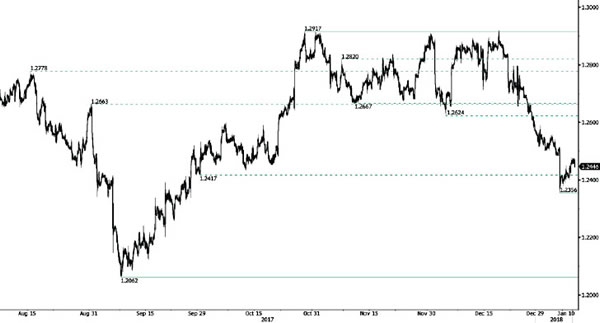
USD/CAD Short-Squeeze
USD/CAD is skewed to the downside after the pair failed to break hourly resistance at 1.2917 (27/10/2017 high) even thought the pair is bouncing back. Expected to see further shortterm weakness.
In the longer term, the pair has broken longterm support that can be found at 1.2461 (16/03/2015 low). Strong resistance is given at 1.4690 (22/01/2016 high). The pair is likely to head further lower.
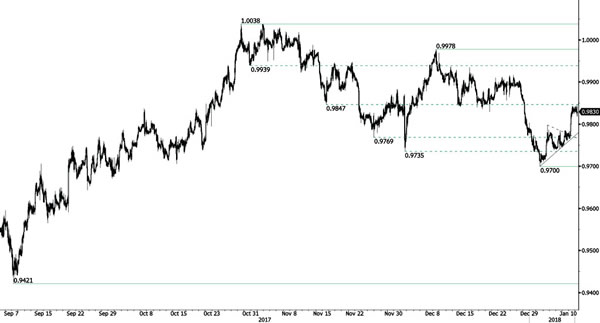
USD/CHF Increasing
USD/CHF is trading higher. Hourly support is given at 0.9700 (02/01/2017). Expected to show further short-term upside move.
In the long-term, the pair is still trading in range since 2011 despite some turmoil when the SNB unpegged the CHF. Key support can be found 0.8986 (30/01/2015 low). The technical structure favours nonetheless a long term bullish bias since the unpeg in January 2015.
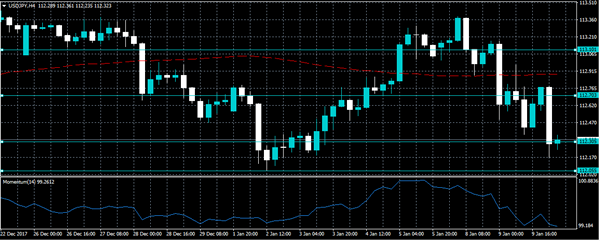
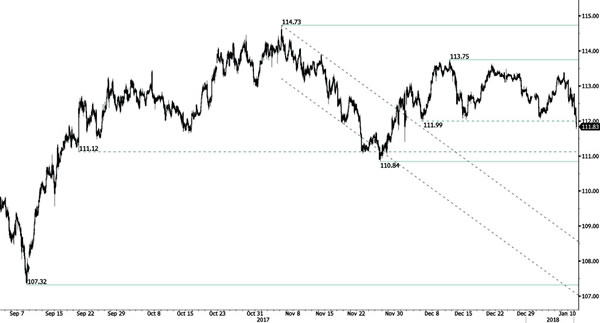
USD/JPY Bearish Breakout
USD/JPY's selling demand is pushing lower and the pair has broken hourly support given at 111.99 (15/12/2017 low). Hourly resistance can be found at 113.75 (12/12/2017 high). The technical structure suggests further short-term downside moves.
We favor a long-term bearish bias. Support is now given at 99.02 (10/08/2013 low). A gradual rise towards the major resistance at 125.86 (05/06/2015 high) seems unlikely. Expected to decline further support at 93.79 (13/06/2013 low).
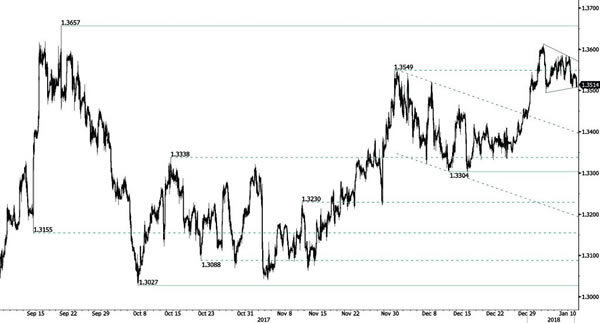
GBP/USD Symetrical Triangle
GBP/USD's selling pressures are increasing. The pair has exited downtrend short-term channel. The technical structure indicates further short-term potential downside. Hourly support is given at a distance at 1.3495 (03/01/2017 low) while hourly resistance can be found at 1.3613 (03/01/2017 high).
The long-term technical pattern is reversing. The Brexit vote had paved the way for further decline. Long-term support can be found at 1.1841 (07/10/2017 low). Long-term resistance given around 1.35 is at stake and indicates a long-term reversal in the negative trend. Yet, it is very unlikely at the moment.
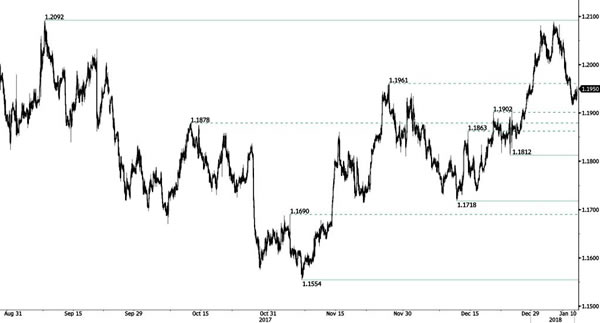
EUR/USD Continued Weakness
EUR/USD keeps on weakening. The pair is now retracing after reaching resistance given at 1.2092 (08/09/2017 high). The road is wide-open for further decline towards support at 1.1812 (25/12/2017 low). Stronger support is given a distance at 1.1718 (12/12/2017 low).
In the longer term, the momentum is now turning largely positive. We favour a continued bullish bias. Key resistance is holding at 1.2252 (25/12/2014 high) while strong support lies at 1.0341 (03/01/2017 low).
Forex Technical Analysis: EUR/USD, USD/JPY, GBP/USD
EUR/USD
Current level - 1.1952
The test of 1.1910 support zone led to a minor reversal and currently a corrective rebound is underway, but it should be limited below 1.2000 area before drowning towards 1.1810.
| Resistance | Support | ||
| intraday | intraweek | intraday | intraweek |
| 1.1960 | 1.2090 | 1.1910 | 1.1910 |
| 1.2000 | 1.2240 | 1.1810 | 1.1715 |

USD/JPY
Current level - 111.86
The downtrend is intact, heading towards 111.00 support area. Initial resistance lies at 112.00, followed by 112.40.
| Resistance | Support | ||
| intraday | intraweek | intraday | intraweek |
| 112.00 | 113.75 | 111.60 | 112.00 |
| 112.40 | 114.70 | 111.00 | 111.00 |

GBP/USD
Current level - 1.3513
The outlook here remains bearish, for a slide towards 1.3460. Minor intraday hurdle lies at 1.354 and crucial on the upside is 1.3580.
| Resistance | Support | ||
| intraday | intraweek | intraday | intraweek |
| 1.3540 | 1.3660 | 1.3500 | 1.3460 |
| 1.3580 | 1.3660 | 1.3460 | 1.3300 |

AUDUSD Bullish Since December, Consolidates Recent Gains
AUDUSD is neutral in the short term after a strong rally pushed the market to overbought conditions and consequently upside momentum faded. AUDUSD remains under corrective pressure after failing to breach the key 0.7900 level but came close to it last week.
The second bullish phase that started after the break above the 200-day moving average in December is still in progress and there are no signs of a reversal in the trend yet. The recent pullback from the January 5 high of 0.7874 saw AUDUSD move into a consolidation phase and there is scope for another push higher towards the major 0.7900 level.
Only a daily close below 0.7800 would indicate that a short-term top is in place at 0.7874. Strong support is expected at the 200-day MA which is converging with the key 0.7700 level. A move lower from here would turn the focus to the December 8 low at 0.7500.
Short-term price action looks soft for now. AUDUSD needs to regain upside momentum soon to rise above 0.7900, otherwise, downside risk will increase quickly.
Yen Bulls Remain In Charge, UK Manufacturing Output Due
Here are the latest developments in global markets:
FOREX: The US dollar index was marginally lower on Wednesday, after previously trading higher for three days in a row.
STOCKS: Asian markets were mixed, with Japan’s Nikkei 225 declining by more than 0.2%, pulling back from the 26-year high it reached earlier in the week, though still remaining close to those multi-decade high levels. Meanwhile, the Topix added 0.15% while in Hong Kong, the Hang Seng was higher by 0.4%. In Europe, Euro Stoxx 50 futures suggest the index is likely to open slightly in the red. Over in the US, all three of the major indices – S&P 500, Dow Jones, and Nasdaq Composite – finished in the green yesterday, hitting fresh all-time highs. However, futures tracking the S&P, Dow, and Nasdaq 100 are currently in negative territory.
COMMODITIES: Energy prices extended their recent gains overnight, with WTI and Brent crude climbing 0.8% and 0.5% respectively, the former reaching highs last seen in 2014. The moves came after the weekly private API inventory data signaled that US crude stockpiles are declining faster than previously anticipated. The report showed an 11.2 million barrels drawdown in inventories, much larger than the consensus of a 3.9 million reduction. The API data are generally considered as a gauge of the official EIA data – due out today. Gold traded lower on Wednesday, but only marginally.
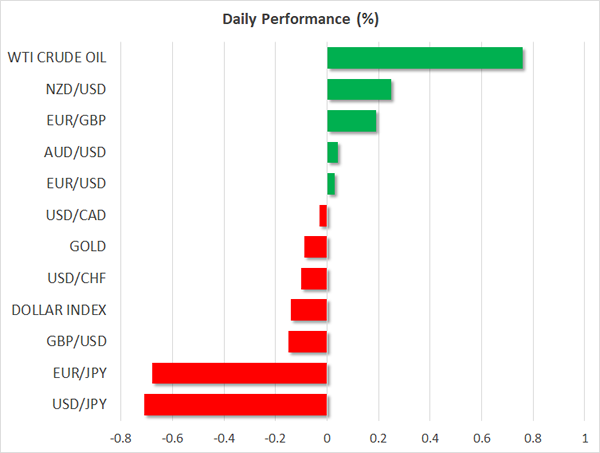
Major movers: Yen rebounds further as shorts unwind; euro unfazed by political news
The Japanese yen continued to recover during the Asian trading session Wednesday. Dollar/yen fell more than 0.7%, last trading near the 111.90 territory, with the next major support zone being near 111.70. Even though there was no clear fundamental catalyst behind the move, the JPY’s gains are being attributed to speculation that the Bank of Japan (BoJ) could begin to unwind its massive stimulus program, following news yesterday that the Bank bought fewer bonds under its regular operations.
However, as outlined here yesterday, the fact that the BoJ bought fewer bonds is not necessarily a signal that the Bank is moving towards tapering. It simply shows that the Bank did not need to buy as many bonds as usual in order to achieve its goal of keeping yields on longer-dated Japanese bonds fixed near 0%. Overall, the BoJ appears set to continue with its ultra-loose policy framework for a while yet, given that inflation remains so far away from its target. Still, all the talk about a potential tapering may have led investors to unwind some of their short-JPY speculative positions, leading to gains in the JPY. According to the latest CFTC commitment of traders report, JPY shorts are currently very high by historic standards.
In Europe, euro/dollar remained largely unfazed by headlines yesterday that Italy’s 5-Star Movement abandoned its pledge to leave the euro if Brussels did not accept to renegotiate some of the EU’s fiscal rules. Ahead of the looming Italian general election in March, this development alleviates some political uncertainty and could imply brighter skies ahead for the common currency.
In the commodity-linked currencies sphere, kiwi/dollar traded 0.2% higher while aussie/dollar was in the green too, albeit marginally. Dollar/loonie traded close to neutral territory despite the strong gains in oil.
Day ahead: UK manufacturing output expected; Riksbank minutes also due
Krona pairs could be gathering some attention as minutes from the Swedish Central Bank’s meeting on monetary policy will be made public at 0830 GMT.
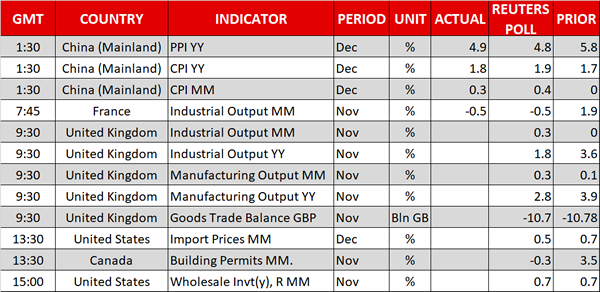
UK manufacturing output figures for November due at 0930 GMT is likely to be the release gathering most attention during Wednesday’s European session trading. Month-on-month, manufacturing output expanded for the sixth straight month in October – the longest stretch in decades – spurring hopes that the British industry could be in for a strong performance in 2018 despite analysts predicting a slowdown in overall economic activity. Today’s reading on November manufacturing production will shed light on whether factories will continue to defy downbeat forecasts on the UK economy, with forex market participants placing their sterling positions accordingly. Data on industrial output and figures on the goods trade balance will also be watched. Those will be released alongside manufacturing output numbers.
Canadian building permits for the month of November are due at 1330 GMT, with US December import prices to be released at the same time. Data on US wholesale inventories are scheduled for release at 1500 GMT.
In policymakers’ appearances, Chicago Fed President Charles Evans and Dallas Fed President Robert Kaplan will be participating in discussions later in the day; Evans at 1400 GMT and Kaplan at 1410 GMT as well as at 1515 GMT. St. Louis Fed President James Bullard is scheduled to give a presentation on the US economy and monetary policy at 1830 GMT. Neither of the aforementioned is an FOMC voting member in 2018. Bank of England Deputy Governor Ben Broadbent will be answering questions on central bank policy on BBC radio at 1500 GMT.
The EIA report on US crude and gasoline stocks pertaining to the previous week is due at 1530 GMT. Crude oil inventories are expected to have declined by around 3.9 million barrels over the period of coverage. This compares to a drawdown of around 7.4m barrels in the week that preceded.
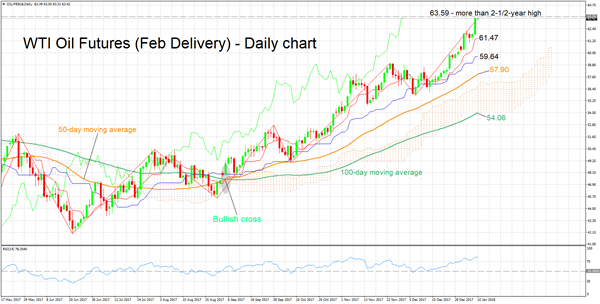
Technical Analysis: WTI oil futures rise to highest since May 2015; RSI overbought
WTI oil futures for February delivery hit 63.50 during today’s trading – their highest since May 2015 – after gaining 2.5% in Tuesday’s trading. Technical indicators are pointing to a bullish picture in the short-term: the Tenkan- and Kijun-sen lines are positively aligned and the RSI indicator has been rising over the last number of weeks. It should be noted though that RSI is in overbought territory above 70; a pullback in the short-term is not to be ruled out.
A larger-than-anticipated decline in crude stockpiles out of today’s EIA report could further boost prices, pushing them above 63.59, this being a more than 2½-year high that could be providing some resistance at the moment. Further above, round numbers – for example the 64.00 and 65.00 handles – could act as psychological barriers to additional bullish movement.
On the contrary, a smaller-than-projected drawdown in crude inventories could weaken prices. In this case, the area around the Tenkan-sen at 61.47 would come into view as potential support.
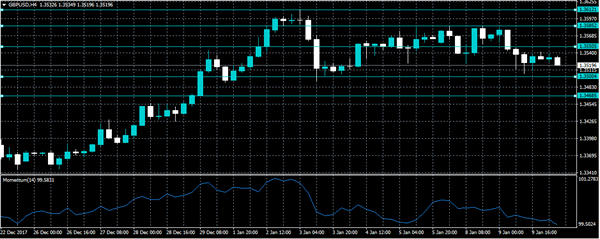
GBPUSD Downside Still Intact Below 1.3550
Downside pressure remains strong in the GBPUSD pair, as buyers failed to gain any traction above the 1.3550 resistance level. Recent intraday rallies in the pair towards the 1.3540 region have been sold-off, as price-action continues to support buying of the U.S dollar. Going forward a clear breach of the 1.3500-1.3550 price-range will determine the next short-term directional move in sterling. In the upcoming European trading session, the United Kingdom economy will release key Manufacturing and Industrial production figures for the month of December.
The GBPUSD pair remains bearish while trading below the 1.3550 technical level, a loss of the 1.3500 support region may lead to a strong sell-off towards the 1.3468 level.
Should price-action on the GBPUSD pair move above the 1.3550 level, buyers will likely push price upwards to test the 1.3585 and 1.3612 resistance levels.
USDJPY Extremely Bearish Below 112.30
The U.S dollar has moved to a new low against the Japanese yen, hitting 112.17 in early Wednesday trading, as mixed Chinese inflation figures and negative headlines from North Korea weigh on sentiment. The USDJPY pair has now pulled back slightly, with dip buyers testing the 112.30 resistance region, after intraday sellers failed to break the former price-low at 112.05. Downside price momentum in the USDJPY pair does however remain intact from Tuesday, with traders still likely to sell any rallies, after the BOJ scaled back buying on some longer-dated bond purchases.
The USDJPY pair remains strongly bearish while price-action trades below the key 112.30 level, sellers will likely be focused on the 112.05 and 111.68 downside levels.
Should the USDJPY pair start to hold price-action above the 112.30 level, buyers may try to move the pair toward the 112.70 and 112.88 resistance points.