
Sample Category Title
Canada’s retail sales surge in 2.5% mom Dec, but Jan set for pullback
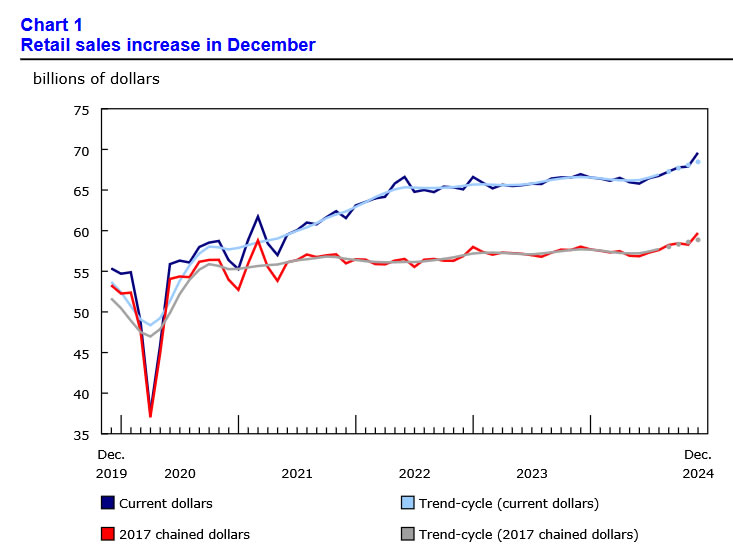
Canada’s retail sales jumped 2.5% mom to CAD 69.6B in December, far surpassing market expectations of 1.6% mom. Sales increased across all nine subsectors, with the strongest contributions from food and beverage retailers and motor vehicle and parts dealers.
In volume terms, retail sales also rose 2.5% mom, indicating that the increase was not solely due to price effects.
For Q4, retail sales climbed 2.4% qoq, marking the second consecutive quarterly gain. Adjusted for inflation, sales volumes rose 1.8% qoq.
However, momentum may have slowed at the start of 2025. Advance estimate for January suggests retail sales declined by -0.4% mom.
Canadian Dollar Eyes Retail Sales
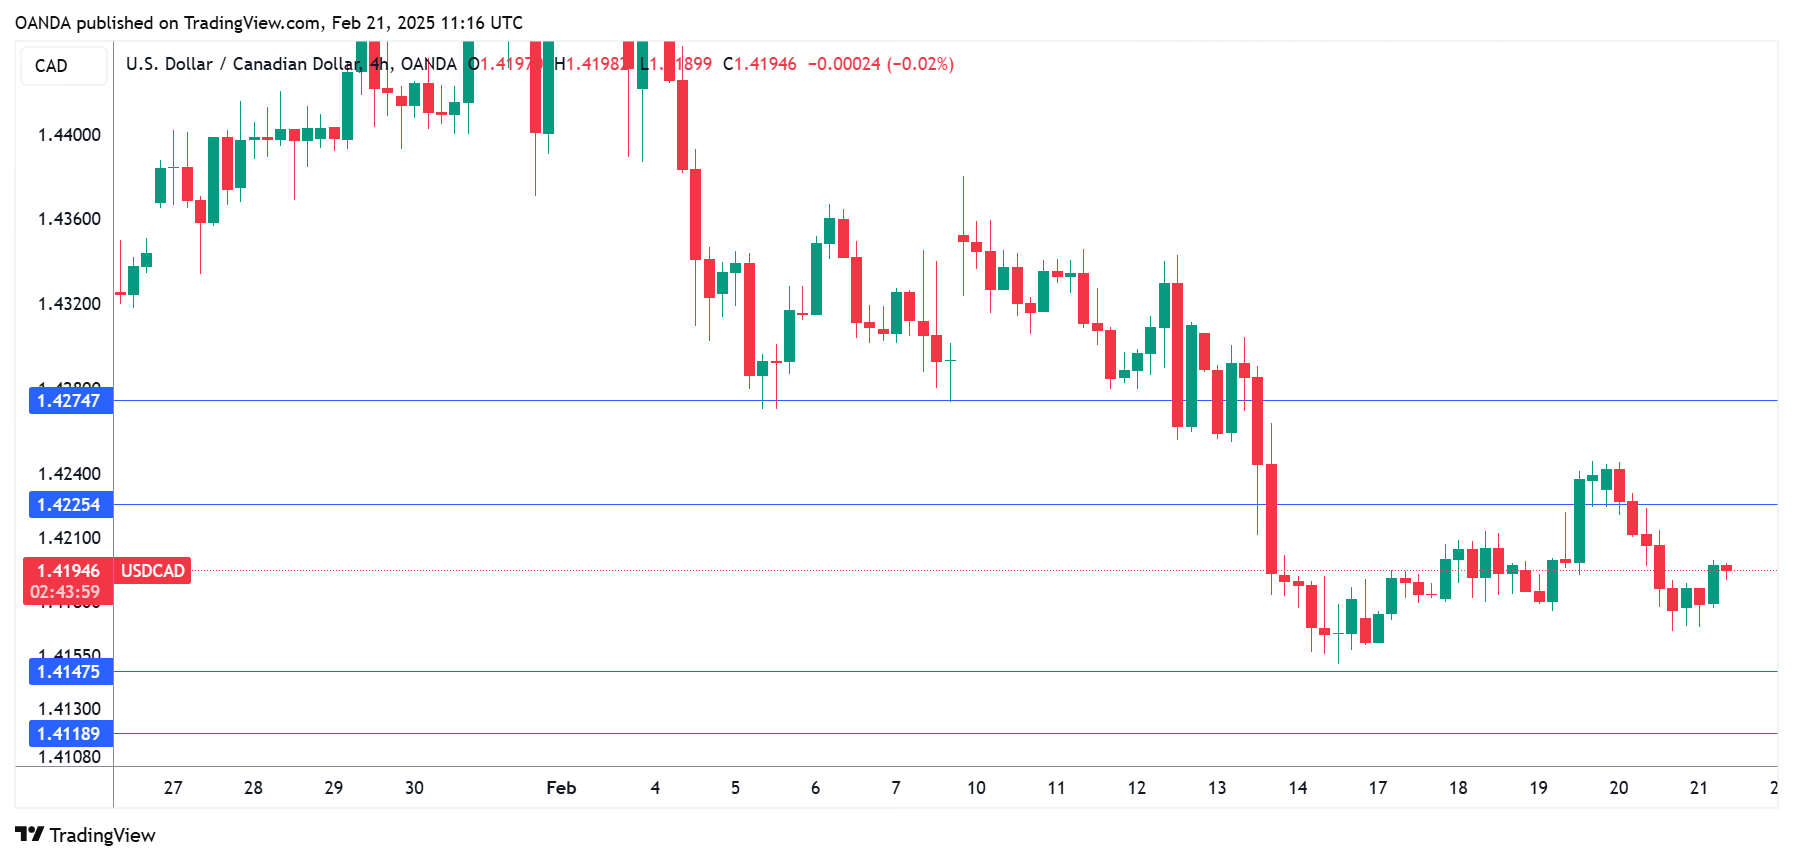
The Canadian dollar is showing small losses on Friday. USD/CAD is trading at 1.4196 in the European session, up 0.14%. On Thursday, the Canadian dollar took advantage of broad US dollar weakness and gained 0.45%.
Canada’s retail sales expected to jump
Will the week end on a high note? Canada releases retail sales for December 2024 later today and the market estimate stands at 1.6% m/m. This would mark a sparkling rebound from the flat reading in November, which was marked by lower food sales.
Retail sales have been accelerating in the second half of 2024 and the trend is expected to continue into this year. The potential headwind to consumer spending is the Trump administration’s threat to impose tariffs on Canadian products. With around 75% of Canadian exports heading to its southern neighbor, a trade war with the US would cause significant damage to Canada’s economy and Ottawa will be pulling out all the stops to placate President Donald Trump and avoid tariffs.
US tariffs would boost global inflation, which threatens to und0 the progress the major central banks have made to contain inflation. The Federal Reserve has pointed to tariffs as an upside risk to inflation and Bank of Canada Governor Tiff Macklem has acknowledged that the tariffs are causing uncertainty. The US has suspended tariffs aimed at Canada until March 3 and whether the tariffs are reinstated or not could impact the BoC’s decision at its meeting on March 12.
The US wraps up the week with manufacturing and services PMIs for February. Manufacturing PMI is expected to improve to 51.5 from 51.2, which would point to weak expansion. The services sector is slightly stronger, with a market estimate of 53.0, compared to 52.9 in January.
USD/CAD Technical
- USD/CAD is testing resistance at 141.96. The next resistance line is 142.25
- There is support at 141.47 and 141.18
UK Retail Sales Jump, British Pound Steady
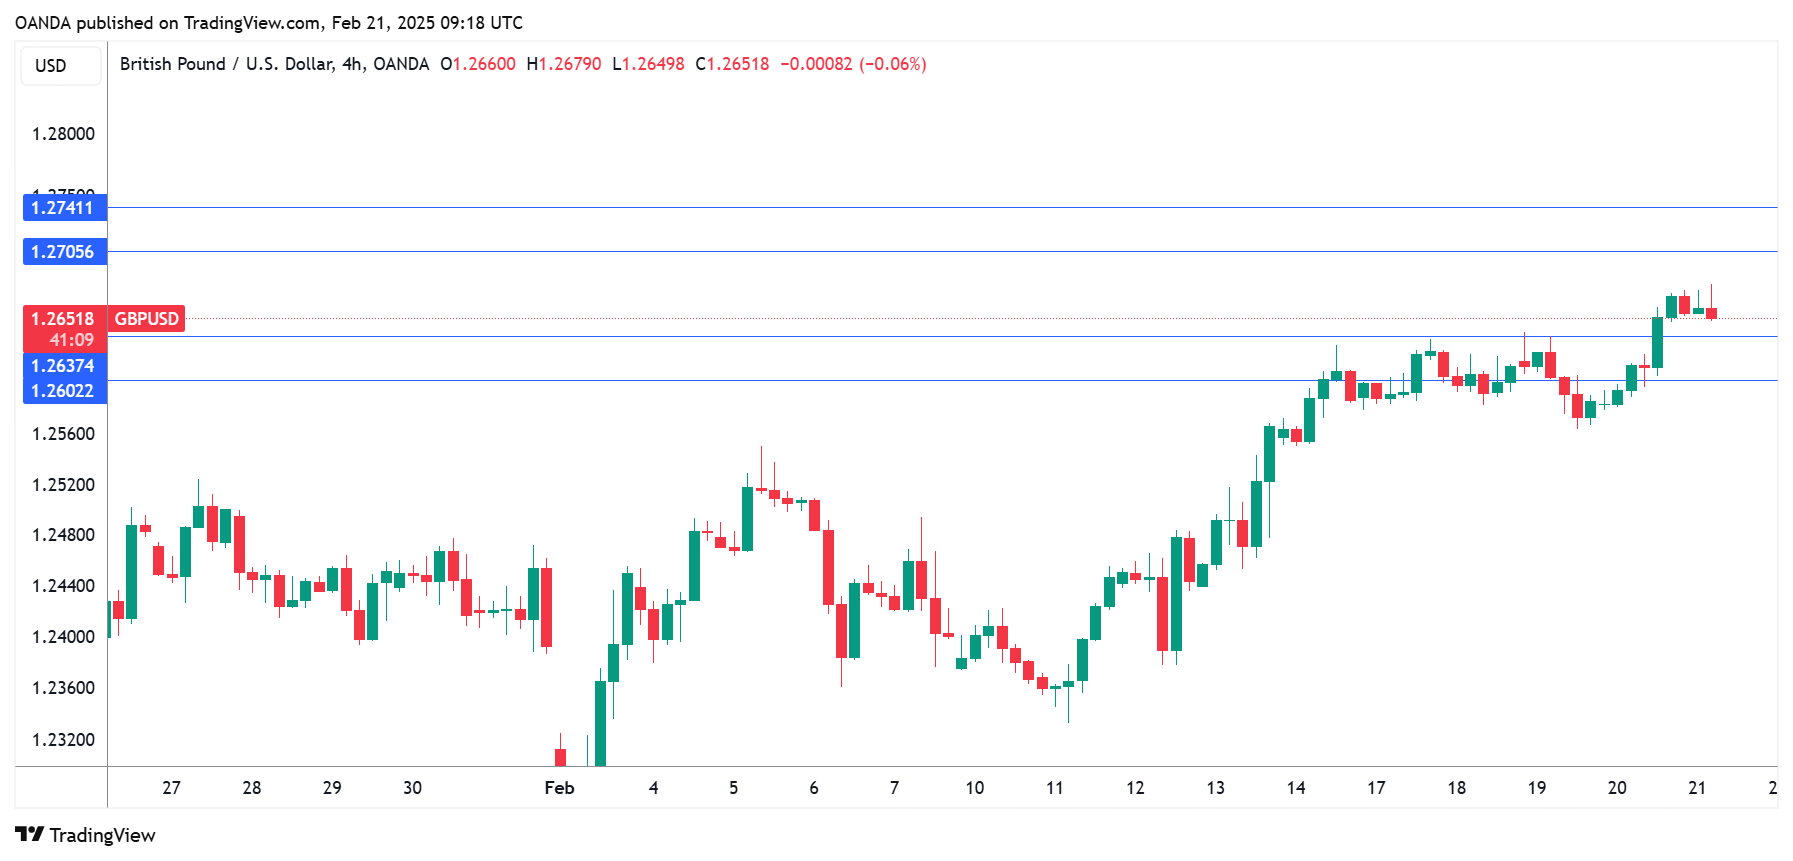
The British pound has steadied on Friday against the US Dollar after climbing 0.6% a day earlier. GBP/USD is trading at 1.2655 in the European session, down 0.1% on the day.
UK retail sales jump 1.7%
UK retail sales sparkled in January, climbing 1.7% m/m. The reading crushed the market estimate of 0.3% and bounced back from an upwardly revised -0.6% in December. This was the fastest pace since May 2024 and was largely driven by a sharp increase in food store sales. Annually, retail sales climbed 1%, down from 2.8% in December but above the market estimate of 0.6%.
UK consumer confidence remains low, but there was a slight improvement in February. The GfK consumer confidence index rose to -20 from -22, above the market estimate of -22. Consumers were less pessimistic about economic conditions, which may have resulted from the Bank of England’s rate cut last month. Still, consumer confidence is mired in negative territory, as consumers are in a sour mood.
The UK economy barely registered any growth in the second half of 2024 and the BoE cut in half its forecast for economic growth in 2025. Meanwhile, inflation is moving the wrong way. In January, CPI surprised to the upside and hit 3%, a ten-month high. Low growth and high inflation has policymakers concerned about stagflation, which could cause significant damage to the economy.
UK PMIs for February were a mixed bag. Manufacturing PMI ease to 46.4, down from 48.3 in January and shy of the market estimate of 48.4. It was the lowest level since Dec. 2023 as output and employment levels declined. The services sector is in better shape and the PMI rose to 51.1 from 50.8, indicating weak expansion.
GBP/USD Technical
- GBP/USD is testing support at 1.2637. Below, there is support at 1.2602
- 1.2705 and 1.2740 are the next resistance lines
ECB-Fed Divergence May Limit EUR/USD Gains Above 1.0500
The US dollar is giving back gains despite the tariff talk, rate cuts in Australia and New Zealand and despite the hawkish Federal Reserve (Fed) minutes that hinted that the Fed officials are inclined to keep the rates unchanged until they see ‘further progress on inflation before making additional adjustments’. The dollar index tested the 100-DMA yesterday and is consolidating near that level this morning. The major support to the September to January rebound – or say the Trump rebound – is seen near the 106 level. A move below this level could mark the end of the kneejerk Trump rally in the US dollar and send the greenback into the medium-term bearish consolidation zone and let the major peers regain some ground despite dovish expectations there.
In this context, the Reserve Bank of Australia (RBA) cut its interest rates for the first time in more than four years, but the AUDUSD spent yesterday recovering losses. The EURUSD on the other hand remains under pressure – except yesterday’s rebound - as the European Central Bank (ECB) expectations remain soft and sweet despite a higher-than-expected CPI print in France. The ECB is now expected to pull the interest rates below 2% to help the underlying economies deal with the economic weakness and the US threat. The latter divergence between the ECB and the Fed expectations should keep the EURUSD’s upside potential limited above the 1.05 psychological level. Many traders could also chose to turn neutral before Sunday’s German election.
Across the Channel, sterling hawks got a boost from the higher-than-expected CPI report released earlier this week – which showed that headline inflation in Britain returned to 3% in January. Combined with the US dollar’s recent weakness, Cable is drilling above 1.2650, the major 38.2% Fibonacci retracement on September to January selloff. The pair has freshly stepped into the medium-term bullish consolidation zone and could extend gains on the back of more hawkish Bank of England (BoE) outlook and hope that Britain could get less harmed by Trump policies. But UK’s growth outlook is on a slippery ground and Rachel Reeves growth plans are not going... according to the plan. On the contrary, consumer confidence in the UK sank to the lowest levels since Labour came to power. And lower confidence and spending from households means trouble for the UK economy that relies heavily on services. As such, Cable’s rally could bump into solid offers near the 200-DMA – that stands a few pips below the 1.28 mark.
On the trade front
Donald Trump said earlier this week that 25% levies would probably be imposed on cars, chips and pharmaceuticals, but didn’t really provide clarity on whether the cars made under the free trade agreement with Canada and Mexico would be impacted. German DAX index gave back gains this week, along with the rising political tensions into this weekend’s snap election. The EURUSD is under pressure this morning.
More details on US tariffs are expected to land around April 2nd... But more specifically on the European front, the US’ pulling back its military support is reviving discussions about how much to spend on defence to get the European armies up to date and how to finance costs. The US safety shocker could wake up the sleeping European Beauty – but it will take time.
On the Chinese front, the news are surprisingly well. Not only that Xi Jinping met with the Chinese Big Tech leaders to show off their now-improved relationship, but Trump also said that there could be a trade agreement with China as he’s got a ‘great’ relationship with Xi. And to top it all, Alibaba announced strong quarterly results – its fastest in a year – and said that AI is their ‘primary objective’. Alibaba shares gained more than 12% in Hong Kong today and they are up by more than 75% since mid-January.
Overall, the Chinese AI story is developing with Alibaba’s AI model on one hand and DeepSeek’s ChatGPT-like AI model on the other hand. Both feed into other companies’ services. Apple for example chose to integrate Alibaba’s AI model in its Chinese phones hoping to boost sales, while BYD and Tencent – the provider of the Chinese WeChat app - are teaming up with DeepSeek to enhance their services. And Chinese companies’ ambition to integrate AI models into existing services in a fast fashion is boosting appetite for investors globally – along with Xi’s most obvious support. As such, the HSI index is testing the highest levels since last October with sizeable upside potential. Chinese technology stocks are trading at significant discounts compared to their US counterparts. The Nasdaq Golden Dragon Index, which tracks major Chinese companies listed in the US, is trading at a forward PE ratio near a record low relative to the Nasdaq 100 Index.
Crypto Market Completes Initial Rebound, Nearing Key Resistance
Market picture
The cryptocurrency market has added 1.3% in the last 24 hours to $3.24, approaching the upper boundary of the consolidation range after the collapse in early February. Only the ability to rise above $3.3 trillion would signal an exit from consolidation and be a prologue for a return to the $3.50 area or a move to all-time highs near $3.70.
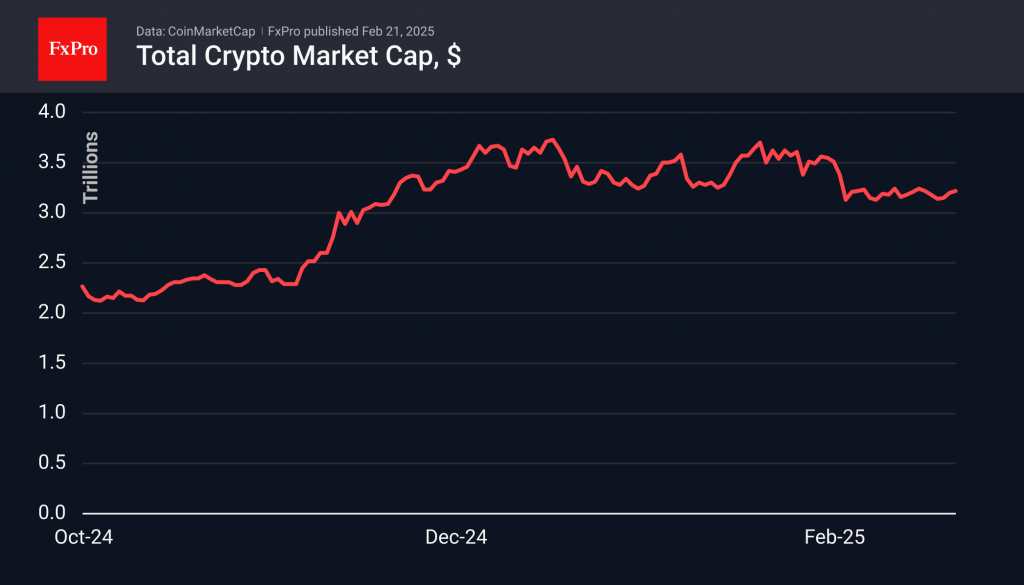
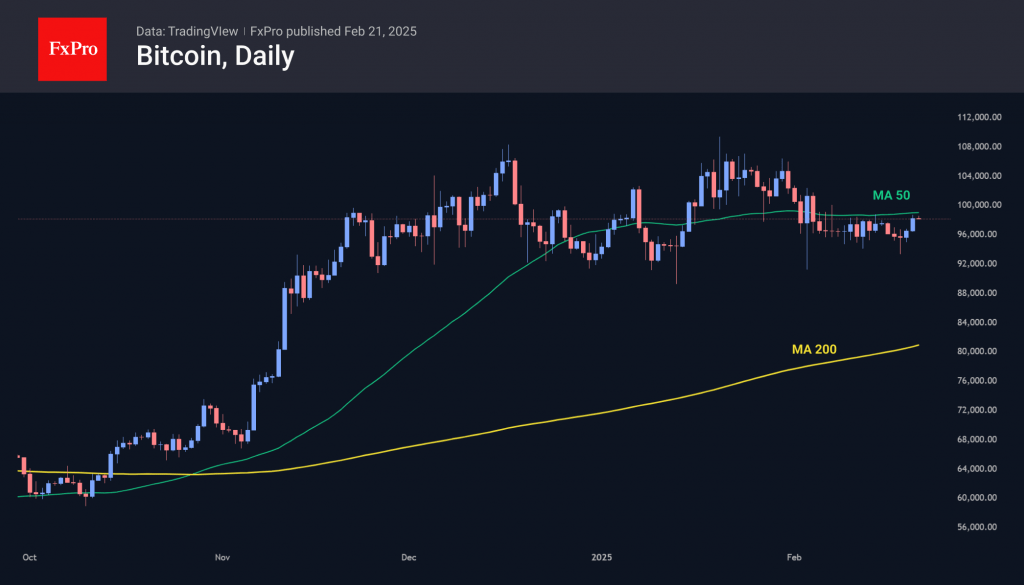
Bitcoin has risen to $98,000, once again trying to break above the 50-day moving average. As with the crypto market, Bitcoin has found enough buyers on dips and has done the easy part with a return to meaningful resistance levels. Only a confident move higher will mark the start of a new rally phase.
News Background
JPMorgan notes that the observed weakening of institutional demand for Bitcoin and Ethereum futures on the CME is a bearish signal for the near term. The lack of positive catalysts and fading price momentum are the reasons.
QCP Capital records demand for high delta call options on Bitcoin, indicating growing expectations of strong price growth in the future. Implied volatility has shifted in favour of calls across all maturities, indicating bullish market positioning.
Trump linked Bitcoin’s highs to his policies. According to him, BTC has set new records because everyone knows he is committed to making the US the crypto capital of the world.
Stacks platform CEO Muneeb Ali said most second-tier bitcoin-based projects will disappear within three years. He said the market is evolving in a highly competitive environment, and enthusiasm around L2 solutions has waned markedly.
The CBOE has filed a Form 19b-4 proposal with the SEC asking it to approve staking in 21Shares’ Ethereum-based ETF. The NYSE previously filed a similar proposal for Grayscale’s Ethereum-ETF.
The SEC has softened its stance on regulating cryptocurrencies and DeFi. The regulator filed a motion to withdraw an appeal of a ruling limiting the application of securities laws to users of cryptocurrencies and DeFi services.
Ten companies have been approved to issue stablecoins in the European Economic Area (EEA) under MiCA rules. Tether, the USDT issuer, is absent from the list. Circle, the issuer of USDC, the main competitor of USDT, received the right to issue stablecoins in the EEA back in July.
Solana’s (SOL) annual inflation rate rose 30.5% after the implementation of a new fee allocation model on the platform (SIMD-0096), Blockworks notes. Recent scandals surrounding LIBRA, and previously TRUMP, MELANIA, BARRON and HAWK, have undermined Solana’s reputation and increased pressure on the altcoin market.
USD/JPY Recovers After Dropping Below 150 Yen per Dollar
As the USD/JPY chart shows:
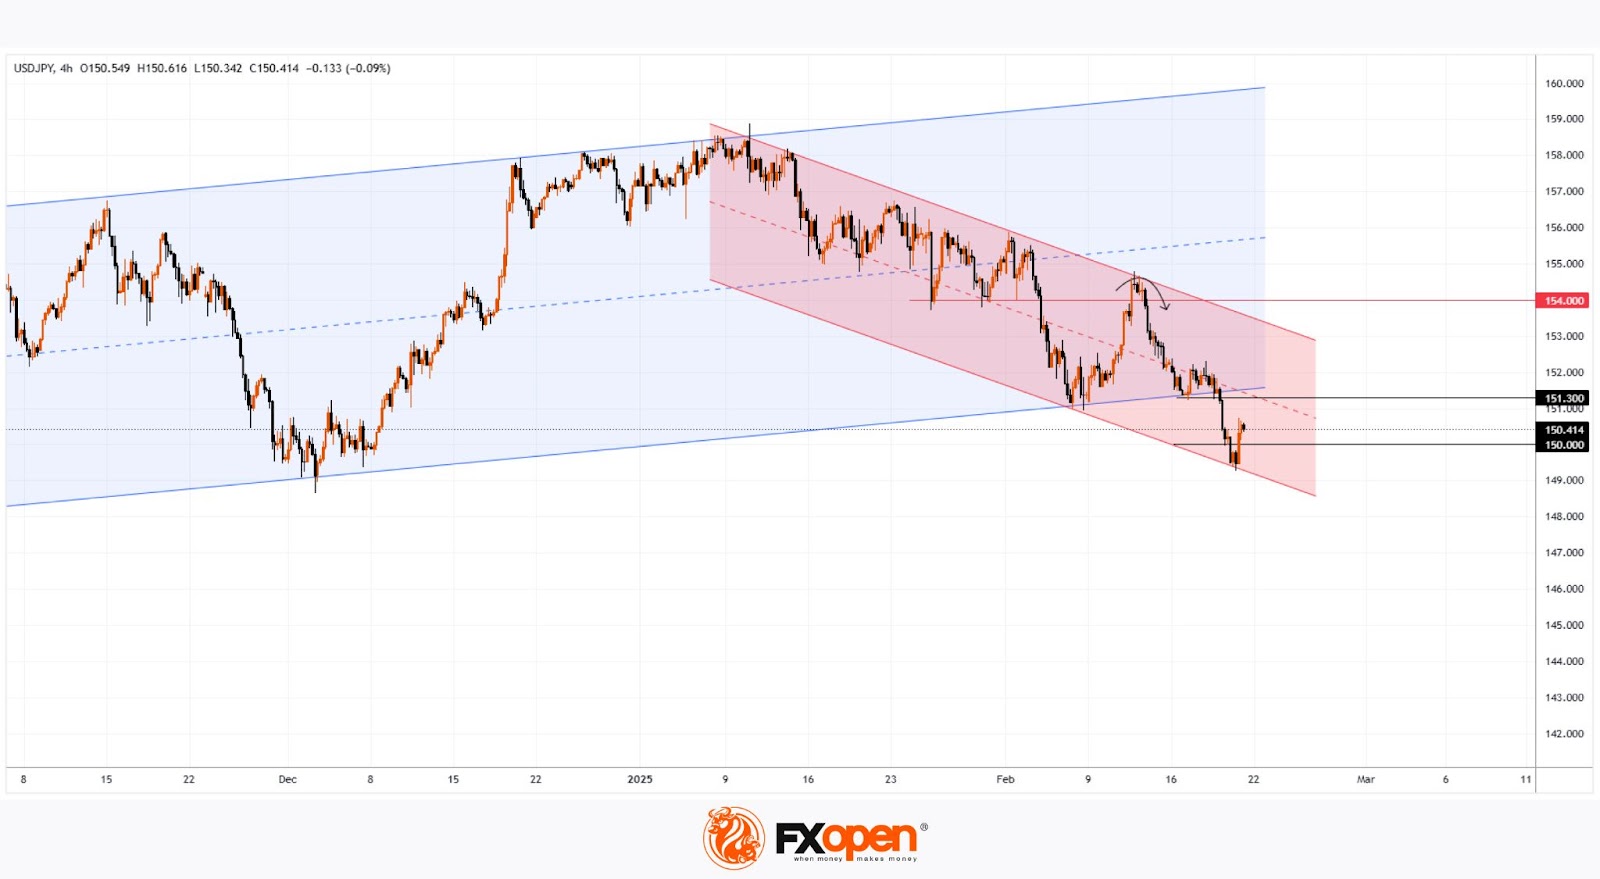
→ Yesterday, the pair fell below the psychological level of 150 yen per dollar.
→ However, today it staged a strong recovery, rising back above this level.
The yen weakened following the release of Japan's inflation data. According to Forex Factory, the National Core CPI increased by 3.2% year-over-year (forecast: 3.1%, previous: 3.0%).
According to Reuters:
→ The 19-month high in CPI strengthens expectations of further interest rate hikes in Japan.
→ The yen is weakening as Bank of Japan Governor Kazuo Ueda stated that the central bank may step up government bond purchases if long-term interest rates rise.
Can USD/JPY Continue to Rise?
USD/JPY Technical Analysis
On 12th February, we noted that key highs and lows over the past three months formed an ascending channel, with the 154 yen per dollar level acting as a resistance barrier.
Indeed, since then, bulls have failed to sustain levels above 154 yen per dollar (as indicated by the arrow), leading to a decline below the lower boundary of the blue channel after a brief rebound on 18th February.
As a result, the former support at the lower boundary of the blue channel may now act as resistance around 151.3 yen per dollar, reinforcing the relevance of the descending channel (marked in red).
The trajectory of USD/JPY today could be significantly influenced by the release of the US Flash Manufacturing PMI and Flash Services PMI indices at 16:45 GMT+2.
Trade over 50 forex markets 24 hours a day with FXOpen. Take advantage of low commissions, deep liquidity, and spreads from 0.0 pips. Open your FXOpen account now or learn more about trading forex with FXOpen.
This article represents the opinion of the Companies operating under the FXOpen brand only. It is not to be construed as an offer, solicitation, or recommendation with respect to products and services provided by the Companies operating under the FXOpen brand, nor is it to be considered financial advice.
UK PMI composite dips to 50.5, stagflation dilemma for BoE
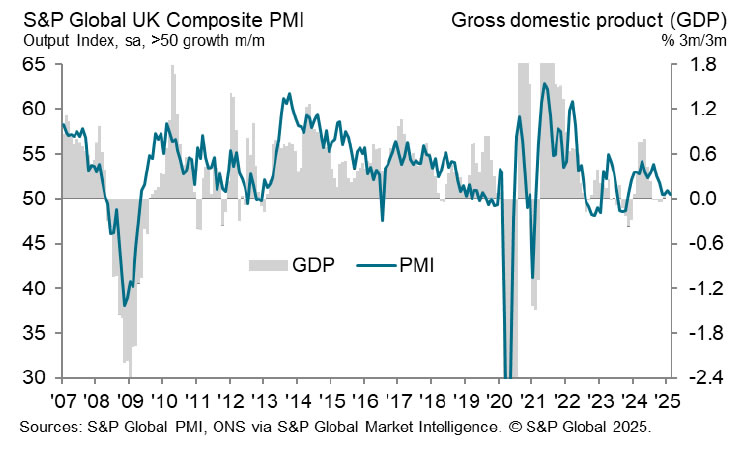
UK’s PMI Manufacturing dropped from 48.3 to 46.4 in February, a 14-month low. PMI Services edged up slightly to 51.1 from 50.8, while Composite PMI dipped to 50.5 from 50.6, indicating minimal overall growth.
Chris Williamson, Chief Business Economist at S&P Global Market Intelligence, noted that business activity remained "largely stalled" for the fourth straight month, with job losses accelerating amid declining sales and rising costs. He cautioned that the combination of stagnant growth and mounting price pressures is creating a "stagflationary environment," presenting a "growing dilemma" for BoE.
A primary driver of inflationary pressure is the increase in firms raising prices to offset rising staff costs tied to the National Insurance hike and minimum wage increase announced in the autumn Budget. However, these same fiscal measures have also exacerbated job cuts, with employment falling at its fastest pace since the global financial crisis, excluding the pandemic period.
Eurozone PMI manufacturing rises to 47.3, but services falls to 50.7
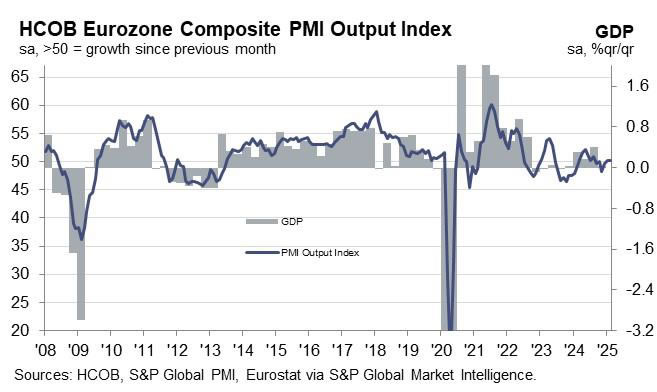
Eurozone Manufacturing PMI improved from 46.6 to 47.3 in February, a nine-month high. However, Services PMI declined to 50.7 from 51.3, dragging Composite PMI flat at 50.2, indicating near stagnant overall growth.
Cyrus de la Rubia, Chief Economist at Hamburg Commercial Bank, highlighted that services sector price pressures remain elevated, creating complications for the ECB ahead of its next meeting. Persistent wage growth and rising input costs in manufacturing, driven by energy prices, add to inflationary risks.
Regionally, France’s services sector led the slowdown, with business activity deteriorating at an accelerated pace since September. In contrast, Germany maintained modest growth, supported by expectations of greater political stability ahead of its federal elections.
EUR/USD Poised to Renew Two-Month Highs as Buying Momentum Builds
The EUR/USD pair is hovering around 1.0503, extending its rally since midweek. The major currency pair has climbed to a two-month high, with market sentiment favouring further gains.
Key drivers behind EUR/USD’s rise
A decline in US Treasury bond yields has weighed on the US dollar, following a series of weaker-than-expected US economic reports and dovish remarks from Federal Reserve officials.
Austan Goolsbee, President of the Federal Reserve Bank of Chicago, stated that he does not expect the Core Personal Consumption Expenditures (PCE) index to be as concerning as the recent Consumer Price Index (CPI) data. As a key inflation measure for the Federal Reserve, the Core PCE significantly influences monetary policy expectations.
Meanwhile, St. Louis Fed President Alberto Musalem warned of stagflation risks and the potential challenges in setting future policy.
The latest US jobless claims data further raised concerns, showing an increase to 219,000 from the previous 213,000, exceeding the forecast of 214,000.
In the eurozone, the euro could see further upside if the German election outcome triggers additional short-covering in EUR/USD.
Technical analysis of EUR/USD
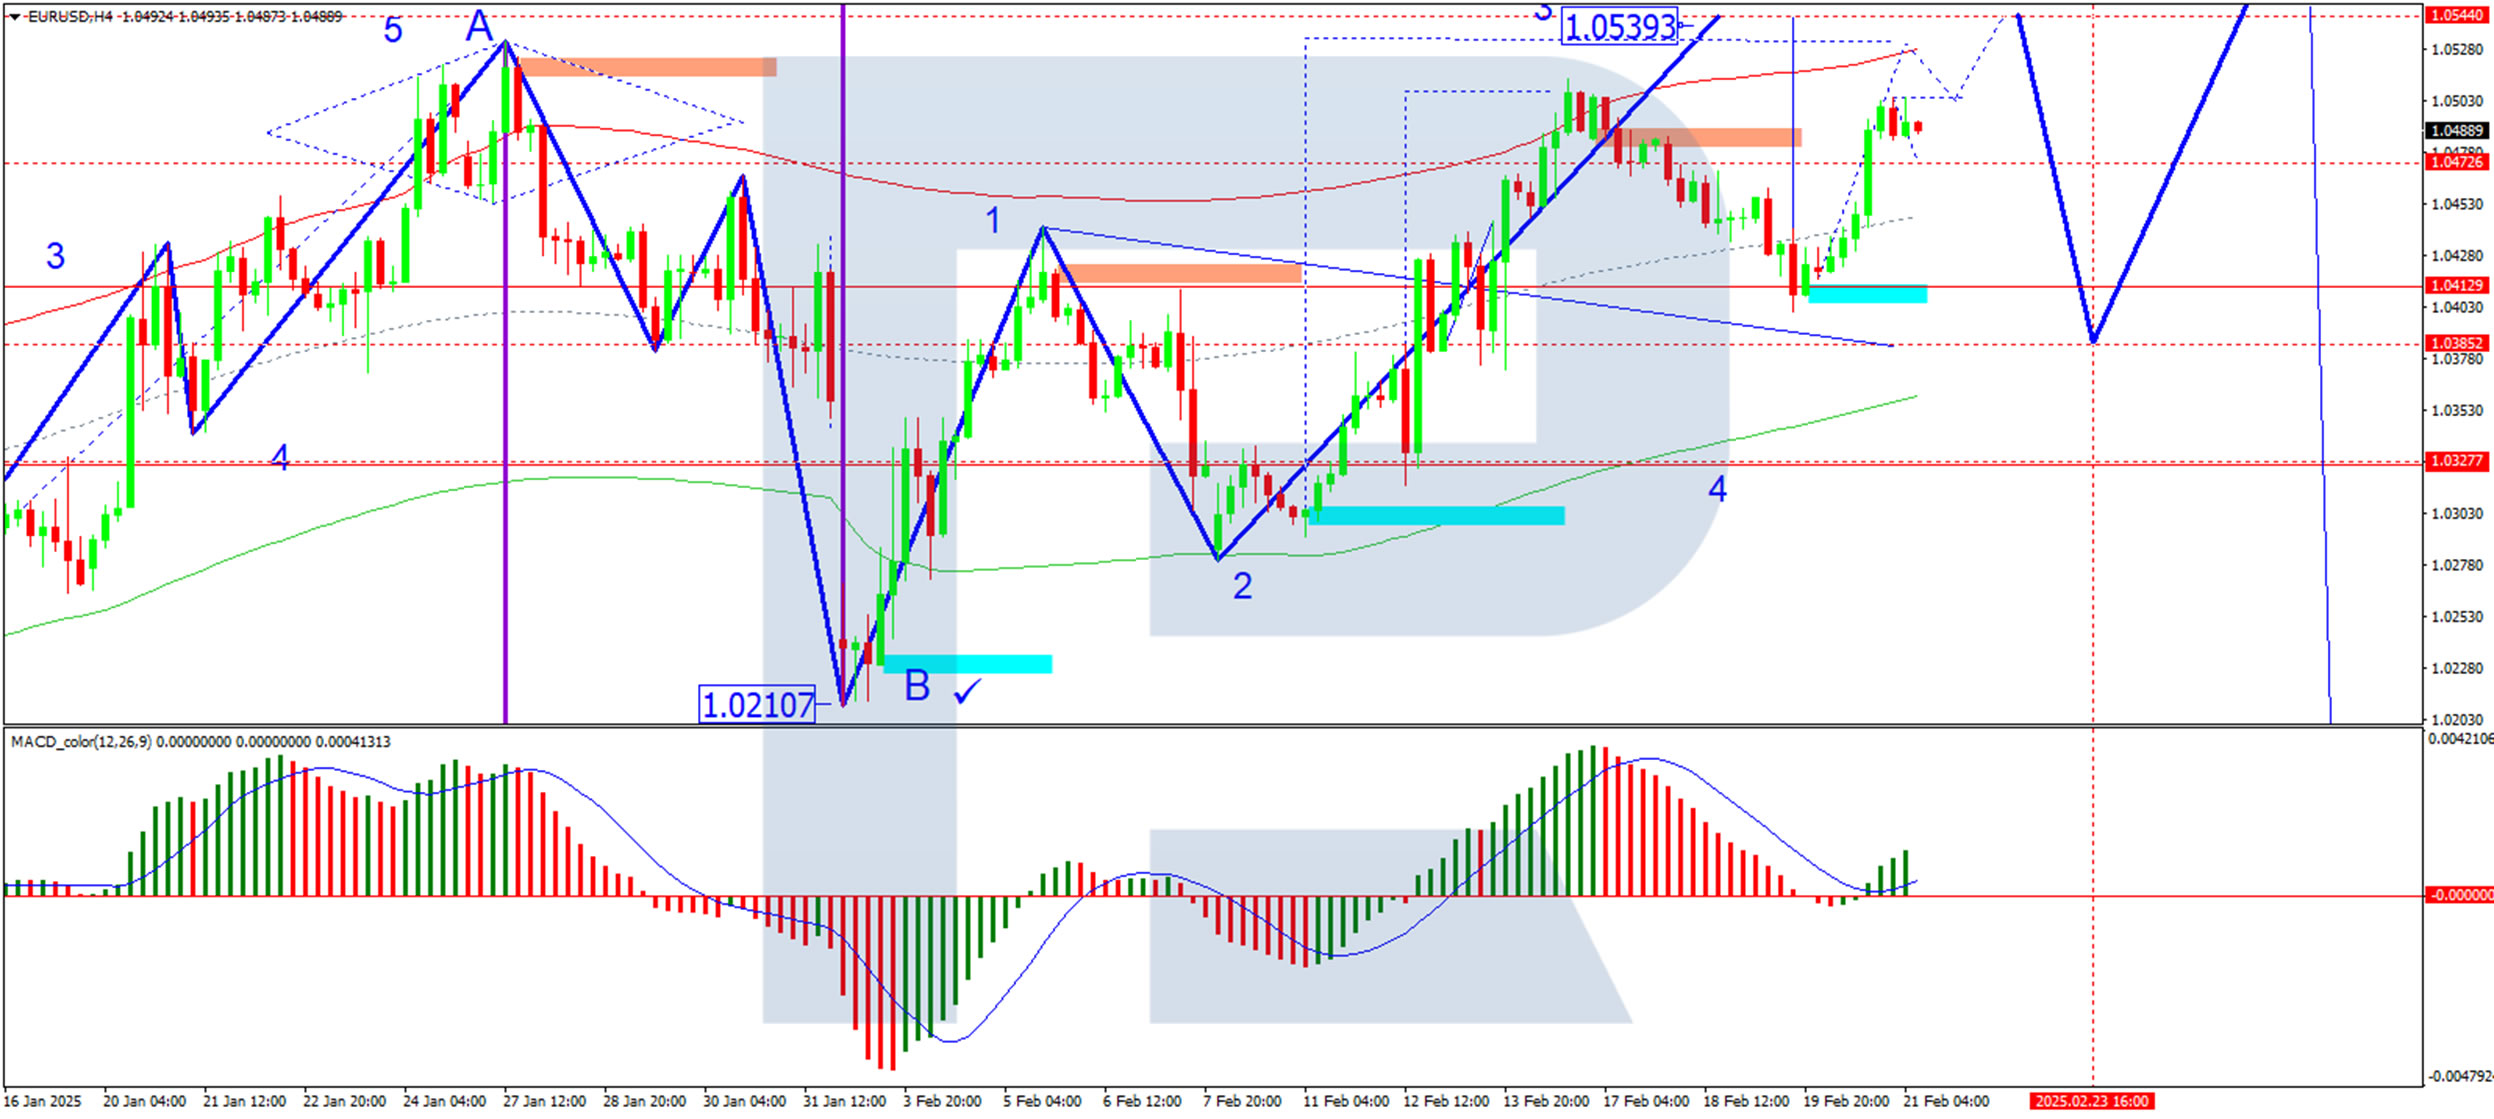
On the H4 chart, EUR/USD has completed a growth wave to 1.0470, forming a consolidation range around this level. The market has since broken higher, paving the way for further gains towards 1.0544. A correction towards 1.0385 may follow after reaching this level. The MACD indicator supports this scenario, with its signal line above zero and pointing upwards, indicating continued bullish momentum.
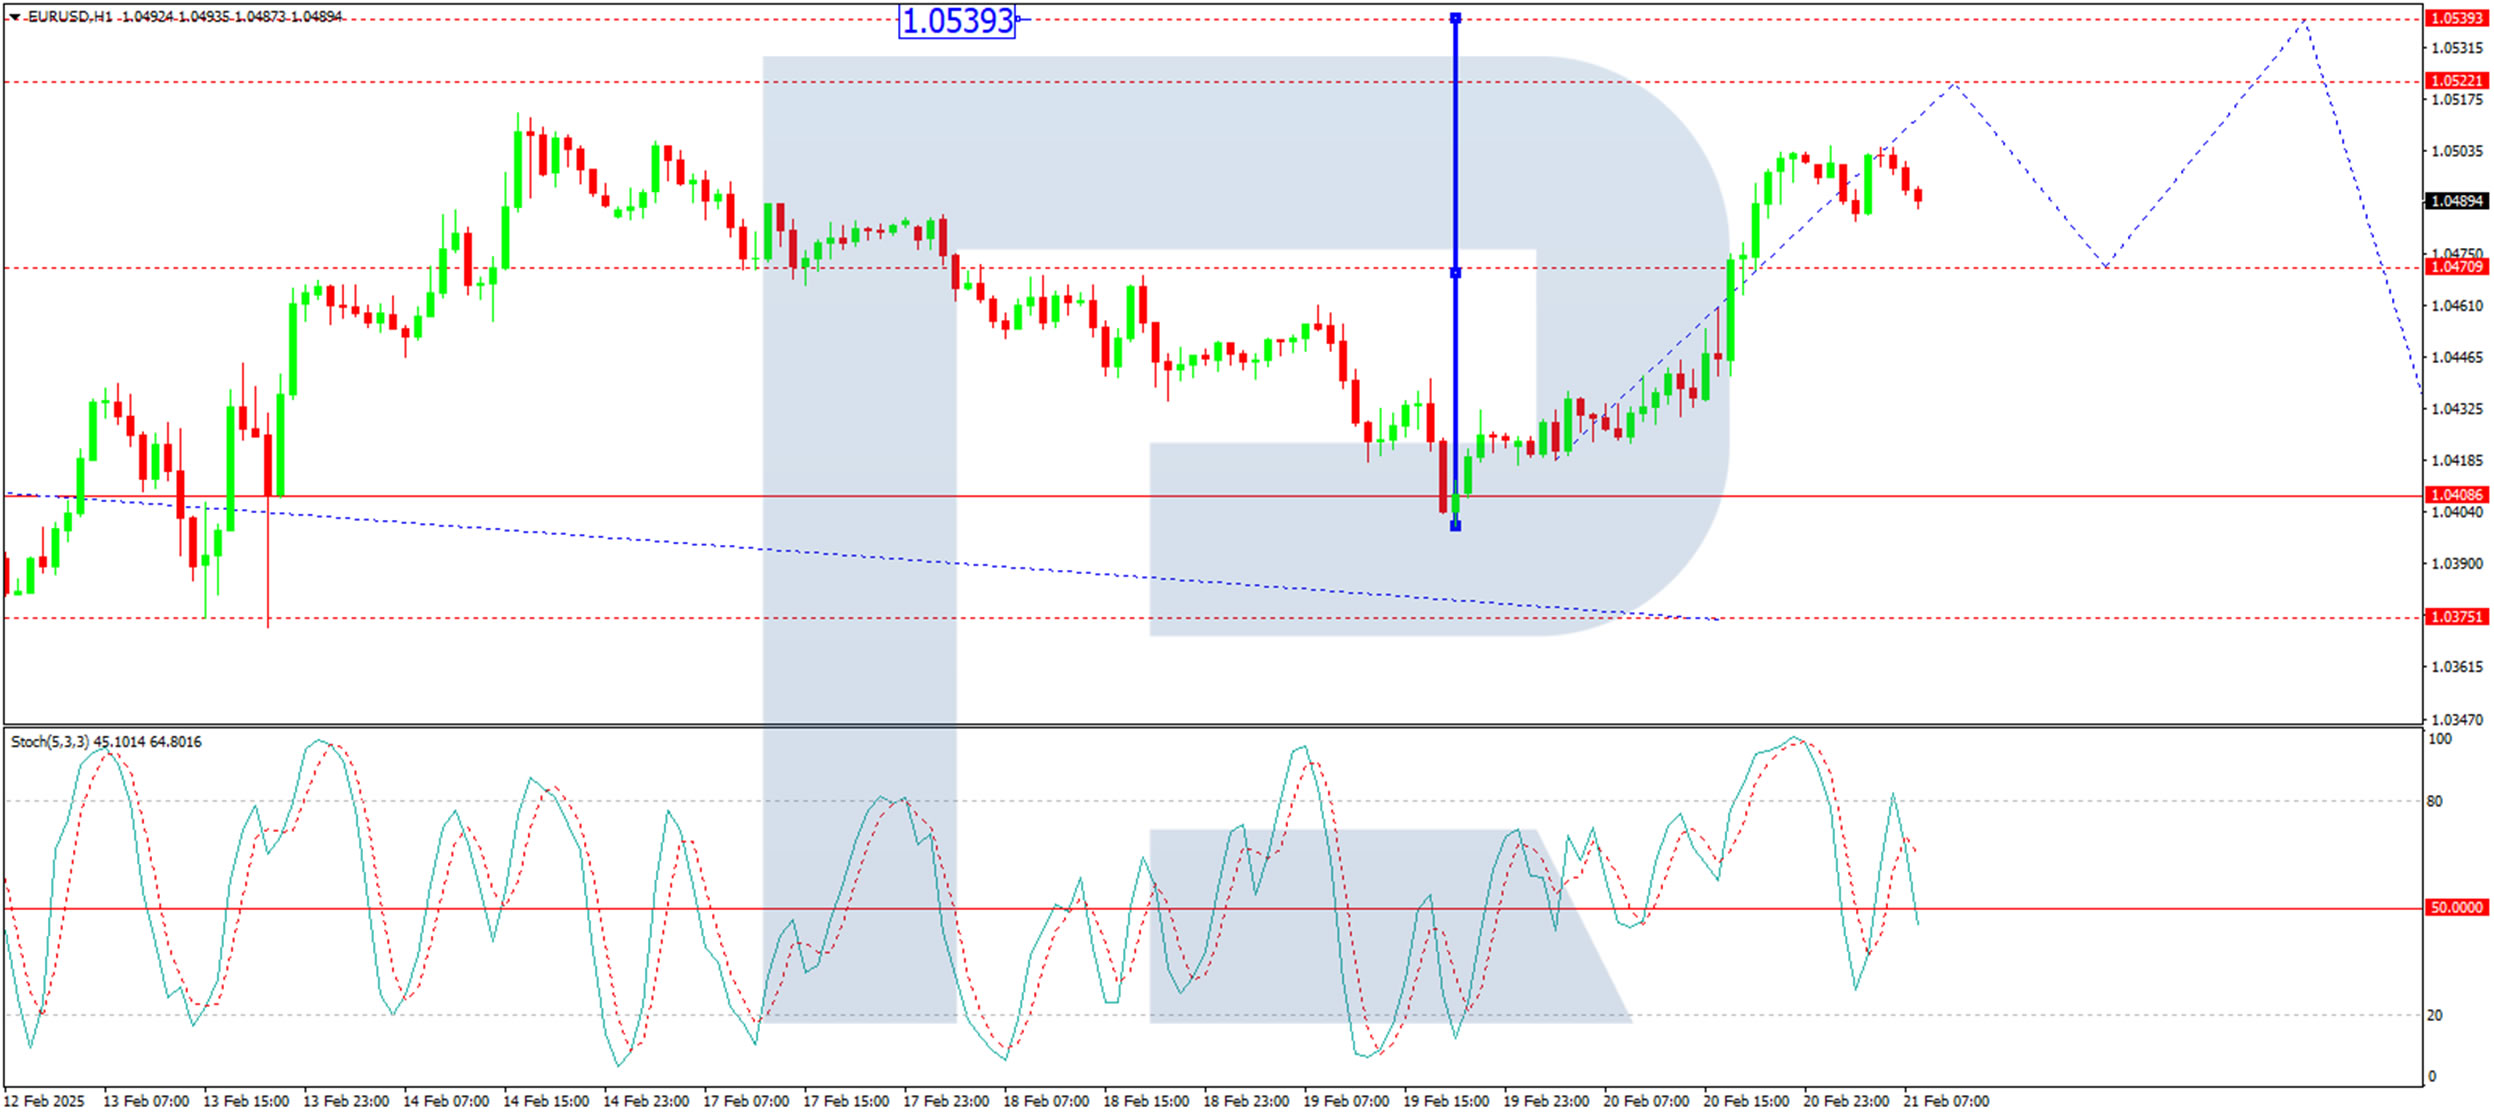
On the H1 chart, the pair executed a growth wave to 1.0470, followed by a narrow consolidation range around this level. The likelihood of an upward breakout towards 1.0520 remains high. After reaching this level, a correction to 1.0470 could occur before the growth wave resumes towards 1.0544. The Stochastic oscillator confirms this outlook, with its signal line above 80 and trending towards 20, suggesting a possible pullback before further gains.
Conclusion
EUR/USD remains in an uptrend, supported by weakening US Treasury yields and a cautious Fed outlook. If bullish momentum continues, the pair may extend gains towards 1.0544. However, a corrective move could follow before further upside. The outcome of the German election could also influence short-term price action, potentially driving additional volatility.
Monthly PMI Release May Spark Some Volatility Today
Markets
Bessent’s interview with Bloomberg offered a welcome distraction in yesterday’s generally dull trading session. The US Treasury Secretary touched on a range of topics, including on the US’ debt maturity profile. He ruled out terming out the debt for the time being, due to elevated inflation and the Fed being a competitive seller through QT. US yields eased a few basis points with the long end outperforming. German rates declined about 2 bps across the curve in technical trading. Bessent also tried to quell speculative market chatter about a potential gold revaluation of the US reserves. Such a one-off windfall would generate some $800bn out of thin air but is not what Bessent “had in mind” when he said he wants to monetize the US balance sheet. Gold prices eased from its intraday highs but still finished with a record. The US dollar fainted into late-European and US dealings even though risk sentiment was a bit shabby. EUR/USD surged towards 1.05. The trade-weighted index tested support at 106.35 (38.2% retracement on the Q4 rally). USD/JPY closed sub 150 for the first time since December only to reverse course this morning.
The monthly PMI release may spark some volatility today. The January edition for the first time since August of last year suggested the European economy eked out a bit of growth with the composite indicator venturing north of 50. Consensus expects this (painstakingly slow) bottoming out process to continue in February. The overarching PMI would rise from 50.2 to 50.5 on improvements in both manufacturing (47 from 46.6) and services (51.5 from 51.3). We hold a similar view. Barring (external) shocks, we think the European economy has seen the trough but lacks the drivers to get into higher gear for now. Unless the PMIs offer a positive surprise, it may be difficult for European rates to rally and EUR/USD to steam ahead beyond first resistance levels of 1.0533 and 1.0551. That’s particularly the case given event risk looming this weekend. German elections on Sunday could be a gamechanger, for the country and EU. The polls offer three scenario’s, assuming the far-right AfD (currently running at 20% in the polls) won’t be joining any coalition. The “Grand Coalition” of CDU/CSU and SPD (socialists) is the most market friendly one: it’s simply, straightforward and known territory. The “Kiwi Coalition” – CDU/CSU & the Greens – has never been tested on a federal level and ideological differences are larger than in a Grand Coalition. The least-favourable outcome is a three-way coalition (“Kenya”) with all of the above parties setting the stage for difficult and long negotiations. On one thing they all agree though: the debt brake must be adjusted or lifted to unlock a necessary fiscal impulse.
News & Views
The Japanese Statistics Bureau this morning reported inflation (ex. fresh food) rising further in January by 0.4% M/M and 3.2% (from 3.0%), slightly higher than expected. Core inflation ex. food and energy also rose from 2.4% to 2.5% while overall headline inflation accelerated to 0.5% M/M and 4.0% Y/Y (from 3.6%). The data add evidence to the upward price spiral that the BoJ is looking for even if it’s especially food prices that are rising (1.8% M/M and 7.8% Y/Y). Services inflation slowed to 1.4% Y/Y from 1.6%. For the BoJ to be sure that inflation is driven by higher wages, the services component preferably gets more weight as a driver for inflation. Even so, today’s report still supports the case for further BOJ policy tightening. In another release this morning, the composite PMI improved further in February from 51.1 to 51.6, the strongest pace in five months. The details of the report were a bit mixed. The modest improvement driven by sustained growth in services activity (53.1), while manufacturing output declined at a softer rate 48.6 from 47.3). New business increased for the seventh time in eight months, but the rise was assessed as modest. Orders for manufacturing continued to decrease but the decline was mild and more than offset by services. Confidence on activity growth over the next 12 months softened in February, to the lowest point since January 2021 on labour shortages, persistent inflation, and economic malaise in the domestic economy. Employment levels in the Japanese private sector rose at their slowest rate in just over a year. Additionally, the rate of input price inflation across the private sector was little changed from January’s historically sharp pace. Aside from the data, comments from BOJ governor Ueda this morning did catch the eye. On a question in Parliament, the governor indicated that the Bank is still ready to purchase government bonds if long term yields are rising too sharply. The 10-y yield (1.43%) recently rose to the highest level since 2009. While this in part may be driven by higher market inflation expectations, the BoJ signals that it still keeps a close eye on markets to develop orderly. The rise in LT yields slowed after the release (10-y currently minus 1.5 bp).