
Sample Category Title
Week Ahead – German Elections and US PCE Inflation on Investors’ Radar
- Germany goes to the polls, but far-right AfD unlikely to form government.
- German CPI data might be bigger driver for the Euro.
- US inflation also in the spotlight as PCE report awaited.
- CPI releases in Australia and Japan, Canadian GDP also on tap.
Will German elections change the outlook much?
When Germany’s chancellor, Olaf Scholz, called a snap general election back in December, there was hope that a new government would inject much life into the flagging economy. With the February 23 election day almost here, it’s unclear how consequential Sunday’s vote will be, if at all.
Looking at the latest polls, the conservative CDU/CSU bloc is likely to be the biggest party in the Bundestag. But they will need the support of at least one other party to be able to form a majority government. This is where incumbent Chancellor Scholz’s SPD party comes in. Although the two are not natural partners, a grand coalition may be necessary to keep the far-right AfD out of power.
However, this may be difficult to do if the AfD or far-left parties like The Left get more votes than expected, shrinking the main parties’ shares even more than what the polls currently indicate. The Greens and the FDP have already lost significant votes so any coalition that doesn’t include both the CDU/CSU and SPD may not be very stable.
And with all the main parties having ruled out an alliance with the AfD, Scholz and CDU/CSU leader Friedrich Merz will have no choice but to find enough common ground to steer the country for the next four years. One area where the two parties might struggle, but which is the most crucial for the markets, is the debate about whether to relax Germany’s strict debt brake rule. The German government is obliged constitutionally to keep the structural deficit of the budget at no more than 0.35% of GDP.
Loosening this rule could go a long way in boosting spending to lift the economy out of the doldrums. But the CDU/CSU isn’t too keen on tweaking it and is likely to attach conditions to any agreement to raise the borrowing limit.
Nevertheless, if on Monday morning the election results point to a CDU/CSU and SPD coalition, the euro could enjoy a modest rally, and if in the coming days the party leaders decide to prioritize reforming the debt brake, there could be further gains for the single currency.
However, if the AfD comes a close second, the euro could face some selling pressure as the government may require the party’s votes to pass some legislation even if it’s not included in the new coalition, allowing it to push through some of its far-right agenda.
Data to also matter for the Euro
In the event that the German elections don’t bring about much of a political shift in Europe’s largest economy, traders may turn their attention to the incoming data. The Ifo survey is out on Monday and will shed some light on German business sentiment in February, while on Friday, the preliminary CPI numbers are due to be published.
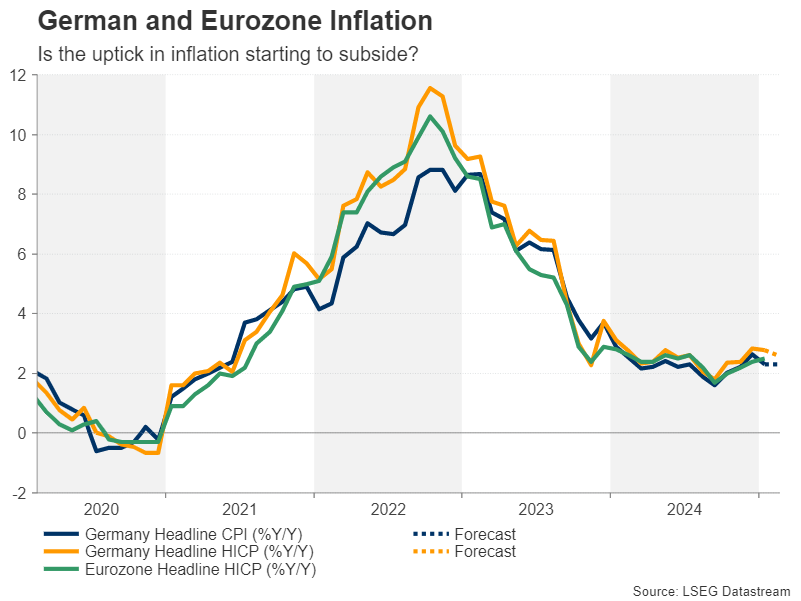
Eurozone inflation has been creeping higher since October so a further uptick in Germany’s prints could cast doubt on expectations of three more 25-bps rate cuts by the ECB this year.
As for the euro area, the final CPI estimates for January are out on Monday. Investors will also be keeping an eye on the minutes of the ECB’s January meeting due on Thursday. Any worries among policymakers about inflation not coming back down to 2% quickly enough could provide some upside to the euro, although on the whole, it’s unlikely that either the German CPI or ECB minutes will significantly move the needle for rate cut bets.
PCE inflation may keep rate cut optimism alive
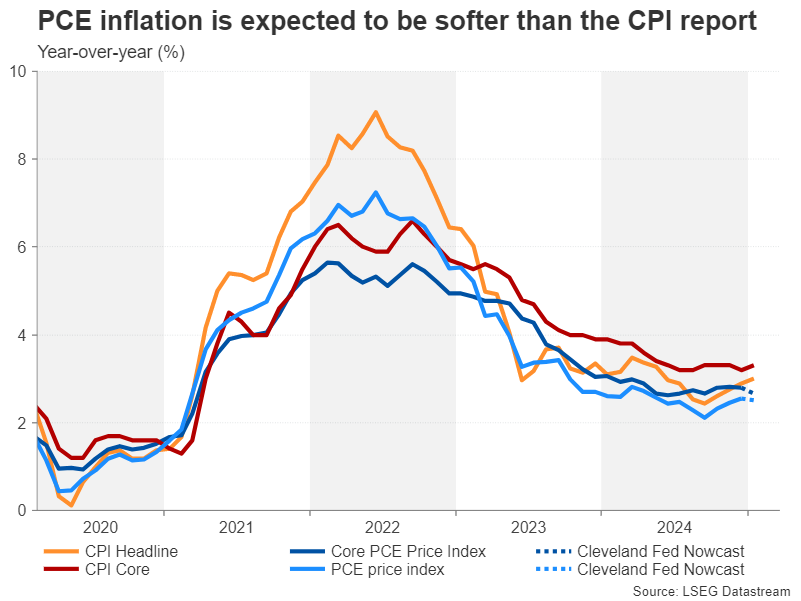
Over in the United States, sticky inflation has been an even bigger problem for the Federal Reserve. The headline rate of CPI inched up to 3.0% in January, dashing hopes for two rate cuts in 2025. But the market reaction wasn’t as negative as one would have expected, partly because investors predicted that the PCE measure of inflation, which the Fed attaches more importance to, would not be as hot as the CPI readings.
According to the Cleveland Fed’s Nowcast model, the core PCE price index eased to 2.7% in January from 2.8%, and headline PCE edged down to 2.5%. If those estimates turn out to be correct when the actual numbers are released on Friday and there are no upside surprises in the month-on-month figures, expectations for two 25-bps rate reductions could continue to recover, weighing on the US dollar.
The PCE report will also include the latest stats on personal income and consumption, while earlier in the week, there’s a slew of other releases. The Conference Board’s closely watched consumer confidence gauge is out on Tuesday, to be followed by new home sales on Wednesday. There’s a barrage of indicators on Thursday, including durable goods orders and pending home sales for January, as well as the second estimate of Q4 GDP growth.
Geopolitical risks could support the Dollar
With risk appetite remaining resilient in the face of elevated geopolitical uncertainty following President Trump’s exchange of insults with Ukraine’s President Zelensky, any signs of weakness in the US economy could again encourage investors to ratchet up their rate cut bets even if the inflation numbers don’t back it.
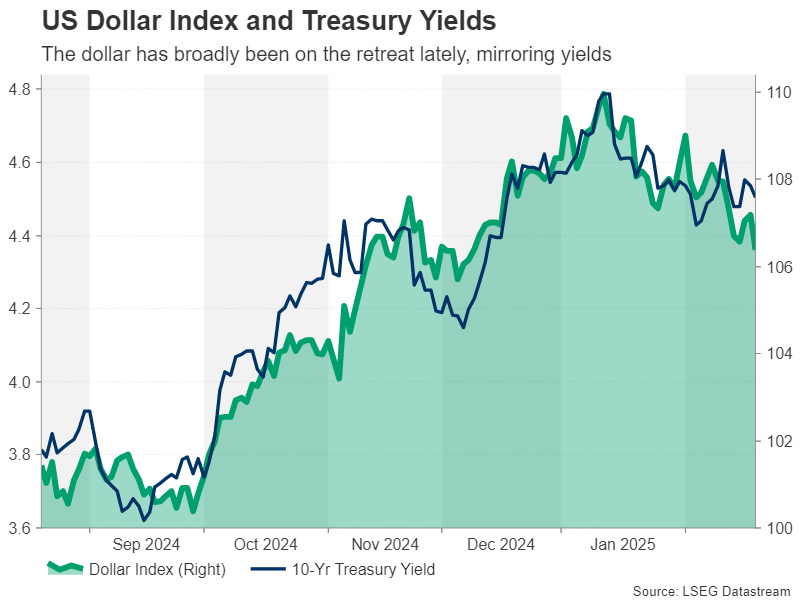
But the US dollar, which is trading near two-month lows against a basket of currencies, still stands a chance of rebounding if the geopolitical headlines worsen. Specifically, a further deterioration in the relations between Trump and Zelensky and vis-à-vis with the EU, or new tariff announcements, could redirect some flows back to the dollar.
Yen and Aussie eye CPI data, loonie awaits Canadian GDP
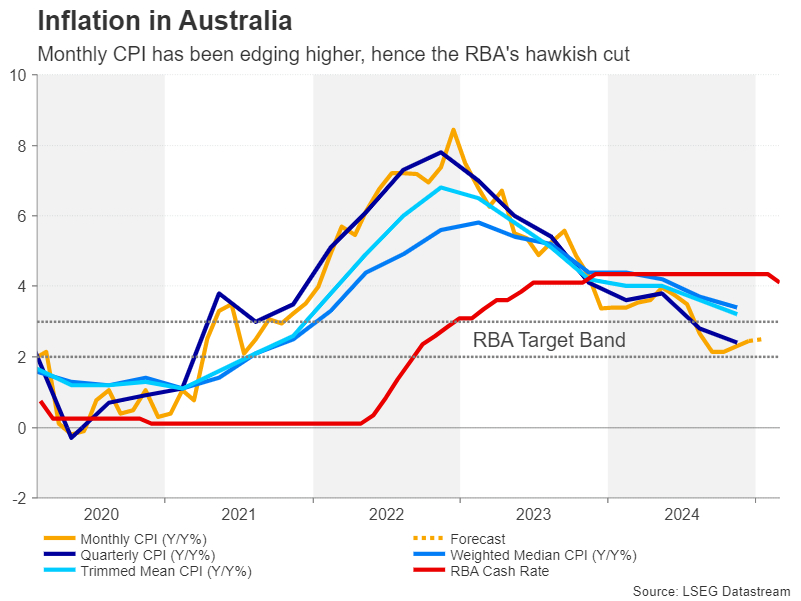
Elsewhere, it’s also all about inflation. Australia will publish its monthly CPI figures on Wednesday, which are likely to be scrutinized following the RBA’s hawkish rate cut. Although inflation in Australia fell to just 2.4% in the fourth quarter, which is well within the RBA’s 2-3% target band, the monthly pace has been accelerating lately, edging up to 2.5% in December and supporting the need for caution.
Should the January readings show a further simmering in inflation, the Australian dollar could stretch its latest rebound against the greenback, as investors further scale back their rate cut expectations for the RBA.
One central bank that’s likely to welcome strong inflation data is the Bank of Japan, as it aims to normalize monetary policy after years of stimulus. CPI measures both nationally and in the Tokyo region have been trending higher in the past three months, while the economy has been going from strength to strength. Still, investors are at the moment fully pricing in just one 25-bps rate hike for the rest of 2025 and see less than a 50% probability for a second increase.
The producer price index for services is out on Tuesday and the Tokyo CPI estimates for February will follow on Friday. Should they continue to point to a buildup of inflationary pressures, the odds for a second hike could go up, lifting the yen.
Finally, Canadian GDP figures for the fourth quarter will be watched on Friday, amid some uncertainty about the pace of further easing by the Bank of Canada. If it wasn’t for the threat of US tariffs hanging over the Canadian economy, the BoC would likely have switched to a more neutral stance by now. Nonetheless, any positive surprises in GDP growth could see the probability of the BoC keeping rates on hold at the next meeting in March increase from the current 70%, giving the loonie a leg up.
Weekly Focus – Important Euro Data Coming Up
Geopolitics dominated the news flow again this week but overall had limited market impact. The US held peace talks with Russia in Saudia Arabia leaving EU and Ukraine out of the talks. And during the week the relationship between US President Donald Trump and Ukranian President Volodymyr Zelensky clearly worsened culminating with Trump clearly putting the responsibility for the war on Ukraine and calling Zelensky a dictator in a post on Truth Social. EU leaders gathered for a crisis meeting in Paris. They expressed differing views afterwards but overall highlighted support to Ukraine, a need for big increases in defence spending and loosening budget rules to allow for this. The EU Commission has proposed to exclude military spending from budget limits.
On the tariff front Trump said he would impose tariffs starting at 25% on automobiles, pharmaceuticals and semiconductor chips, but gave no details on timing. When asked about a deal with China, he said it is 'possible', but we would not put too much into this. EU said there was 'positive momentum' towards a compromise with US.
On the data front the most interesting was euro PMIs, which disappointed slightly as composite PMI was unchanged at a low 50.2 vs. expectations of a rise to 50.5. Services was behind the weakness whereas manufacturing saw a slight increase. Euro consumer confidence rebounded from -14.2 to -13.6 in February but is still significantly lower than in October. ECB member Isabel Schnabel caught headlines by calling for a debate on a 'halt' to rate cuts. She is among the most hawkish members, though, and other members, while expressing some caution, still point to the need for continued rate cuts. A cut in March is pretty much a done deal but the debate is on what happens after that. We continue to expect ECB to cut rates down to 1.5% as we believe core inflation will fall below 2% over the summer. Markets see the bottom for ECB rates currently at 1.9% by the end of 2025. Bond yields moved a bit higher this week in response to the ECB comments as well as the outlook for more defence spending, but short end yields are still broadly moving in the same range seen for the past five months.
In the US data flow has been light. Regional surveys from Philly Fed and Empire provided little news, although an increase in the price components got some market attention. In China a private sector symposium hosted by President Xi Jinping got a lot of focus and added fuel to a strong equity rally in Chinese stocks that took off after the DeepSeek AI breakthrough in January. Chinese house prices were mixed but still point to tentative signs of stabilisation in the housing market, see also China Headlines, 19 Feb. Japanese inflation ex fresh food surprised to the upside in January rising to 3.2% y/y from 3.0% y/y underpinning our expectations of further rate hikes from Bank of Japan.
Focus the coming week will be on the first country CPIs for February from Germany, Spain, and Italy, which we expect to confirm a downward trend in inflation. German Ifo, euro negotiated wages and credit growth will also be important to gauge developments in the euro zone. In the US we get the core PCE inflation print. Finally we have German election on Sunday, see latest polls here and Research Germany - Limited economic impact from German election, 6 February.
Sunset Market Commentary
Markets
The European February composite PMI released today matched January’s 50.2 reading. That’s suggestive of near negligible output growth. Services was still the main driver but expanded at a slower pace (50.7 from 51.3). The 23-month long downturn in manufacturing eased slightly (47.3 from 46.6). France was to blame for the marginally weaker-than-expected outcome with a marked reduction in (services) business activity. German activity actually picked up to 51.0 while the rest of the euro zone posted a “solid expansion in output”. New orders decreased for the ninth month in a row with services joining manufacturing in contraction territory for the first time in three months. Employment fell faster than in January with a slight rise in services unable to compensate for a reduction of the workforce in manufacturing. The contrast (of France and Germany) with the rest of the euro area - fastest increase in five months - is once again striking. The above-average increase in input prices was the fastest since April 2023, pushing up output inflation to its highest in 10 months. Optimism for the year ahead dipped to a three-month low on weak(er) readings in Germany and France. Strong confidence was seen in the rest of the euro area.
The market reaction is a kneejerk one with the euro slipping from EUR/USD 1.05 area to an intraday low of 1.046 before paring losses to 1.048. German yields are down between 4.3 and 5.1 bps. The PMIs indeed disappointed on face value but there’s more than meets the eye. The apparent non-stop outperformance of the euro area ex. France and Germany is an important silver lining. Elevated & rising price pressures should also have protected the downside in yields (at least the front end) since it’s supporting ECB board member’s Schnabel’s case this week for a pause in the rate cutting cycle after March. The slight PMI miss therefore feels as markets looking for any excuse to hedge ahead of the German voting weekend. We expect a fiscal impulse to come from whatever coalition that eventually emerges. But the much-needed swiftness does depend on the outcome with a GroKo (CDU/CSU + SPD) offering the best chance for speedy action. Next is the Kiwi coalition (CDU/CSU + Greens), followed by the three-way Kenya coalition (all of the above parties). The performance of the far-right AfD, which is barred from joining any federal coalition, is a key risk. US PMIs disappointed to the downside with services unexpectedly dipping into contraction territory (49.7). Manufacturing improved to 51.6. US yields and the dollar dip in a first reaction.
News & Views
The Czech aggregate confidence indicator rose slightly (0.4 points) to 97.8, but subcomponents showed a divergent picture. Consumer confidence declined for the third consecutive month from 97.0 to 96.6, the lowest level in a year. Consumers expecting the overall economic situation in the country to deteriorate over the next twelve months increased for the third consecutive month, probably due global geopolitical tensions and the potential impact of US tariffs on European economies. Still the number of households assessing current financial situation as worse than in the previous year declined. Aside from today’s data, households are expected to enjoy real income growth and still low employment, which should support consumer demand. Contrary to mediocre consumer sentiment, business confidence improved to the best level since April 2023. Sentiment improved in trade, construction and even slightly in industry. However, conditions in the domestic industry remain poor, well below historic averages. The Czech koruna recently trade rather resilient with EUR/CZK holding near the lower end of the 25.00/25.45 trading range (25.08).
• The UK February composite PMI signaled another marginal rise in UK private sector output (50.5 from 50.6). Higher levels of service sector activity (51.1) helped to offset a solid reduction in manufacturing production (output 47.4 from 49.2). Sales pipelines remained subdued as total new work decreased for the third month running and at the fastest pace since August 2023. Private firms indicated a further steep decline in staffing numbers (sharpest since Nov 2020), largely in response to higher payroll costs and weak demand. Strong wage pressures meanwhile contributed to the fastest increase in average cost burdens for 21 months. S&P also commented that “The lack of growth alongside rising price pressures points to a stagflationary environment which will present a growing dilemma for the Bank of England”.
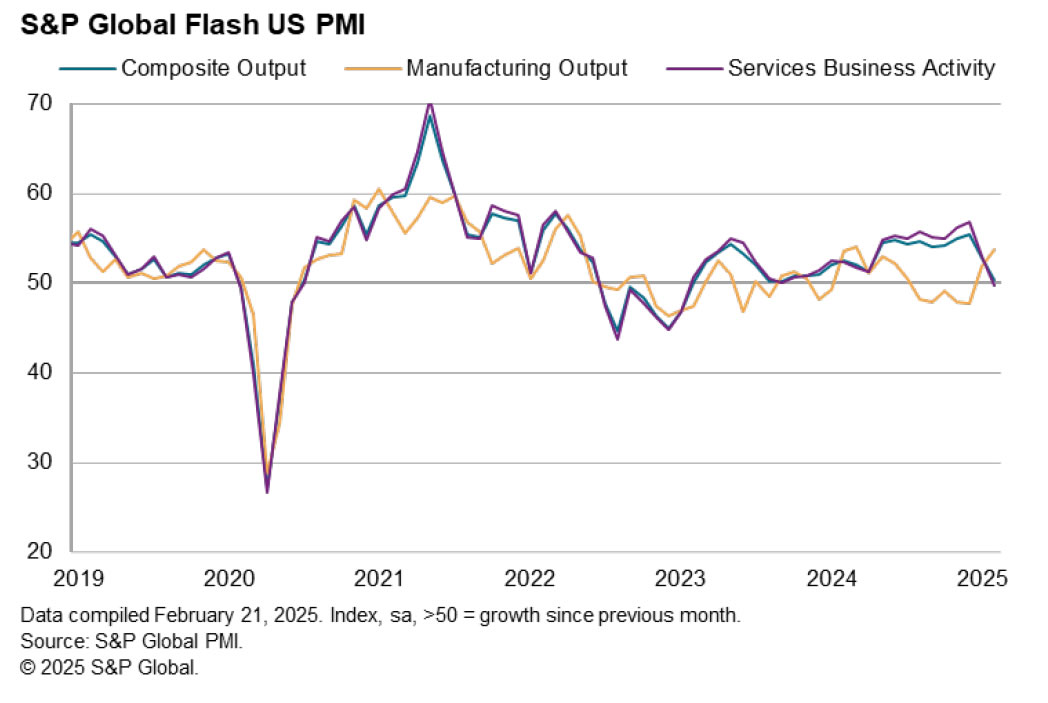
US PMI services slumps into contraction, growth outlook dims
US Manufacturing PMI rose from 51.2 to 51.6, an eight-month high. However, Services PMI dropped sharply from 52.9 to 49.7, marking a 25-month low. As a result, Composite PMI fell from 52.7 to 50.4, its lowest level in 17 months, signaling a broad slowdown in overall business activity.
Chris Williamson, Chief Business Economist at S&P Global Market Intelligence, highlighted the dramatic shift in sentiment, stating that the "upbeat mood seen among US businesses at the start of the year has evaporated," replaced by a "darkening picture of heightened uncertainty, stalling business activity, and rising prices."
Optimism for the year ahead, which had been near a three-year high, has now dropped to "one of the gloomiest since the pandemic."
Companies are increasingly concerned about the impact of federal government policies, citing spending cuts, tariffs, and geopolitical risks as key headwinds. Sales growth is reportedly slowing amid political uncertainty, while tariff-related cost increases are pushing prices higher.
Williamson added that while the PMI data last year suggested strong economic growth above 2%, February’s report signals a sharp slowdown, with annualized GDP growth now estimated at just 0.6%.
Canada: Retail Sales Jump in December, With Real Activity Reporting Its Strongest Month Since Mid-2022
Retail sales rose 2.5% month-over-month (m/m) in December, much stronger than Statistics Canada’s advance estimate of 1.6% growth.
In real terms, sales growth accelerated to 2.5% m/m, reflecting robust spending supported by the GST/HST tax break. This is the highest reading since June 2022.
Motor vehicle and parts dealers saw sales increase 1.9% m/m, building on November's strong 2.0% m/m gain. Ex-autos, sales increased 2.7% m/m, surpassing the 2.0% m/m consensus expectation.
Receipts at gas stations and fuel vendors rose by 4.2% m/m in nominal terms but only 0.7% m/m in real terms, reflecting the impact of higher fuel prices.
Excluding both auto sales and gas station receipts, core retail sales rose by 2.5% m/m in December, rebounding from a 1% decline in November.
Gains were reported across all core categories except furniture and home furnishings stores (-0.5% m/m), with food and beverage stores (+3.5% m/m) being a key driver of growth.
E-commerce sales rebounded by 3.2% m/m, recovering from a 0.7% decline last month.
Statistics Canada’s advance estimate for January suggests that sales were down 0.4% m/m.
Key Implications
Retail activity ended the year with a bang. Given the dampening effect of the GST/HST tax break on nominal figures, real sales provide a better measure of consumer activity, pointing to a swift rebound in spending behaviour. As a result, we expect consumption growth for Q4 2024 to reach around 4% (annualized), pushing GDP growth above trend.
The key question now is how long this momentum will last. Given the negative flash estimate for January, some of December's strength is likely to fade into early 2025, with consumption growth expected to slow to around 2.0% (annualized) in Q1 2025. That said, the fundamentals remain solid: steady income growth a resilient labour market, accumulated savings along with two-percentage point reduction in the overnight rate, and easing debt-servicing pressure should continue to support consumer spending. However, tariff threats pose a significant risk to this positive outlook. If they begin to erode labour market strength, consumer spending could quickly lose steam.
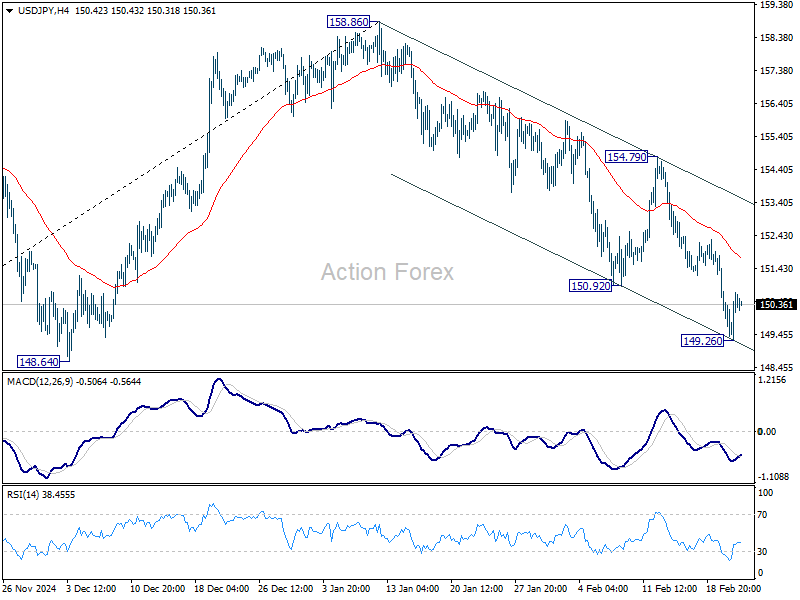
USD/JPY Mid-Day Outlook
Daily Pivots: (S1) 148.85; (P) 150.17; (R1) 150.93; More...
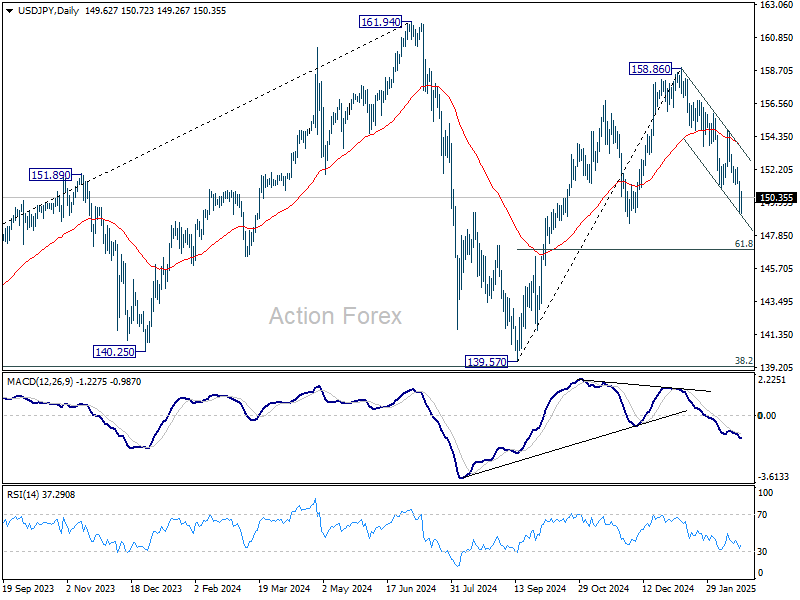
Intraday bias in USD/JPY remains neutral for consolidations above 149.26 temporary low. Outlook will stay bearish as long as 154.79 resistance holds. Fall from 158.86 is currently seen as the third leg of the pattern from 161.94 high. Break of 149.26 will target 61.8% retracement of 139.57 to 158.86 at 146.32 next.
In the bigger picture, price actions from 161.94 are seen as a corrective pattern to rise from 102.58 (2021 low). In case of another fall, strong support should be seen from 38.2% retracement of 102.58 to 161.94 at 139.26 to bring rebound. However, sustained break of 139.26 would open up deeper medium term decline to 61.8% retracement at 125.25.
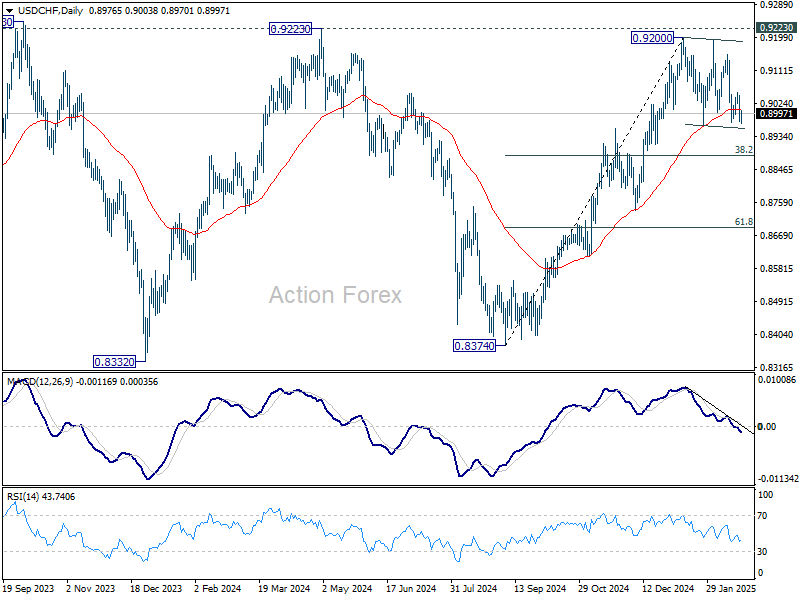
USD/CHF Mid-Day Outlook
Daily Pivots: (S1) 0.8953; (P) 0.9003; (R1) 0.9031; More…
Consolidations from 0.9200 is still in progress and intraday bias stays neutral. While deeper pull back might be seen, outlook will stay mildly bullish as long as 38.2% retracement of 0.8374 to 0.9200 at 0.8884 holds. On the upside, firm break of 0.9223 key resistance will carry larger bullish implication. However, sustained break of 0.8884 will indicate bearish reversal, and target 61.8% retracement at 0.8690 instead.
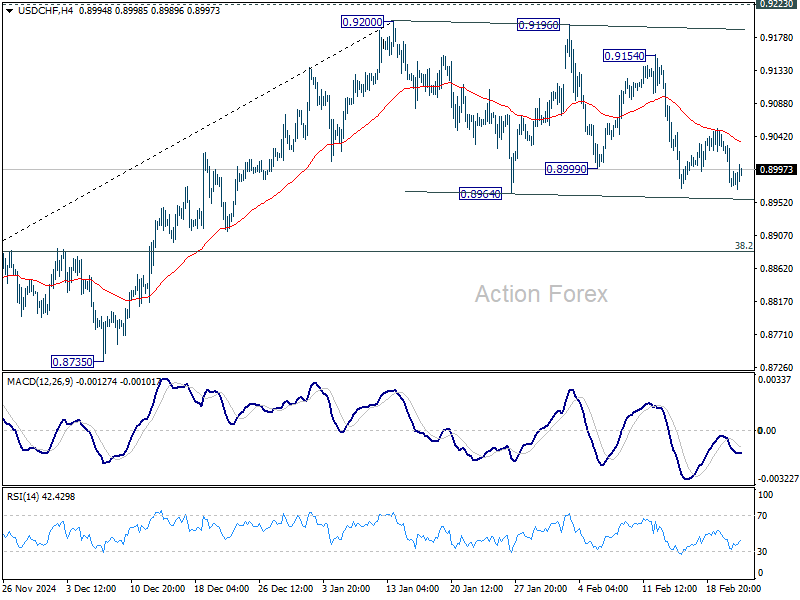
In the bigger picture, decisive break of 0.9223 resistance will argue that whole down trend from 1.0342 (2017 high) has completed with three waves down to 0.8332 (2023 low). Outlook will be turned bullish for 1.0146 resistance next. Nevertheless, rejection by 0.9223 will retain medium term bearishness for another decline through 0.8332 at a later stage.
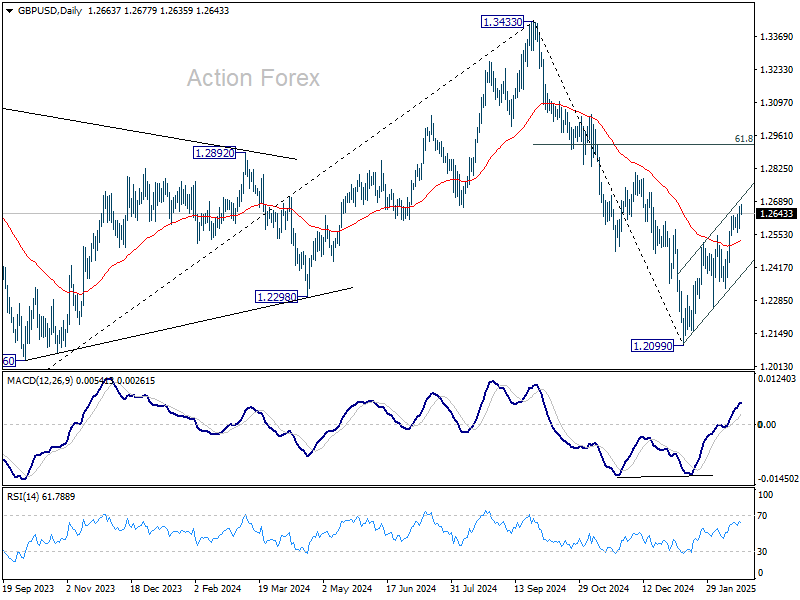
GBP/USD Mid-Day Outlook
Daily Pivots: (S1) 1.2552; (P) 1.2597; (R1) 1.2631; More...
Intraday bias in GBP/USD remains on the upside for the moment. Current rally from 1.2099 should target 1.2810 resistance. Firm break there should target 61.8% retracement of 1.3433 to 1.2099 at 1.2923 next. On the downside, below 1.2562 minor support will turn intraday bias neutral again first. But another rise will remain in favor as long as 1.2331 support holds, in case of retreat.
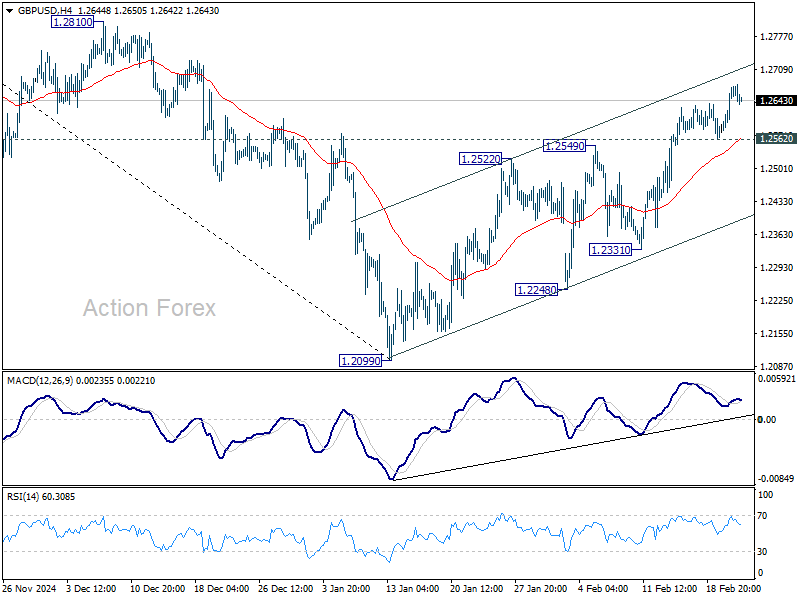
In the bigger picture, rise from 1.0351 (2022 low) should have already completed at 1.3433 (2024 high), and the trend has reversed. Further fall is now expected as long as 1.2810 resistance holds. Deeper decline should be seen to 61.8% retracement of 1.0351 to 1.3433 at 1.1528, even as a corrective move. However, firm break of 1.2810 will dampen this bearish view and bring retest of 1.3433 high instead.
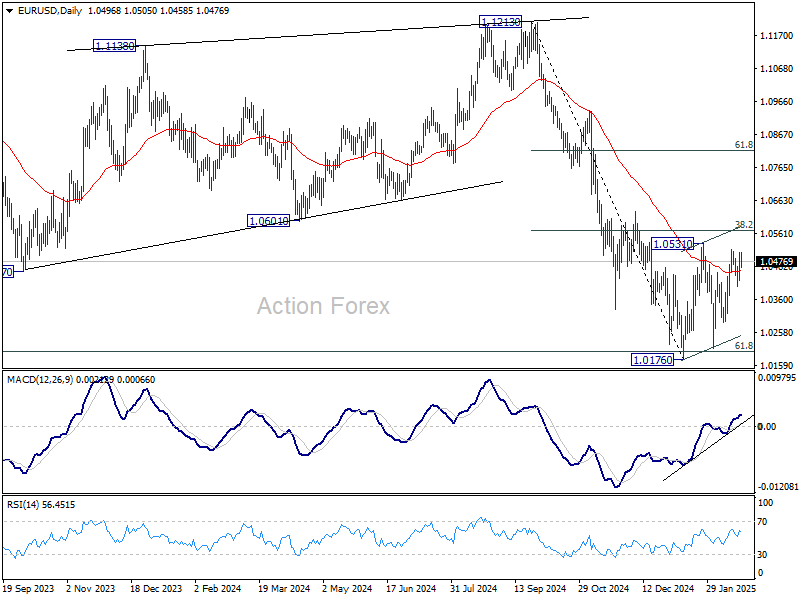
EUR/USD Mid-Day Outlook
Daily Pivots: (S1) 1.0446; (P) 1.0475; (R1) 1.0532; More...
Outlook in EUR/USD remains unchanged despite today's mild dip. Consolidation from 1.0176 is still extending and intraday bias remains neutral. Stronger rebound might be seen but outlook will remain bearish as long as 38.2% retracement of 1.1213 to 1.0176 at 1.0572 holds. On the downside, break of 1.0176 will resume whole fall from 1.1213. However, decisive break of 1.0572 will raise the chance of reversal, and target 61.8% retracement at 1.0817.
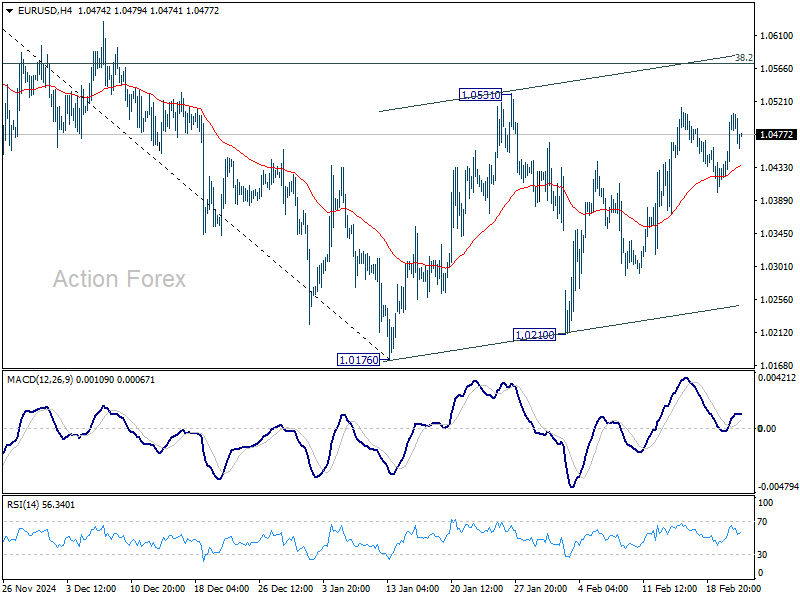
In the bigger picture, immediate focus is on 61.8 retracement of 0.9534 (2022 low) to 1.1274 (2024 high) at 1.0199. Sustained break there will solidify the case of medium term bearish trend reversal, and pave the way back to 0.9534. However, reversal from 1.0199 will argue that price actions from 1.1274 are merely a corrective pattern, and has already completed.
Euro Briefly Dips on Soft PMI, CAD Shrugs Off Robust Retail Sales
Trading is rather subdued in the forex markets today, with most major pairs and crosses stuck within yesterday’s range. Loonie failed to react to significantly stronger-than-expected retail sales data. Euro dipped earlier following weak PMI reports, but selling pressure quickly fizzled out. Yen saw some volatility during the Asian session, initially weakening alongside Japanese bond yields after BoJ Governor Kazuo Ueda’s comments, but selling was short-lived.
For the week so far, Yen remains the strongest performer, although it could now pause for consolidation after its recent rally. Sterling pound ranks second, followed by Aussie. On the weaker side, Euro has slipped to the bottom, just below Loonie and Dollar. However, the gap between the three remains tight, leaving room for shifts before the weekly close. Meanwhile, Swiss Franc and Kiwi are positioning in the middle.
In Europe, at the time of writing, FTSE is up 0.02%. DAX is up 0.29%. CAC is up 0.52%. UK 10-year yield is up 0.0044 at 4.619. Germany 10-year yield is down -0.0478 at 2.492.Earlier in Asia, Nikkei rose 0.26%. Hong Kong HSI rose 3.99%. China Shanghai SSE rose 0.85%. Singapore Strait Times rose 0.06%. Japan 10-year JGB yield fell -0.0229 to 1.428.
Canada's retail sales surge in 2.5% mom Dec, but Jan set for pullback
Canada’s retail sales jumped 2.5% mom to CAD 69.6B in December, far surpassing market expectations of 1.6% mom. Sales increased across all nine subsectors, with the strongest contributions from food and beverage retailers and motor vehicle and parts dealers.
In volume terms, retail sales also rose 2.5% mom, indicating that the increase was not solely due to price effects.
For Q4, retail sales climbed 2.4% qoq, marking the second consecutive quarterly gain. Adjusted for inflation, sales volumes rose 1.8% qoq.
However, momentum may have slowed at the start of 2025. Advance estimate for January suggests retail sales declined by -0.4% mom.
Eurozone PMI manufacturing rises to 47.3, but services falls to 50.7
Eurozone Manufacturing PMI improved from 46.6 to 47.3 in February, a nine-month high. However, Services PMI declined to 50.7 from 51.3, dragging Composite PMI flat at 50.2, indicating near stagnant overall growth.
Cyrus de la Rubia, Chief Economist at Hamburg Commercial Bank, highlighted that services sector price pressures remain elevated, creating complications for the ECB ahead of its next meeting. Persistent wage growth and rising input costs in manufacturing, driven by energy prices, add to inflationary risks.
Regionally, France’s services sector led the slowdown, with business activity deteriorating at an accelerated pace since September. In contrast, Germany maintained modest growth, supported by expectations of greater political stability ahead of its federal elections.
UK PMI composite dips to 50.5, stagflation dilemma for BoE
UK’s PMI Manufacturing dropped from 48.3 to 46.4 in February, a 14-month low. PMI Services edged up slightly to 51.1 from 50.8, while Composite PMI dipped to 50.5 from 50.6, indicating minimal overall growth.
Chris Williamson, Chief Business Economist at S&P Global Market Intelligence, noted that business activity remained "largely stalled" for the fourth straight month, with job losses accelerating amid declining sales and rising costs. He cautioned that the combination of stagnant growth and mounting price pressures is creating a "stagflationary environment," presenting a "growing dilemma" for BoE.
A primary driver of inflationary pressure is the increase in firms raising prices to offset rising staff costs tied to the National Insurance hike and minimum wage increase announced in the autumn Budget. However, these same fiscal measures have also exacerbated job cuts, with employment falling at its fastest pace since the global financial crisis, excluding the pandemic period.
UK retail sales rebound sharply by 1.7% mom in Jan
UK retail sales volumes surged 1.7% mom in January, far exceeding market expectations of 0.3% m/m, marking a strong recovery from December’s -0.6% mom decline.
This sharp rebound pushed monthly sales index levels to their highest since August 2024.
However, the broader trend remains mixed. Over the three months to January 2025, sales volumes declined by -0.6% compared to the previous three months. On a year-over-year basis, sales volumes rose 1.4%, showing some improvement in spending patterns compared to early 2024.
Despite the monthly rebound, UK retail sales volumes remain -1.3% below pre-pandemic levels from February 2020.
BoJ's Ueda pledges action against sharp JGB yield rise, Yen tumbles
Yen pulled back sharply from its recent rally, along with steep fall in 10-year JGB yield from its 15-year high. The move came after BoJ Governor Kazuo Ueda reminded markets of the central bank’s commitment to curbing excessive yield volatility.
In parliamentary comments, Ueda stated, “We expect long-term interest rates to fluctuate to some extent.”
However, he cautioned that "when markets make abnormal moves and lead to a sharp rise in yields, we are ready to respond nimbly to stabilize markets.”
The pledge to increase bond purchases, if necessary, knocked the 10-year JGB yield off its 15-year high
Ueda declined to specify when BoJ might conduct emergency bond market operations, stating only that the central bank would closely monitor the market for signs of destabilization.
Japan's core CPI jumps to 3.2% in Jan, above expectations
Japan’s inflation accelerated in January, with core CPI (ex-food) rising from 3.0% yoy to 3.2% yoy, surpassing expectations of 3.1% yoy and marking the fastest pace in 19 months, driven by higher rice and energy costs.
This was also the third consecutive month of acceleration, with core CPI rebounding sharply from 2.3% yoy in October. Inflation has now remained at or above BoJ’s 2% target since April 2022.
Core-core CPI (ex-food and energy) climbed to 2.5% yoy, up from 2.4% yoy, signaling broader price pressures beyond energy and food. Food prices, excluding perishables, surged 5.1% yoy, up from 4.4% yoy, driven by a 70.9% yoy spike in rice prices, the largest increase since data collection began in 1971. This sharp rise was attributed to supply shortages and higher production and transportation costs.
Energy prices also saw a notable increase of 10.8% yoy, up from 10.1% yoy in December, as gasoline costs rose following government subsidy reductions. Meanwhile, services inflation slowed slightly to 1.4% yoy from 1.6% yoy.
Headline CPI surged from 3.6% yoy to 4.0% yoy, a two-year high.
Japan’s PMI improves, but business confidence hits lowest since 2021
Japan’s PMI data for February showed slight improvements, with PMI Manufacturing rising from 48.7 to 48.9. Meanwhile, PMI Services edged up from 53.0 to 53.1. Composite PMI increased from 51.1 to 51.6, the highest in five months.
According to Usamah Bhatti, Economist at S&P Global Market Intelligence, the "modest improvement" was driven by sustained growth in services, with firms crediting business expansion plans and improved sales.
However, optimism about future business activity weakened, with confidence dropping to its lowest level since January 2021. Companies cited labor shortages, persistent inflation, and weak domestic economic conditions as major concerns.
Employment growth slowed to its weakest pace in over a year, reflecting businesses’ caution about hiring amid economic uncertainty. Additionally, input price inflation remained elevated, similar to January’s historically high levels.
RBA’s Bullock: More rate cuts possible, but patience needed
At a parliamentary committee hearing today, RBA Governor Michele Bullock explained that this week’s 25bps rate cut was based on better-than-expected inflation data, weaker private demand, and wage growth aligning with forecasts.
Also, she acknowledged that the board is mindful of timing, stating, “What’s also playing on the board’s mind is that the board also doesn’t want to be late, and arguably we were late raising interest rates on the way up.”
While further easing remains on the table, Bullock emphasized the need for caution. "We are not pre-committed. We're going to be data-driven on this and I think people just have to be patient," she added.
Deputy Governor Andrew Hauser echoed this sentiment, reinforcing the RBA’s wait-and-see approach. He remarked, "If we're wrong and inflation moves more quickly downwards, you could celebrate that fact and policy will need to respond, but we'd rather wait and see than assume that's what's going to happen."
Australia’s PMI composite hits 6-month high, but business confidence dips
Australia’s PMI data for February showed continued expansion in private sector activity, with Manufacturing PMI rising to from 50.2 to 50.6, its highest level in 27 months. Meanwhile, Services PMI edged up from 51.2 to 51.4, and Composite PMI ticked up from 51.1 to 51.2, both reaching six-month highs.
According to Jingyi Pan, Economics Associate Director at S&P Global Market Intelligence, the latest figures indicate a “modest” but steady improvement in economic conditions, while growth was broad-based.
However, business sentiment weakened to its lowest level since October 2024. This caution also affected pricing strategies, with businesses reluctant to fully pass on cost increases, leading to a slowdown in selling price inflation.
RBNZ’s Conway: 50bps cut the clear choice, signs of economic turnaround emerging
RBNZ Chief Economist Paul Conway revealed in a Reuters interview that the central bank considered both 25bps and 75bps rate cuts ahead of this week's policy decision. But the bank ultimately concluded that a 50bps reduction “was the way to go” given the state of the economy and inflation.
Conway pointed to recent data in manufacturing and services, indicating that some businesses may already be "starting to feel a bit of a turnaround." However, he acknowledged that companies remain cautious.
Regarding the labor market, Conway noted that employment trends typically lag economic activity. He added that"businesses need to have confidence that growth is returning and that growth will be sustained into the future before they start to think about employing someone.”
EUR/USD Mid-Day Outlook
Daily Pivots: (S1) 1.0446; (P) 1.0475; (R1) 1.0532; More...
Outlook in EUR/USD remains unchanged despite today's mild dip. Consolidation from 1.0176 is still extending and intraday bias remains neutral. Stronger rebound might be seen but outlook will remain bearish as long as 38.2% retracement of 1.1213 to 1.0176 at 1.0572 holds. On the downside, break of 1.0176 will resume whole fall from 1.1213. However, decisive break of 1.0572 will raise the chance of reversal, and target 61.8% retracement at 1.0817.
In the bigger picture, immediate focus is on 61.8 retracement of 0.9534 (2022 low) to 1.1274 (2024 high) at 1.0199. Sustained break there will solidify the case of medium term bearish trend reversal, and pave the way back to 0.9534. However, reversal from 1.0199 will argue that price actions from 1.1274 are merely a corrective pattern, and has already completed.