Sample Category Title
Global Stocks Under Pressure As Bitcoin Hits Another Record
Global equity bulls were nowhere to be found during Tuesday’s trading session as market players evaluated the possible impact of proposed US tax cuts. World stocks were mostly lower amid a global technology selloff, with the lack of appetite for riskier assets punishing European shares and Wall Street.
Asian markets stumbled lower during early trading on Wednesday, following Wall Street’s overnight decline. With the renewed Brexit uncertainty likely to tarnish risk sentiment further, European stocks remain vulnerable to further downside. American shares are still at risk of extending losses this afternoon, if concerns heighten over a potential US government shutdown on Friday if a spending bill is not approved.
US ADP NFP report in focus
The Greenback edged slightly lower against a basket of major currencies on Wednesday, ahead of the US ADP private sector jobs data for November.
It is becoming increasingly clear that the Dollar remains highly sensitive to the progress on tax reform legislation and this is reflected in price action. Although, Senate passed its version of the tax bill over the weekend, investors remain cautious as the Senate and the House of Representatives still need to reconcile their differences and agree on a final bill to send to Donald Trump.
Focusing on today, the ADP NFP will be in the spotlight with economists forecasting a 189k rise in the month of November. Dollar bulls seem to be in need of fresh inspiration and this could come in the form of a solid ADP print this afternoon. Technical traders will continue to observe how the Dollar Index behaves below 93.50. A breakout above 93.50 may encourage a further incline higher towards 93.80. Alternatively, a failure for prices to break above 93.50 could open a path back towards 93.00.
Bitcoin does it again…
Bitcoin displayed its brawn and unyielding resilience to financial market volatility on Wednesday as prices marched to fresh record highs above $12300.
The CBOE Global Markets and CME group have fuelled investor attraction and legitimisedBitcoin’s investment profile by planning to launch futures that trackthe cryptocurrency. The explosively bullish price action is likely to continue attracting investors from all directions and as such this has the ability to support further upside. Although Bitcoin has appreciated by a mind-bending 1100% since the beginning of the year, bulls seem far from tired with the next technical level of interest at $12500.
XAUUSD Intraday Analysis
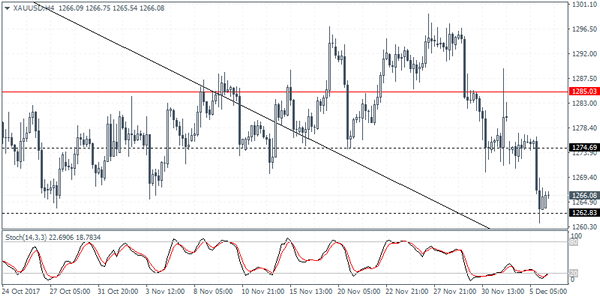
XAUUSD (1266.08): Gold prices extended the declines as price action fell to the 1262 level of support as noted in yesterday's commentary. With price action retesting this support level, the daily chart shows a potential descending triangle pattern shaping up. A break down below 1262 could signal further declines in the precious metal. Alternately, if gold prices manage to rebound off the support, the gains are limited to the 1274.70 level of resistance.
USDJPY Intraday Analysis
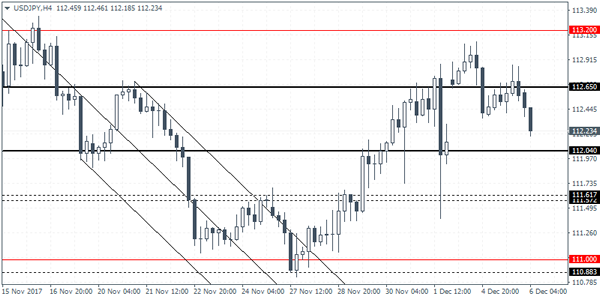
USDJPY (112.23): The USDJPY attempted to push higher but price action closed with an inside bar on the daily session. The current downside breakout could signal a near term decline if the U.S. dollar manages to close bearish. In the short term, the currency pair could be seen falling back to 112.04 level of support. This marks a retest of the support level while also filling the gap from Monday's open. The overall bias remains flat as we expect USDJPY to remain supported near 112.04. A breakout from the 112.65 and 112.04 region will potentially pave way for further gains or declines.
EURUSD Intraday Analysis
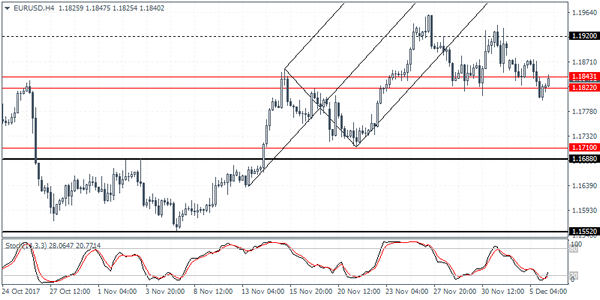
EURUSD (1.1840): The EURUSD closed on a bearish note yesterday as price action formed a bearish engulfing pattern on the daily session. The gradual decline could see further downside momentum building up ahead of this Friday's nonfarm payrolls report. After briefly slipping below 1.1822, the euro currency managed to rebound to trade back in the support zone of 1.1843 and 1.1822. However, we expect this rebound to be short lived. Failure to close above the support zone could pave way for EURUSD to post declines to the next lower support seen at 1.1710 - 1.1688.
U.S. Dollar Maintains Gains For A Second Day
The U.S. dollar was seen strengthening for a second day fueled by the optimism from the tax cuts. The dollar maintained gains despite the ISM's non-manufacturing PMI coming out weaker than expected. Non-manufacturing activity was seen falling to 57.4 in November which was below forecasts and weaker than October's print.
Earlier today, the Australian quarterly GDP data showed that the economy posted a growth rate of 0.6% on the quarter. This was below forecasts of a 0.7% increase. The second quarter GDP was revised higher to show a 0.9% increase.
Looking ahead, German factory orders and Swiss inflation data will be released. The NY trading session will see the release of the ADP private payroll numbers. Forecasts point to a 189k headline print.
The Bank of Canada will be holding its monetary policy decision later today. No changes are expected as the central bank is seen keeping rates steady at 1.0%. The central bank was seen hiking rates twice this year.
Forex Technical Analysis: EUR/USD, USD/JPY, GBP/USD
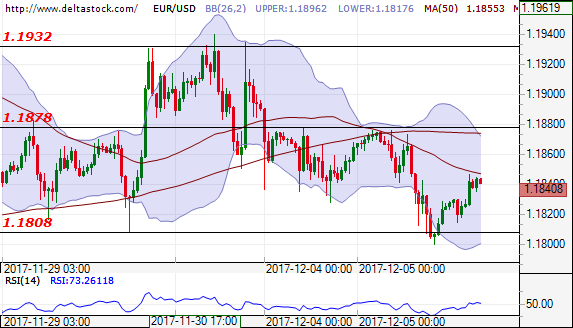
EUR/USD
Current level - 1.1840
After the unsuccessful test for breakthrough the support level at 1.1808, the forecast is positive for test of the resistance level at 1.1878. After that the next resistance will be at 1.1932.
| Resistance | Support | ||
| intraday | intraweek | intraday | intraweek |
| 1.1878 | 1.2090 | 1.1808 | 1.1690 |
| 1.1932 | 1.2090 | 1.1808 | 1.1550 |
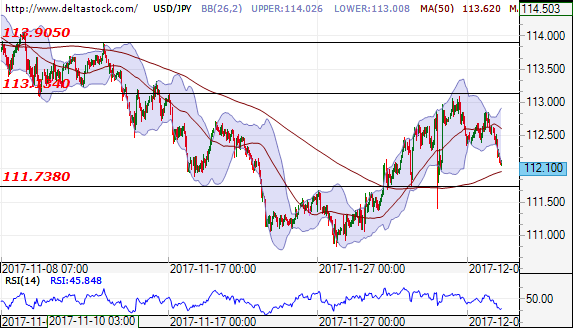
USD/JPY
Current level - 112.10
After the test of the resistance level at 113.13 and the unsuccessful breakthrough, the outlook is negative for test of the support level at 111.73. The next support will be at 111.00.
| Resistance | Support | ||
| intraday | intraweek | intraday | intraweek |
| 113.15 | 113.90 | 111.73 | 109.50 |
| 113.90 | 114.70 | 109.50 | 107.30 |
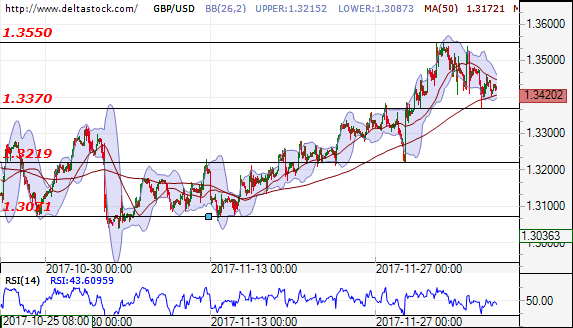
GBP/USD
Current level - 1.3420
Although the unsuccessful breakthrough of the support level at 1.3370, the forecast is still negative for new test at the same level. Next support will be 1.3219. In positive direction the resistance is at 1.3550.
| Resistance | Support | ||
| intraday | intraweek | intraday | intraweek |
| 1.3550 | 1.3460 | 1.3370 | 1.3220 |
| 1.3623 | 1.3660 | 1.3219 | 1.3020 |
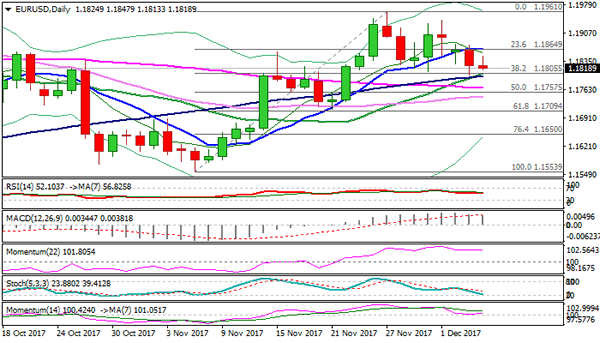
Technical Outlook: EURUSD – Close In The Cloud Was Bearish Signal But Confirmation Needs Break Below A Cluster Of...
The Euro remains in red and holding in the daily cloud on Wednesday. Bearish signal was generated on Tuesday's dip to 1.1800 which cracked Fibo 38.2% support at 1.1805 and close below cloud top (1.1833).
Near-term bias is negative, however, overall bullish structure is expected to remain intact while the price holds above a cluster of daily MA's between 1.1803 and 1.1767.
Formation of 20/100SMA bull-cross is expected to underpin and the pair may hold in extended consolidation between 20SMA (1.1803) and cloud top (1.1833).
Lift above cloud top would ease bearish pressure, but break above 10SMA (1.1866) is needed to neutralize and shift near-term focus higher.
Bearish scenario requires break below 1.1800 zone (20/100SMA's) and 1.1767 (55SMA) to generate fresh bearish signal and risk extension towards cloud base (1.1721).
Res: 1.1833, 1.1866, 1.1878, 1.1917
Sup: 1.1800, 1.1767, 1.1757, 1.1721
EUR/USD Candlesticks and Ichimoku Analysis
Weekly
• Last Candlesticks pattern: Shooting star
• Time of formation: 31 Jul 2017
• Trend bias: Near term up
Daily
• Last Candlesticks pattern: Shooting star
• Time of formation: 2 Aug 2017
• Trend bias: Up
EUR/USD – 1.1817
Although the single currency rebounded to 1.1940, renewed selling interest emerged there and euro has slipped again, suggesting further consolidation below recent high of 1.1961 would be seen and test of the Kijun-Sen (now at 1.1758) cannot be ruled out, however, a daily close below support at 1.1713 is needed to signal the rebound from 1.1554 has ended, bring further fall to 1.1650-60, then towards 1.1600 but said support at 1.1554 should remain intact.
On the upside, whilst recovery to the Tenkan-Sen (now at 1.1881) cannot be ruled out, reckon upside would be limited to 1.1900 and bring another decline to aforesaid downside targets. Above said resistance at 1.1940 would risk retest of last week’s high at 1.1961 but only break there would signal the rise from 1.1554 is still in progress and extend gain to 1.2005. Looking ahead, above there would confirm recent upmove has resumed for retest of 1.2093, break there would extend the rise from 1.0340 low to 1.12150-55 first.
Recommendation: Sell at 1.1880 for 1.1680 with stop above 1.1980.
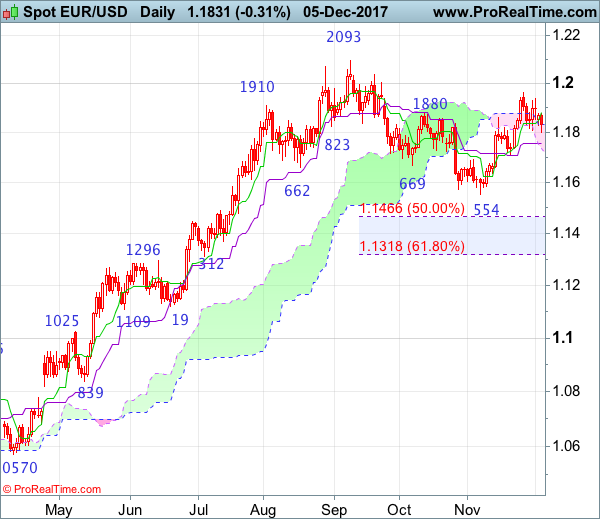
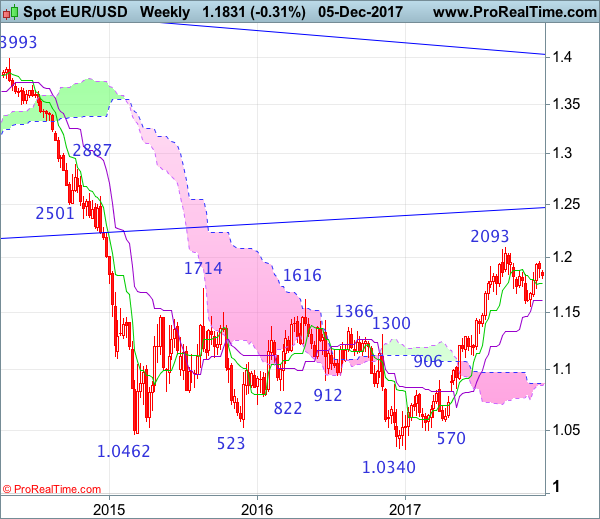
On the weekly chart, although euro rose to as high as 1.1961 early last week, the subsequent retreat together with the gap-down opening this week suggest consolidation below this level would be seen and test of the Tenkan-Sen (now at 1.1758) cannot be ruled out, however, a weekly close below support at 1.1713 is needed to signal the rebound from 1.1554 has ended, bring weakness to 1.1650-60, then towards said support at 1.1554 which is likely to hold from here. A drop below said support at 1.1554 would signal a temporary top has been formed at 1.2093, bring retracement of recent rise to 1.1500, then 1.1466 (50% Fibonacci retracement of 1.0839-1.2093) but reckon downside would be limited to 1.1400 and 1.1312-18 (previous support and 61.8% Fibonacci retracement) should hold, price should stay above previous minor resistance at 1.1296, bring another rebound.
On the upside, expect recovery to be limited to 1.1880-85 and resistance at 1.1940 should hold, bring another retreat. Above said resistance at 1.1961 would revive bullishness and signal early pullback from 1.2093 has ended at 1.1554, bring further gain to 1.2005, once this level is penetrated, this would confirm early rise from 1.0340 low has resumed for retest of 1.2093, above there would extend headway to 1.2150-55, then 1.2200-10 later.
Trade Idea : USD/CHF – Buy at 0.9820
USD/CHF - 0.9879
Most recent candlesticks pattern : N/A
Trend : Near term up
Tenkan-Sen level : 0.9870
Kijun-Sen level : 0.9863
Ichimoku cloud top : 0.9845
Ichimoku cloud bottom : 0.9803
Original strategy :
Buy at 0.9795, Target: 0.9895, Stop: 0.9760
Position : -
Target : -
Stop : -
New strategy :
Buy at 0.9820, Target: 0.9920, Stop: 0.9785
Position : -
Target : -
Stop : -
As the greenback has continued trading with a firm undertone after staging a strong rebound from 0.9735 (last Friday’s low), adding credence to our view that a temporary low has been formed there and consolidation with upside bias remains for this move to bring at least a strong retracement of recent decline to 0.9900 and later towards resistance at 0.9947.
In view of this, we are looking to buy dollar on dips as 0.9820-25 should limit downside and bring another rebound. Below 0.9790 would defer and risk weakness to 0.9755-60 but still reckon said last week’s low at 0.9735 would remain intact.

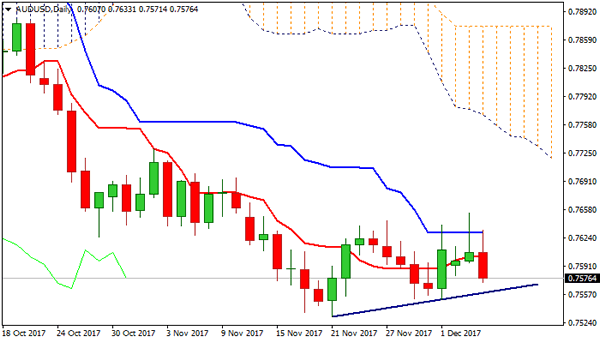
Technical Outlook: AUDUSD – Shooting Star Warns Of Reversal
The Aussie dollar stands at the back foot on Wednesday and dipped to session low at 0.7571 after Australian GDP fell below forecast in Q3. Overnight's action was capped by daily Kijun-sen (0.7630) which marks solid resistance ahead of yesterday's upside rejection at 0.7653 (Fibo 61.8% of 0.7729/0.7530). Tuesday's Shooting star candlestick indicates reversal which needs firm break below 0.7577 (Fibo 61.8% of entire recovery from 0.7530) for confirmation. Bull-trendline off 0.7530 (21 Nov low) marks another pivotal support at 0.7558 and break here to confirm an end of corrective phase and open way for retest of key support at 0.7530.
Res: 0.7602, 0.7630, 0.7653, 0.7691
Sup: 0.7571, 0.7558, 0.7530, 0.7500