Sample Category Title
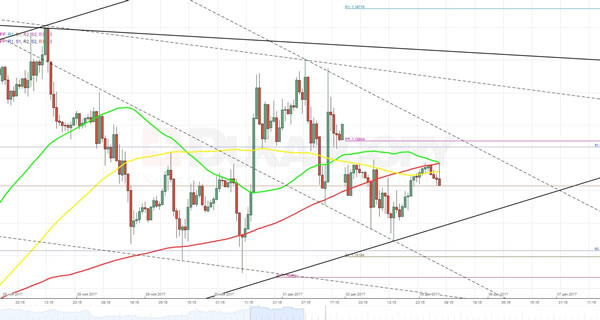
USD/JPY Elliott Wave Analysis
USD/JPY - 112.50
USD/JPY – Wave V of larger degree circle V has possibly ended at 75.31 and major correction has commenced and already met indicated target at 125.00.
Dollar found renewed buying interest at 111.41 on Friday and has staged a strong rebound, dampening our bearishness and suggesting low has been formed at 110.84 last week, hence consolidation with upside bias is seen for gain to 113.10-15, then 113.30-35, however, a daily close above resistance at 113.91 is needed to signal the pullback from 114.74 has ended, bring further rise to 114.30-35, then retest of said recent high which is likely to hold from here.
Our preferred count is that, triangle wave IV (with circle) ended at 101.45 and the circle wave V brought dollar down to the record low of 75.31 in 2011 and the subsequent rebound signal major correction has commenced with A leg ended at 84.19, followed by wave B at 77.14 and impulsive wave C is now unfolding (indicated upside target at 125.00 had been met) for gain towards 127.00 level. In the event dollar drops below support at 99.01, this would confirm medium term decline from 125.86 top (2015 high) has resumed for subsequent weakness to 98.00 and possibly 97.00.
Under this count, this wave C is unfolding as impulsive waves with (1) (2), 1 2 ended at 80.67, 79.07, 82.84 and 81.69 respectively, hence the extended wave 3 has ended at 103.74 and wave 4 correction of recent upmove should bring weakness to 92.57, then towards 90.88 but psychological support at 90.00 should limit downside and bring another rally later in wave 5, indicated target at 125.00 had been met and gain to 127.00 cannot be ruled out but reckon price would falter below 130.00.
On the downside, whilst initial pullback to 112.00 cannot be ruled out, reckon said Friday’s low at 111.41 would remain intact and bring another rebound later. A drop below this support would suggest the rebound from 110.84 has ended, then retest of this support would follow, a drop below this level would revive bearishness and extend the fall from 114.74 top to 110.50, then 110.00, however, near term oversold condition should prevent sharp fall below support at 109.55 and reckon 109.00 would hold from here, risk from there is seen for another rebound to take place later.
Recommendation: Exit short entered at 112.50 and stand aside for this week.
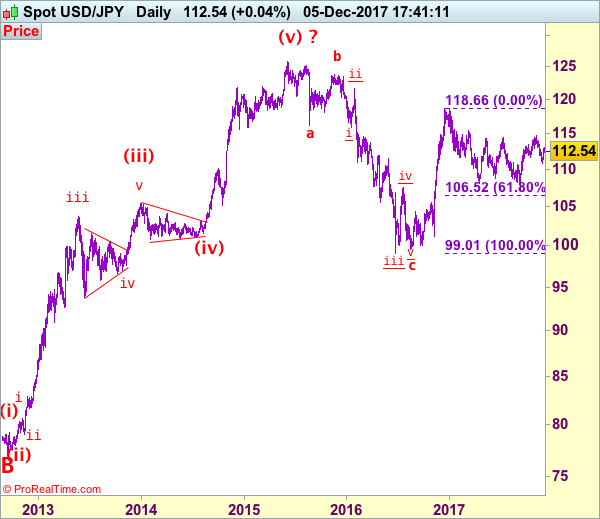
On the monthly chart, we have changed our preferred count that an impulsive wave is unfolding with major wave III with circle ended at 79.75, then followed by wave IV with circle and is labeled as a triangle with A: 147.64 (11 August, 1998), B: 101.25, C: 135.20, D: 101.67 and E leg ended at 124.14 to end the wave IV with circle. Hence, wave V with circle commenced from there and hit a record low of 75.31, however, the subsequent strong rebound signals this circle wave V has possibly ended there, hence gain to (indicated upside target at 122.00 and 125.00 had been met), the retreat from 125.86 suggests wave A of major correction has ended there and wave B correction back to 99.00, then 95.00 would be seen, however, reckon downside would be limited to 90.00, bring another rebound in wave C next year.
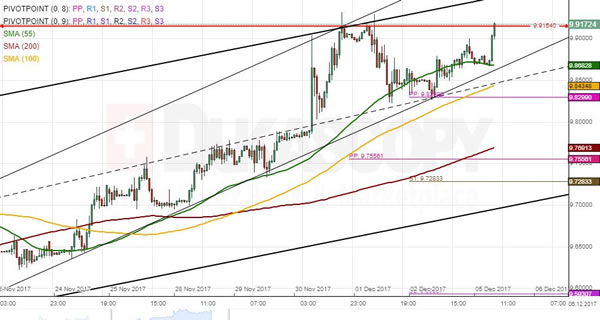
XAU/USD Analysis: Moves Horizontally Near 1,276
As it was anticipated, yesterday’s trading session the exchange rate spent in a flat movement between support and resistance zones located at the 1,270 and 1,275 marks. As long as there are no substantial news coming from the United States, the pair is not expected to jump above the 1,280.42 level that represents location of the monthly PP and the 100-hour SMA. The similar assumption holds for the 1,270.00 mark that is crossed by the bottom boundary of a dominant ascending channel. In larger perspective it is still unclear whether the above dominant pattern will sustain or it will be broken amid the pressure from a medium-term descending channel. Most probably until the market sentiment turns bearish the rate will manage to keep gradual advance.
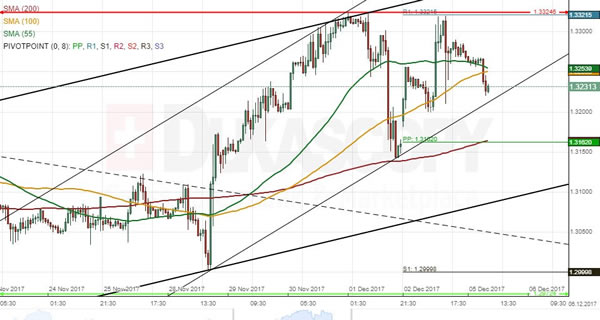
USD/JPY Analysis: Meets Strong Resistance At 113.00
As it was suggested yesterday, the currency exchange rate made a fully-fledged breakout from a rising wedge formation after encountering resistance posed by the 50% Fibonacci retracement level at 113.00. However, the plunge was not deep, as southern side was secured by two moving averages and another 50% retracement level located at 112.45. As long as there are no disappointing political news coming from the United States, the rate is projected to keep climbing back to the 113.00 mark. But before that it might be temporarily stopped by the monthly PP at 112.70. Nevertheless, the rising 55- and 100-hour SMA are expected to continue stimulating the upwards movement and simultaneously secure the bottom boundary of a currency active junior ascending channel.
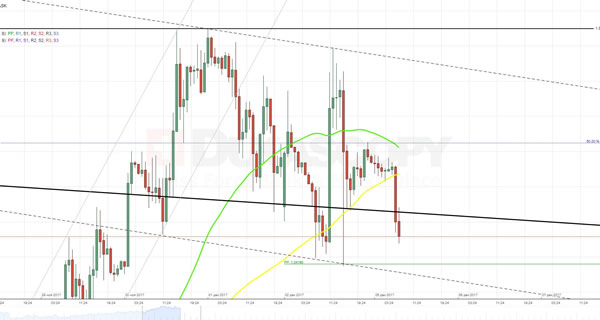
Trade Idea: EUR/JPY – Stand aside
EUR/JPY - 133.35
New strategy :
Stand aside
Position: -
Target: -
Stop:-
Despite staging a rebound from 132.91 to 134.05 (yesterday’s high), lack of follow through buying and the subsequent retreat suggest further choppy trading would be seen and weakness towards said support at 132.91 cannot be ruled out, however, break there is needed to signal a temporary top has been formed at 134.38, bring retracement of recent rise to 132.65 and later towards 132.00-10 but support at 131.72 should remain intact.
On the upside, expect recovery to be limited to 133.75 and said resistance at 134.05 should remain intact, bring further choppy trading. Only a daily close above yesterday’s high at 134.05 would revive bullishness and signal the retreat from 134.38 (last week’s high) has ended, bring retest of this level later, above there would bring test of strong resistance at 134.50 but only break there would retain bullishness and extend gain to 135.00-10 first.
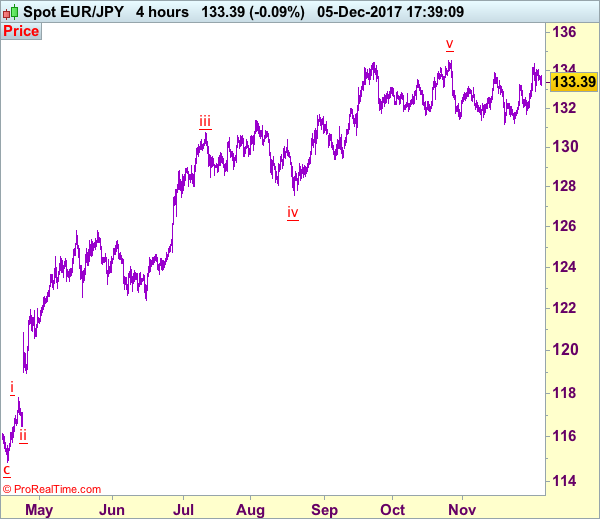
Our latest preferred count is that wave (ii) is ABC-X-ABC which ended at 123.33 and wave (iii) is unfolding with wave iii ended at 100.77, followed by wave iv at 111.57 and wave v as well as the wave (iii) has ended at 97.04, followed by wave (iv) at 111.43 and wave (v) has ended at 94.12 which is also the end of the larger degree v, this also implied the major wave (C) has also ended there, hence major correction has commenced from there with (A) leg unfolding in its lower degree wave c which has possibly ended at 145.69. Under this count, A-B-C wave (B) has commenced with A leg ended at 136.23, wave B at 143.79 and wave C has possibly ended at 149.79.
Our larger degree count is that the decline from 139.26 is wave (C) and is sub-divided into a diagonal triangle i-ii-iii-iv-v with wave i - 105.44, wave ii- 123.33, wave iii - 97.03, wave iv - 111.43, followed by the final wave v as well as the end of wave (C) at 94.12, this also mark the bottom of larger degree wave B. Under this count, major rise in wave C has commenced as an impulsive wave with minor wave III ended at 145.69, wave V is still in progress for further gain to 150.00. Having said that, this so-called wave V could well be the first leg of larger degree 5-waver wave C and this wave C should bring at least a retest of wave A top at 169.97 (July 2008).
GBP/USD Analysis: Jumps Up And Down From Political News
In general, previous trading session the currency rate spent moving downwards, as expected. Apart from rebound from the two month maximum at 1.3550, the drop was driven by anxiety over affirming vote on tax bill as well as new report that no agreement on Brexit has been reached yet. From technical point of view, today the pair is squeezed between the 50% Fibonacci retracement level, the 55- and 100-hour SMAs from the top and the weekly PP plus the 200-hour SMAs from the bottom. These boundaries point out of further correction of the cable. Theoretically, one of the scheduled data releases for today might stimulate the rate to make a breakout. However, this scenario seems unlikely, as markets are mainly focused on political news
USD/CHF Candlesticks and Ichimoku Analysis
Weekly
• Last Candlesticks pattern: Shooting star
• Time of formation: 7 Mar 2017
• Trend bias: Sideways
Daily
• Last Candlesticks pattern: Morning star
• Time of formation: 9 May 2017
• Trend bias: Near term up
USD/CHF – 0.9859
The greenback only slipped to as low as 0.9735 last week before staging the anticipated rebound (we recommended in our previous update to buy at 0.9730 and just missed our long entry), suggesting consolidation above this level would be seen and test of the Kijun-Sen (now at 0.9887) is likely, however, a sustained breach above this level is needed to signal low has been formed there, bring a stronger rebound to 0.9950-55, once this level is penetrated, this would signal the fall from 1.0039 has ended at 0.9735, bring test of indicated resistance at 1.0018, above there would provide confirmation and bring retest of this level first.
On the downside, expect pullback to be limited to 0.9800-10 and bring another rebound to aforesaid upside targets. Only a drop below said support at 0.9735 would abort and signal top has been formed at 1.0039 earlier, bring retracement of recent upmove from 0.9421 to minor support at 0.9670, then 0.9642 (another support) but reckon downside would be limited to 0.9590-00 and support at 0.9565 should remain intact.
Recommendation: Buy at 0.9810 for 1.0000 with stop below 0.9730.
On the weekly chart, although dollar fell to as low as 0.9735 late last week, the greenback found decent demand there and has staged a strong rebound, the pair opened higher this week and test of resistance at 0.9882 is likely break there would extend gain to 0.9947-50 but a weekly close above there is needed to signal the pullback from 1.0039 has ended, bring a test of 0.9987, break there would signal upmove has resumed for retest of 1.0039, above there would extend the rise from 0.9421 low to previous resistance at 1.0100-08, having said that, overbought condition should prevent sharp move beyond previous resistance at 1.0171 and 1.0200-10 should hold from here.
On the downside, although initial pullback to 0.9800-10 cannot be ruled out, price should stay well above support at 0.9730-35 and bring another rise later. A weekly close below there would defer and signal top is formed instead, this also suggest first leg of rebound from 0.9737 has ended and bring weakness to 0.9690-00, however, reckon support at 0.9642 would limit downside and price should stay above support at 0.9565 and the greenback shall stage another strong rebound next month.
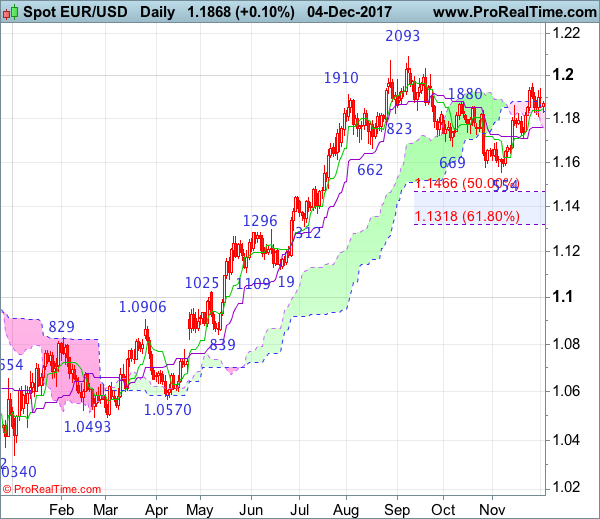
EUR/USD Analysis: Still Trades Near 1.1870
Despite positive sentiment related to successful vote on tax bill by the US Senate, the pair both started and ended the day near the 1.1870 mark. The reason for that is related to combined resistance formed by the 55-, 100- and 200-hour SMAs and support provided by the lower trend-line of a one-month long ascending channel. Unless the rate receives an impulse from some fundamental event, such as the Non-Manufacturing PMI data release, it is likely to spend another day in a similar horizontal movement. Apart from that, there is a need to take into account two additional junior descending channels. It is highly possible that their framework taken together with the above technical indicators will create a bearish pressure strong enough to dissolute the ascending channel eventually.
EUR/NOK 1H Chart: Euro Points To Weakness
The common European currency has been appreciating against the Norwegian Krone in an ascending since late September. This pattern has guided the pair up to the 9.9154 mark—its highest level during the past several years. Apart from this channel, the pair is likewise trading in a junior one valid since November 21. Its slope is relatively steep; however, as apparent on the chart, the Euro has failed to initiate a solid wave up. This might suggest that a change in the bullish sentiment might occur soon. This assumption is likewise supported by technical indicators. In terms of support, the pair might hinder near the 9.75 area near where the monthly PP, the 200-hour SMA and the weekly S1 are located.
GBP/CHF 1H Chart: Pair Tests 2017 High
Following a steady increase in price since late August, GBP/CHF has entered a six-week period of consolidation. As a result, the Pound has been fluctuating against the Swiss Franc in the 1.3325/1.2972 range. The pair tested the former barrier two times during the past two trading sessions. Technical indicators suggest that the same scenario might occur today, as well. However, given that this level is a 2017 high, it might provide strong resistance, especially when reinforced by the weekly R1. Conversely, it is also possible that the Pound falls down to the weekly PP and the 200-hour SMA circa 1.3160 prior to re-testing the aforementioned high. By and large, it is expected that the pair moves lower in the medium term, possibly down to the 1.2972 area.
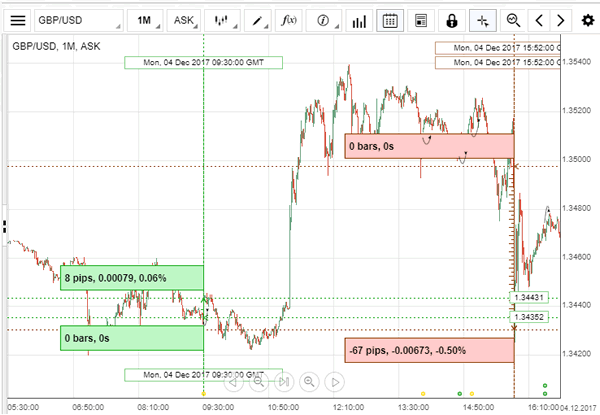
GBP/USD: UK Construction PMI
The British Pound was slightly higher against the US Dollar on the release showing stronger activity in the country's construction sector. The GBP/USD added 8 base points to keep appreciating up to the 1.3500 level, though the pair was hit strongly as the BBC said not to anticipate deal to be reached from Brexit negotiations on Monday.
Housebuilding in the UK stimulated activity in the country's construction industry in November, compensating weakness in other parts of mostly downbeat sector. The IHS Markit/CIPS said that the Britain's Construction PMI reached the highest level in five months of 53.1 in the reported month, entirely driven by the residential projects, while civil and commercial engineering activity kept contracting.