Sample Category Title
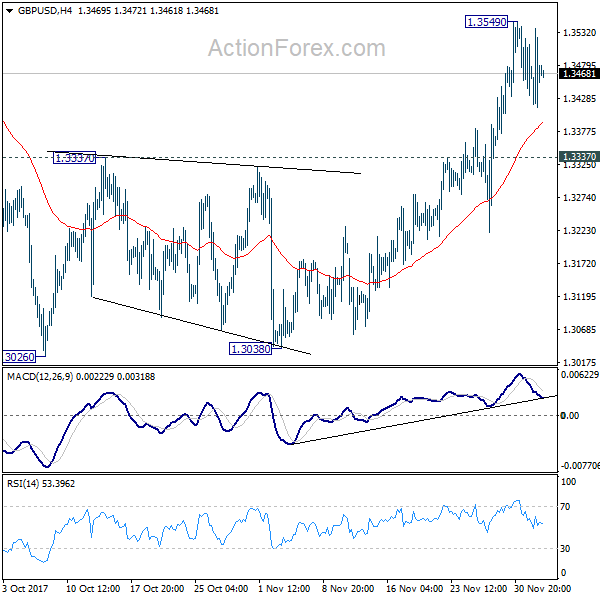
GBP/USD Daily Outlook
Daily Pivots: (S1) 1.3415; (P) 1.3476; (R1) 1.3541; More....
GBP/USD's consolidation from 1.3549 is still in progress and intraday bias remains neutral. Downside of retreat should be contained by 1.3337 resistance turned support to bring another rise. Above 1.3549 will target 1.3651 and above. However, decisive break of 1.3337 will argue that rise from 1.3038 has completed and turn bias back to the downside for this support.
In the bigger picture, while the medium term rebound from 1.1946 low is strong, it's still limited below 1.3835 key support turned resistance. As long as 1.3835 holds, we'd view such rebound as a correction. That is, we'd expect another leg in the long term down trend through 1.1946 low. However, sustained break of 1.3835 should at least send GBP/USD to 38.2% retracement of 2.1161 (2007 high) to 1.1946 (2016 low) at 1.5466.
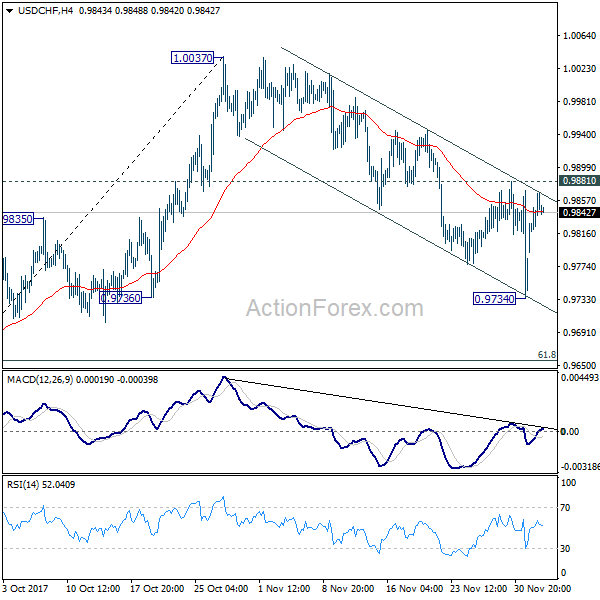
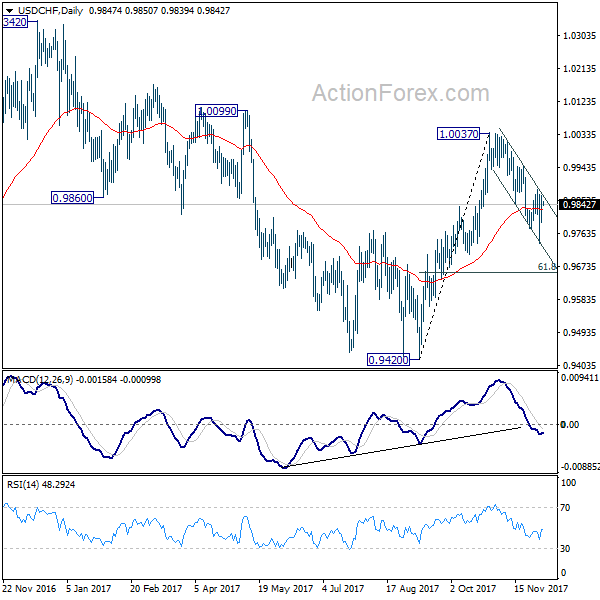
USD/CHF Daily Outlook
Daily Pivots: (S1) 0.9804; (P) 0.9836; (R1) 0.9881; More....
USD/CHF is staying in range of 0.9734/9881 and intraday bias remains neutral at this point. On the upside, break of 0.9881 resistance will indicate completion of the pull back from 1.0037. Intraday bias will then be turned back to the upside for retesting 1.0037. Below 0.9734 will extend the pull back. But we'll look for bottoming again below 61.8% retracement of 0.9420 to 1.0037 at 0.9656.
In the bigger picture, range trading continues between 0.9420/1.0342. At this point, 0.9420 appears to be a strong support level. Therefore, in case of decline attempt, we don't expect a firm break of this level. Nonetheless, strong break of 1.0342 is also needed to confirm upside momentum. Otherwise, medium term outlook will stay neutral.
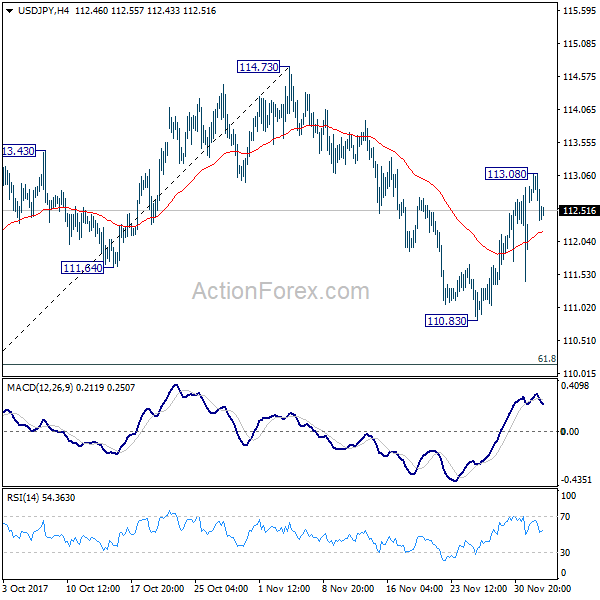
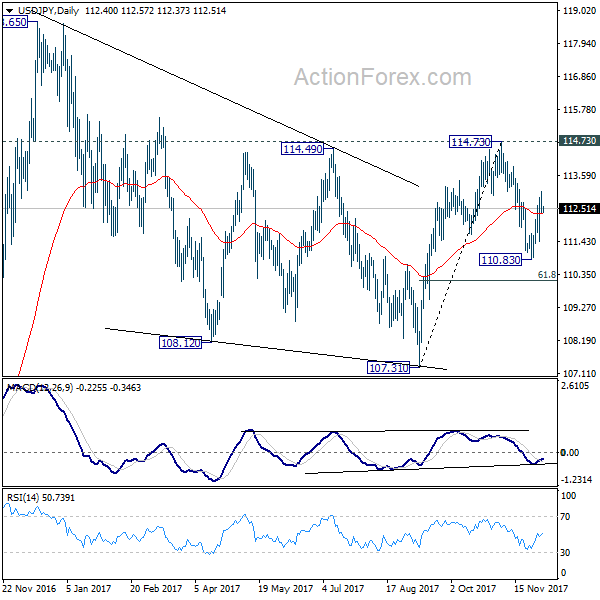
USD/JPY Daily Outlook
Daily Pivots: (S1) 112.14; (P) 112.61; (R1) 112.86; More...
A temporary top is in place at 113.08 as USD/JPY retreats. Intraday bias is turned neutral first. On the upside, above 113.08 will extend the rebound from 110.83 to retest 114.73 key resistance. Decisive break there will extend the rally from 107.31 to retest 118.65 high. On the downside, break of 110.83 will resume the decline from 114.73 instead. But in that case, we'll look for bottoming again below 61.8% retracement of 107.31 to 114.73 at 110.14.
In the bigger picture, we're holding on to the view that correction from 118.65 is completed a 107.31. And medium term rise from 98.97 (2016 low) is resuming. Sustained break of 114.73 should affirm our view and send USD/JPY through 118.65. However, break of 107.31 will dampen this will and extend the medium term fall back to 98.97 low.
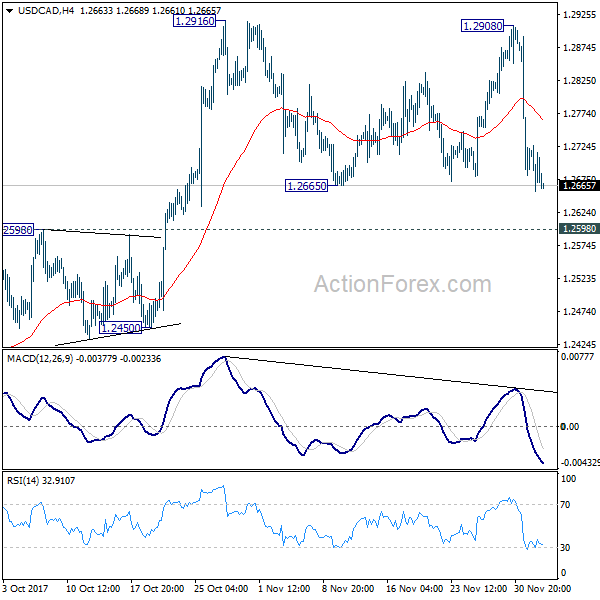
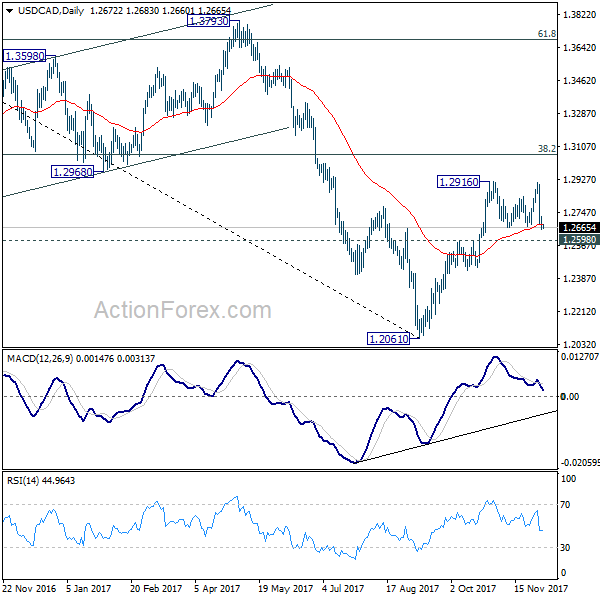
USD/CAD Daily Outlook
Daily Pivots: (S1) 1.2643; (P) 1.2685; (R1) 1.2714; More....
USD/CAD's consolidation from 1.2916 is still in progress and intraday bias remains neutral first. Deeper pull back cannot be ruled out. But we'd expect downside to be supported by 1.2598 resistance turned support to bring rise resumption. Break of 1.2916 will resume the rally from 1.2061 and target 1.3065 medium term fibonacci level next. However, sustained break of 1.2598 will argue that rebound from 1.2061 has completed after hitting 55 week EMA (now at 1.2880). Near term outlook will be turned bearish in this case.
In the bigger picture, USD/CAD should have defended 50% retracement of 0.9406 (2011 low) to 1.4689 (2016 high) at 1.2048. And with 1.2048 intact, we'd favor the case that fall from 1.4689 is a correction. Rise from 1.2061 medium term bottom should now target 38.2% retracement of 1.4689 to 1.2061 at 1.3065. Firm break there will target 1.3793 key resistance next (61.8% retracement at 1.3685). We'll now hold on to this bullish view as long as 1.2450 support holds.
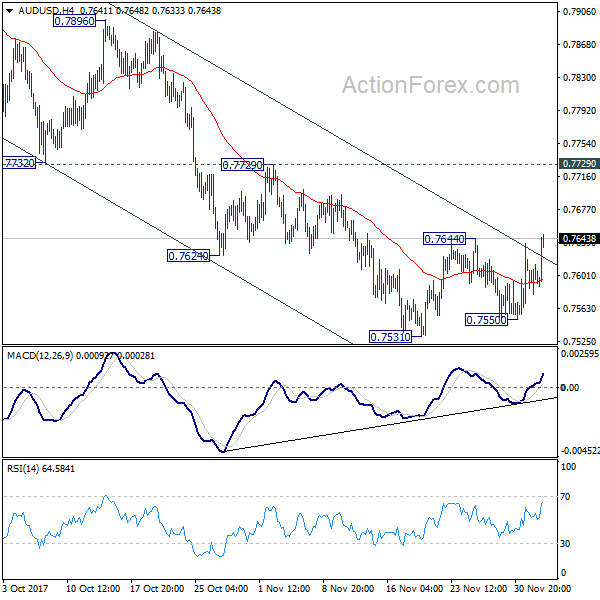
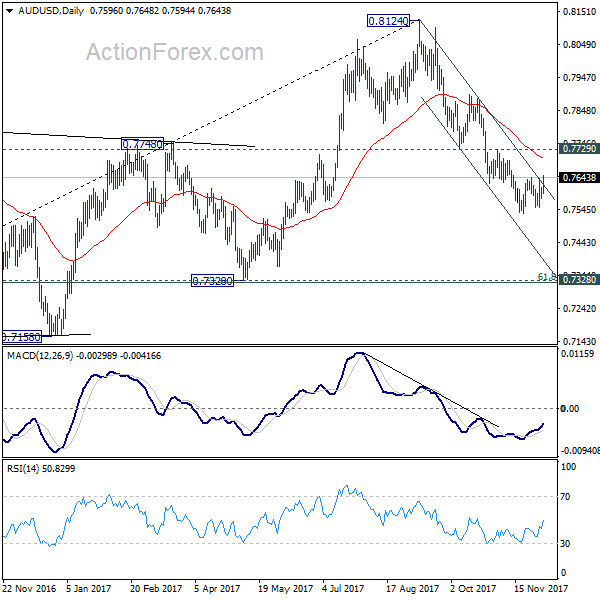
AUD/USD Daily Outlook
Daily Pivots: (S1) 0.7580; (P) 0.7597; (R1) 0.7615; More...
AUD/USD recovers today as consolidation from 0.7531 extends. Overall outlook remains unchanged though. As long as 0.7729 resistance holds, near term outlook remains bearish and further decline is expected. Break of 0.7550 will resume whole decline from 0.8124 and target next key cluster level at 0.7322/8. Nonetheless, break of 0.7729 will indicate near term reversal, with bearish divergence condition in 4 hour MACD. And stronger rebound would be seen back to 0.7896 resistance and above.
In the bigger picture, corrective rise from 0.6826 medium term bottom is likely completed at 0.8124, after hitting 55 month EMA (now at 0.8033). Decisive break of 0.7328 key cluster support (61.8% retracement 0.6826 to 0.8124 at 0.7322) will confirm. And in that case, long term down trend from 1.1079 (2011 high) will likely be resuming. Break of 0.6826 will target 61.8% projection of 1.1079 to 0.6826 from 0.8124 at 0.5496. This will now be the favored case as long as 0.7729 near term resistance holds.
Sterling Reversed as May and Juncker Failed to Deliver; Aussie Lifted by Retail Sales, Firm after RBA
Sterling reversed earlier gains and weakened broadly overnight after the meeting between UK Prime Minister Theresa May and European Commission President Jean Claude Juncker failed deliver agreements on Brexit. Dollar also softened mildly as boost from tax bill faded. Traders are also cautious as there are still much work to be done to reconcile the House and Senate tax bills. And there are still lots of uncertainties on what the final versions would be. Investors in other markets were also cautious. DOW jumped to record high at 24534.04, but pared back much gain to close at 24290.05, up only 0.24%. S&P 500 rose to record high at 2665.19 too, but closed down -0.11% at 2639.44. Asian markets also trade with an undertone today with Nikkei losing -0.15% at the time of writing.
No deal was made yet on Brexit negotiations
Sterling reversed earlier gains on disappointment that no deal was made between UK and EU on Brexit negotiations. It's reported that UK Prime Minister Theresa May was forced to pause the lunch meeting with European Commission President Jean Claude Juncker to answer a call from furious DUP leader Arlene Foster. May's proposal regarding Irish border is believed to have a compromise to allow Norther Ireland to retain the same rules as the Republic of Ireland critical areas. The North Ireland party was deeply worried that the deal would result in "regulatory divergence" between North Ireland and the rest of UK.
May insisted after the the meeting the progress has been made even through "a couple of issues some differences do remain which require further negotiation and consultation". And she sounded optimistic saying "We will reconvene before the end of the week and I am also confident that we will conclude this positively."
European Commission President Jean Claude Juncker said, after meeting with UK Prime Minister May, "it was not possible to reach complete agreement today" despite their "best efforts". Nonetheless, he added that "we were narrowing our positions to a huge extent". And, "I'm still confident that we can reach sufficient progress before the European Council of 15 December." Juncker emphasized that "this is not a failure, this is the start of the very last round", and, "I'm very confident that we will reach an agreement in the course of this week."
Aussie lifted by retail sales, hold gains after RBA stands pat
Australian Dollar was lifted by solid retail sales data today. Sales grew 0.5% mom in October, beating expectation of 0.3% mom. RBA left cash rate unchanged at 1.50% as widely expected. The accompanying statement revealed nothing new and Aussie maintains gain after that. In short, RBA maintained that " holding the stance of monetary policy unchanged at this meeting would be consistent with sustainable growth in the economy and achieving the inflation target over time." The central bank also maintained that GDP growth would average 3% over the new few years. Employment growth is expected continue to solid but wage growth "remains low". Inflation also remains "low" but RBA expects it to "pick up gradually as the economy strengthens. It also retained the warning that "an appreciating exchange rate would be expected to result in a slower pick-up in economic activity and inflation than currently forecast." Also from Australia, current account deficit narrowed slightly to AUD -9.1b in Q3.
Elsewhere
China Caixin PMI services rose to 51.9 in November, up from 51.2, above expectation of 51.5. UK BRC sales monitor rose 0.6% yoy in November. Eurozone will release Q3 GDP revision, retail sales and services PMI revision today. UK will also release PMI services. Later in the day, Canada will release trade balance. US will release trade balance and ISM non-manufacturing.
AUD/USD Daily Outlook
Daily Pivots: (S1) 0.7580; (P) 0.7597; (R1) 0.7615; More...
AUD/USD recovers today as consolidation from 0.7531 extends. Overall outlook remains unchanged though. As long as 0.7729 resistance holds, near term outlook remains bearish and further decline is expected. Break of 0.7550 will resume whole decline from 0.8124 and target next key cluster level at 0.7322/8. Nonetheless, break of 0.7729 will indicate near term reversal, with bearish divergence condition in 4 hour MACD. And stronger rebound would be seen back to 0.7896 resistance and above.
In the bigger picture, corrective rise from 0.6826 medium term bottom is likely completed at 0.8124, after hitting 55 month EMA (now at 0.8033). Decisive break of 0.7328 key cluster support (61.8% retracement 0.6826 to 0.8124 at 0.7322) will confirm. And in that case, long term down trend from 1.1079 (2011 high) will likely be resuming. Break of 0.6826 will target 61.8% projection of 1.1079 to 0.6826 from 0.8124 at 0.5496. This will now be the favored case as long as 0.7729 near term resistance holds.
Economic Indicators Update
| GMT | Ccy | Events | Actual | Forecast | Previous | Revised |
|---|---|---|---|---|---|---|
| 0:01 | GBP | BRC Retail Sales Monitor Y/Y Nov | 0.60% | -1.00% | ||
| 0:30 | AUD | Current Account Balance (AUD) Q3 | -9.1B | -8.8B | -9.6B | -9.7B |
| 0:30 | AUD | Retail Sales M/M Oct | 0.50% | 0.30% | 0.00% | 0.10% |
| 1:45 | CNY | Caixin PMI Services Nov | 51.9 | 51.5 | 51.2 | |
| 3:30 | AUD | RBA Rate Decision | 1.50% | 1.50% | 1.50% | |
| 8:45 | EUR | Italy Services PMI Nov | 53.2 | 52.1 | ||
| 8:50 | EUR | France Services PMI Nov F | 60.2 | 60.2 | ||
| 8:55 | EUR | Germany Services PMI Nov F | 54.9 | 54.9 | ||
| 9:00 | EUR | Eurozone Services PMI Nov F | 56.2 | 56.2 | ||
| 9:30 | GBP | Services PMI Nov | 55 | 55.6 | ||
| 10:00 | EUR | Eurozone GDP Q/Q Q3 F | 0.60% | 0.60% | ||
| 10:00 | EUR | Eurozone Retail Sales M/M Oct | -0.70% | 0.70% | ||
| 13:30 | CAD | International Merchandise Trade (CAD) Oct | -2.3B | -3.2B | ||
| 13:30 | USD | Trade Balance Oct | -46.2B | -43.5B | ||
| 14:45 | USD | Services PMI Nov F | 55.3 | 54.7 | ||
| 15:00 | USD | ISM Non-Manufacturing/Services Composite Nov | 59 | 60.1 |
Market Morning Briefing: Euro Saw A Low Of 1.1829 Yesterday
STOCKS
Dow (24290.05, +0.24%) tested levels above 24500 yesterday before coming off from there. A fall towards 24000 looks likely in the next few sessions.
Dax (13058.55, +1.53%) attempted a rise to 13100 yesterday and has managed to stay above 13000. Near term could see some sideways consolidation within 13200-12900 region as mentioned yesterday.
Nikkei (22611.61, -0.42%) has come down but could possibly bounce back after testing 22250 in the near term. Overall the index could be ranged in the 22750-22250 region for the next few sessions.
Shanghai (3308.42, -0.04%) is almost stable and may attempt a rise towards 3350 while immediate support near 3300 holds. Only on a break below 3300 would we shift our focus on the downside. Near term view remains bullish.
Nifty (10127.75, +0.06%) is in the corrective dip phase and could well test 10050 on the downside before trying to move up from there. Maximum downside could be limited to 10050 from where the index could start bouncing back towards 10250 and higher. A beak below 10050-10000, if seen, could be indicative of a sharper fall for the medium to long term.
32500 is the immediate support which could push Sensex (32869.72, +0.11%) back towards 33500. A break below 32500 could validate a possible double top formation visible on the charts.
COMMODITIES
Gold (1275.80) is almost stable above support at 1260. The price would soon bounce back towards 1285-1290 region in the next few sessions.
WTI (57.56) and Brent (62.55) are trading a bit lower today but both have immediate support just below current levels which if holds, could push the prices towards higher levels of 59 and 64 respectively. At the same time, also note that the WTI has crucial long term resistance at 59 which if proves to be strong, may not let the price stay above 57 for long.
Copper (3.091) has supports near 3.00-3.05 region and while that holds, a rise towards 3.12-3.13 is possible in the near term. A break below 3.00, in the medium term could be vulnerable to a further fall towards 2.95 or lower but that is not taken into consideration just now as the price could trade in the 3.00-3.15 region for some more time.
FOREX
Dollar-Index (93.043) reached a high of 93.36 yesterday, going past resistance level at approx 93.25-93.30 on the daily charts; however it closed lower at 93.08 and is currently trading around similar levels. This might reflect a hold of resistance in the near term, with a dip towards immediate support at 92.75-92.80 likely within this week. Lack of significant strength in the dollar might even lead to the index dropping below 92.75 to test levels near 91.50 in this month. However, dollar strength could push it to test 93.75 on the daily line charts in a week’s time.
Euro (1.1874) saw a low of 1.1829 yesterday, thereby testing immediate support on the daily candle charts, but rose to close at 1.1864. This support (which would now be around 1.185-1.19 levels) seems to be holding strong for now and only a decisive move in dollar strength could bring about of a break of this support to test new support at approx 1.1775 on the 3 day candles. Dollar weakness could see breach of resistance (1.19) on the weekly line chart and a move towards 1.20-1.21.
Dollar-Yen (112.53) is maintaining its upmove and is likely to attempt levels around 113 within this week, with a test of resistance around 113.50 on the daily line charts likely in this month.
Pound (1.3467) tested resistance at 1.35 again during intra-day trading yesterday but came down to close at 1.3479. It is currently trading at similar levels and can be expected to stay within the channel between 1.35 and 1.335 for the next few sessions. Dollar weakness could make it test resistance at 1.36 on the weekly candles.
Dollar Rupee (64.3250) dipped below 64.30 yesterday to a low of 64.2825 but closed above that at 64.3750. It needs to be seen if dollar strength relative to the euro dips in the next few sessions, which could then dictate how the rupee moves. Currently, with Euro not gaining much strength, a rise of Dollar Rupee towards 64.60-80 can be expected.
INTEREST RATES
The US yield differentials have been falling sharply. The 10-5Yr (0.23%), 30-10Yr (0.39%) and the 30-5Yr (0.62%) have all come down to multi-year lows and look bearish for the next few sessions before they could recover.
The US 5Yr (2.15%) has moved up sharply and could head towards 2.25% in the near term. the 10YR (2.38%) and the 30Yr (2.77%) on the other hand have dipped from previous levels of 2.39% and 2.79% respectively. While the 5YR continues to rise and the 10 YR and the 30YR remains stable, the yield curve could flatten in the coming sessions.
The German-US 10Yr (-2.04%) came back to close at higher levels yesterday. The yield spread could now bounce back towards -2% in the near term.
(RBA) Statement by Philip Lowe, Governor: Monetary Policy Decision
At its meeting today, the Board decided to leave the cash rate unchanged at 1.50 per cent.
Conditions in the global economy have improved over 2017. Labour markets have tightened and further above-trend growth is expected in a number of advanced economies, although uncertainties remain. Growth in the Chinese economy continues to be supported by increased spending on infrastructure and property construction, although financial conditions have tightened somewhat as the authorities address the medium-term risks from high debt levels. Australia's terms of trade are expected to decline in the period ahead but remain at relatively high levels.
Wage growth remains low in most countries, as does core inflation. In a number of economies there has been some withdrawal of monetary stimulus, although financial conditions remain quite expansionary. Equity markets have been strong, credit spreads have narrowed over the course of the year and volatility in financial markets is low. Long-term bond yields remain low, notwithstanding the improvement in the global economy.
Recent data suggest that the Australian economy grew at around its trend rate over the year to the September quarter. The central forecast is for GDP growth to average around 3 per cent over the next few years. Business conditions are positive and capacity utilisation has increased. The outlook for non-mining business investment has improved further, with the forward-looking indicators being more positive than they have been for some time. Increased public infrastructure investment is also supporting the economy. One continuing source of uncertainty is the outlook for household consumption. Household incomes are growing slowly and debt levels are high.
Employment growth has been strong over 2017 and the unemployment rate has declined. Employment has been rising in all states and has been accompanied by a rise in labour force participation. The various forward-looking indicators continue to point to solid growth in employment over the period ahead. There are reports that some employers are finding it more difficult to hire workers with the necessary skills. However, wage growth remains low. This is likely to continue for a while yet, although the stronger conditions in the labour market should see some lift in wage growth over time.
Inflation remains low, with both CPI and underlying inflation running a little below 2 per cent. The Bank's central forecast remains for inflation to pick up gradually as the economy strengthens.
The Australian dollar remains within the range that it has been in over the past two years. An appreciating exchange rate would be expected to result in a slower pick-up in economic activity and inflation than currently forecast.
Growth in housing debt has been outpacing the slow growth in household income for some time. To address the medium-term risks associated with high and rising household indebtedness, APRA has introduced a number of supervisory measures. Credit standards have been tightened in a way that has reduced the risk profile of borrowers. Nationwide measures of housing prices are little changed over the past six months, with conditions having eased in Sydney. In the eastern capital cities, a considerable additional supply of apartments is scheduled to come on stream over the next couple of years. Rent increases remain low in most cities.
The low level of interest rates is continuing to support the Australian economy. Taking account of the available information, the Board judged that holding the stance of monetary policy unchanged at this meeting would be consistent with sustainable growth in the economy and achieving the inflation target over time.
Understanding the Senate Tax Plan’s Dynamic Score
Dynamic scoring has once again entered the news headlines. In this report, we dissect the Joint Committee on Taxation's fiscal and economic analysis and discuss "crowding out," a key factor in dynamic scores.
Dynamic Scores Crowding Out Static Ones
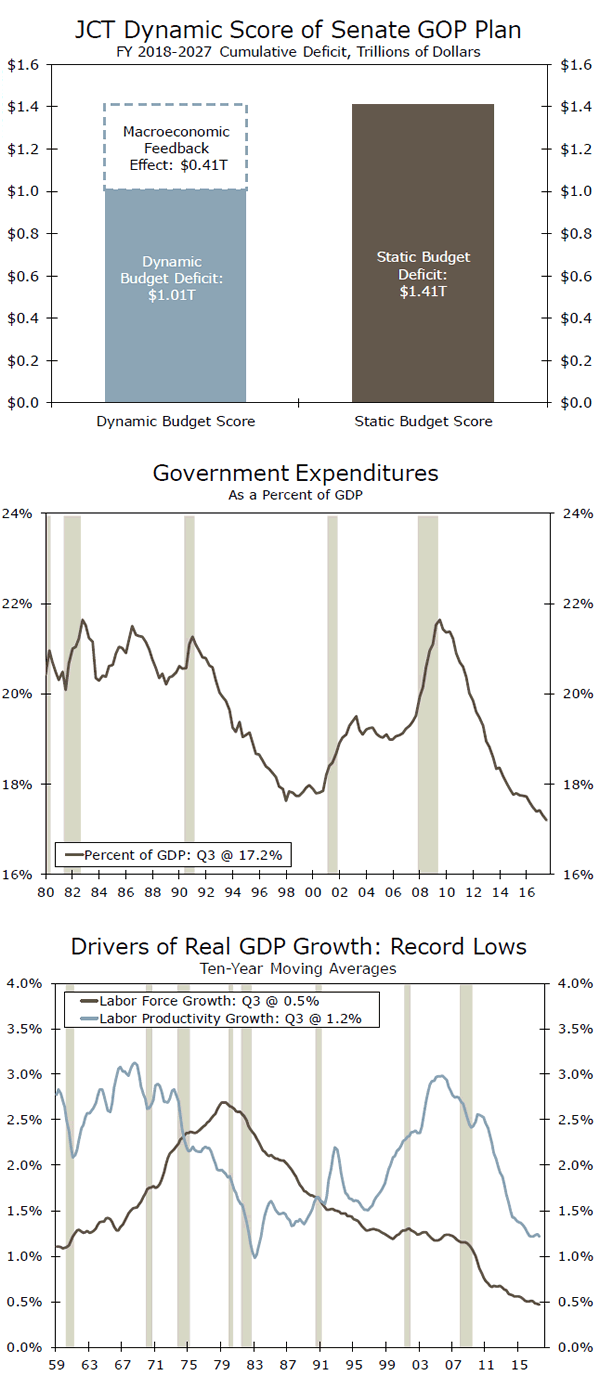
Last week, the Joint Committee on Taxation (JCT), Congress's official revenue-scorekeeper, released its "dynamic" score of the Senate GOP tax plan. In short, a dynamic score differs from a "static" score in that it attempts to account for changes to aggregate economic variables such as GDP and interest rates when estimating the revenue impact of a tax bill. The score from the JCT showed the Senate plan increasing the deficit by roughly $1 trillion over the next 10 years, down from the $1.4 trillion "static" score (top chart).
Parsing out an annual GDP growth rate from JCT's score is a tricky exercise. The JCT describes the economic impact as follows: "We estimate that this proposal would increase the level of output by about 0.8 percent on average over the 10-year budget window." Since JCT is referring to the level of GDP, and since growth compounds over time, the exercise is more involved than simply adding 0.8 percentage points to the baseline growth rate each year.
There are countless scenarios under which this could occur. For instance, the level of GDP could jump 0.8 percent in the first year, before returning to the baseline growth rates, creating a level of GDP that is, on average, 0.8 percent higher with an average growth rate that is 0.08 percentage points faster per year. Alternatively, GDP could grow 0.14 percentage points faster per year, yielding a level of GDP that is 0.8 percent higher than the baseline, on average, over the next decade. Perhaps more likely than either of these cases is a hybrid where growth jumps in the first few years by 0.3 percentage points or so, but then begins to slow as the temporary provisions, such as full expensing and the individual tax cuts, get closer to expiring.
A slew of factors can influence the output of a dynamic score, but one of the most important is a phenomenon known as "crowding out." Crowding out occurs when an increase in the federal budget deficit leads more national savings to be used to buy Treasury securities rather than to fund private investment. The Congressional Budget Office, a cousin to the JCT, estimates that when the deficit goes up by one dollar, private savings rise by 43 cents and foreign capital inflows rise by 24 cents (as higher interest rates increase the incentive to save and attract foreign capital), leaving a net decline of 33 cents in savings available for private investment.
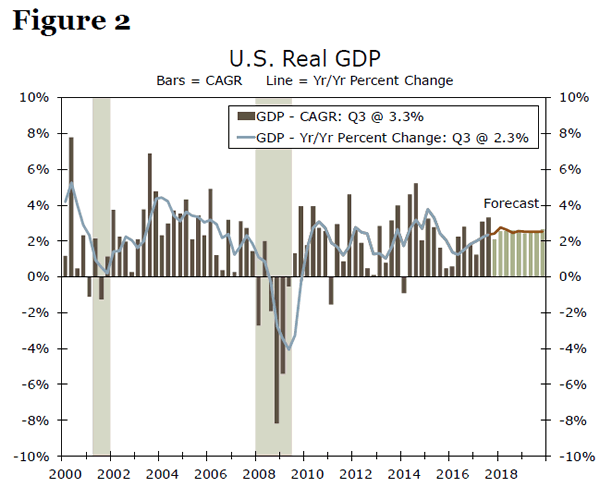
Some think tanks have also produced dynamic scores. The Tax Policy Center and the Penn Wharton Budget Model produced estimates suggesting that the House-passed bill would lift growth by less than 0.1 percentage point per year. The Tax Foundation, a leading conservative think tank whose model assumes a much smaller crowding out effect, estimated the House bill would lift growth by about 0.3 percentage points per year over the long-run. As we wrote in a piece earlier this year, with real potential GDP growth less than 2 percent at present, the hurdles to sustained economic growth of 3 percent or more are high (bottom chart).
Tax Package Next Steps: Reconciling Differences
Executive Summary
Late last week Senate Republicans passed their version of a $1.4 trillion tax package, while the House passed its version on November 16. While progress on getting a final tax package passed has been made, there is one final hurdle before enactment: the two bills must be reconciled and a single version passed through both the House and the Senate. In this report, we summarize the next steps in the legislative process and highlight the possible sticking points between the two bills. We conclude with a discussion of the bills' fiscal and economic impact.
We remain comfortable with our call for passage of a tax package in the first quarter of next year, with the cuts retroactive to January 2018. Our view is that the final package will rely on temporary cuts (either individual, corporate or both) and will likely end up looking more like the Senate's tax package rather than the House package.
How Does the Process Unfold from Here?
The next step in the process is for the House and Senate to vote on conferees to a joint House and Senate conference committee. This committee will be charged with reconciling the differences between the two tax bills. We expect this process to take some time given several differences between the two bills. As the negotiations unfold, we see the final bill looking more like the Senate bill than the House bill given the very tight vote margin in the Senate. Complicating matters is a deadline to fund the government by December 8. It is expected that Congress will extend funding via a continuing resolution (CR) through December 22. This short-term CR would likely eat into the time needed to clear the final tax package through both chambers, since Congress will need to again come up with another funding bill before December 22. We maintain the view that the final package will likely be passed in Q1-2018.
What Are Major Differences Between the House and Senate Bills?
Permanence of Individual Tax Cuts
One of the biggest possible sources of contention in reconciling differences will likely be the temporary nature of Senate tax cuts. In the House bill, a $300 family tax credit expires after 2022, but all other individual tax changes in the House bill are made permanent. In the Senate, however, all individual tax breaks including the larger standard deduction would expire after 2026. This expiration would also be true of the repeal of the state and local deduction (SALT). Essentially, the individual tax code would "snap back" to its current policies under the Senate bill. While this permanence issue may be a point of contention, there are few choices to work around Senate rules prohibiting a deficit impact beyond a 10-year window. Thus, the conference committee can accept the Senate's individual tax cut expiration, or it could allow some of the corporate tax cuts to expire.
Number of Individual Tax Brackets
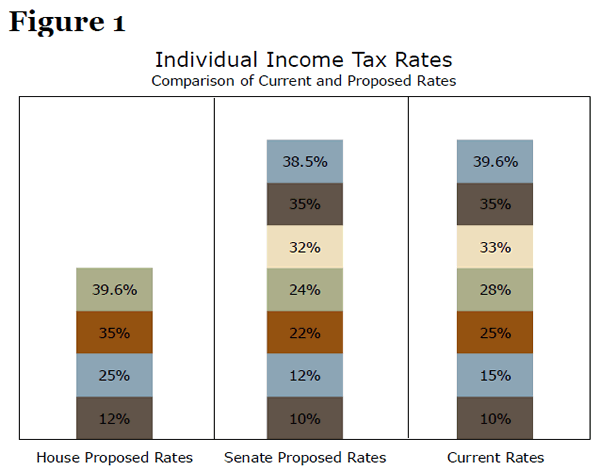
Another key difference between the two packages is the number of tax brackets. The House bill collapses the current seven brackets into four brackets of 12, 25, 35 and 39.6 percent. The marginal rate on the top bracket is left unchanged and would kick in at income in excess of $500,000 for single filers and $1,000,000 for married filers, up from the current brackets of $418,400 and $470,700, respectively. The Senate bill leaves the number of tax brackets at seven but modifies the rates and income thresholds. The marginal rate on the top bracket is reduced to 38.5 percent and would kick in at income in excess of $500,000 for single filers and $1,000,000 for married filers. In both bills, the tax brackets would be indexed for inflation (Figure 1).
Child/Family Tax Credits
The House bill increases the child tax credit to $1,600 from $1,000, increases the income threshold for phase-out and creates a new $300 per-person family tax credit for other non-child dependents. The Senate bill has a higher child tax credit at $2,000 and increases the income threshold for phase-out to a greater extent than the House bill. The Senate bill also creates a $500 nonrefundable credit for qualifying dependents other than children.
Mortgage Interest Deduction
The House bill caps the mortgage interest deduction at $500,000 of debt (down from $1 million under current law) and eliminates the interest deduction for second homes and home equity debt. The Senate version maintains the current $1 million mortgage interest deduction cap.
Estate Tax
The House bill doubles the estate tax exemption to $10.98 million, indexed to inflation, then permanently repeals the estate tax in 2024. The Senate bill, however, preserves the estate tax but doubles the exemption to $10.98 million, indexed to inflation.
Pass-Through Income
The House bill creates a 25 percent rate for income derived from pass-through entities, which under current law is taxed through individual income tax brackets. To try and prevent abuse of the system, the bill proposes treating 70 percent of income as wage income (subject to the individual tax brackets) and 30 percent as business income (subject to the 25 percent rate). Some "specific service activities," such as income derived from financial services, law, engineering and other similar fields, are excluded from the special pass-through rate to create additional antiabuse guardrails. The Senate bill allows a deduction of 23 percent of qualified business income from total income. The Senate bill also excludes some "specific service activities" from being used to take advantage of this provision for anti-abuse reasons.
Alternative Minimum Tax
The House version eliminates both the individual and corporate Alternative Minimum Tax (AMT). The Senate bill preserves the AMT for corporations and for individuals but with a higher exemption amount.
Timeline for Implementation of Corporate Tax Cuts
Under the House bill the reduction of the corporate tax rate to 20 percent would begin in 2018. The Senate bill matches the 20 percent corporate rate but delays the implementation until 2019.
Business Expensing
Both the House and Senate bills allow for full expensing of capital investment for five years, but the Senate bill phases out the provision after five years rather than simply ending the provision as occurs in the House bill.
Deemed Repatriation
The house bill enacts a deemed repatriation of deferred foreign profits at a rate of 14 percent for cash and cash-equivalent profits and 7 percent for reinvested foreign earnings over a period of eight years. The Senate bill has differing rates of 14.5 percent for cash and cash-equivalent profits and 7.5 percent for reinvested foreign earnings.
Fiscal and Economic Impact
The Joint Committee on Taxation (JCT) serves as the official scorekeeper of the tax bills. According to the JCT's analysis, the House bill would cost $1.437 trillion over the next ten years, while the Senate bill would total $1.448 trillion over the same time period. The JCT also produces estimates of the macroeconomic impact of tax legislation. Its work found that the House bill, the only bill scored for macroeconomic effects as of this writing, would result in an economic impact of lifting the level of GDP by about "0.8 percent on average over the 10-year budget window." Since the JCT is referring to the level of GDP, and since growth compounds over time, the exercise is more involved than simply adding 0.8 percentage points to the baseline growth rate each year. While there are several possible ways to interpret this finding, on average the annual change to GDP would be roughly 0.08 percentage points, with the likely possibility of greater contributions to output in the early years of the 10-year window and somewhat smaller contributions to output in the later years. After the JCT accounts for the macroeconomic feedback of an earlier version of the Senate tax bill, the resulting budget deficit over 10-years would fall to $1.01 trillion. Given the JCT's analysis, we remain comfortable with our call for the final tax package adding roughly 0.2 percentage points to our GDP forecast in 2018 (Figure 2).