Sample Category Title
Loonie Trading On A Weaker Footing This Morning
For the 24 hours to 23:00 GMT, the USD declined 0.25% against the CAD and closed at 1.2684.
In the Asian session, at GMT0400, the pair is trading at 1.2667, with the USD trading 0.13% lower against the CAD from yesterday’s close.
The pair is expected to find support at 1.2640, and a fall through could take it to the next support level of 1.2614. The pair is expected to find its first resistance at 1.2710, and a rise through could take it to the next resistance level of 1.2754.
Ahead in the day, traders would look forward to Canada’s international merchandise trade balance for October.
The currency pair is trading below its 20 Hr and 50 Hr moving averages.

RBA Remains Cautious As Wage Growth Subdued
RBA left the cash rate unchanged at 1.5% in November, following the last reduction in August 2016. The accompanying statement contained little surprise. While staying confident over the employment situation, policymakers remained weary off the persistently soft inflation and wage growth. The RBA stance is largely unchanged from the previous meeting. We retain the view that the policy rate would stay unchanged for the entire 2018.
Employment Situation
Australia’s unemployment rate fell to 5.4%, lowest since January 2013, in October.
RBA acknowledged that employment has increased in all states. The decline in unemployment rate has come together with 'a rise in labour force participation'. This is a good sign for the job market. Rising participation rate signals more people enter the job market again in expectations of better economic environment and opportunities. The fall in unemployment rate in light of higher participation suggests that the job market can more than absorbing the bigger labor force. The central bank remained confident that 'solid growth in employment' could continue.
Inflation
Following a brief breach of the +2% target earlier this year, headline inflation been declining. While core CPI has been recovering after bottoming in mid-2016, it has remained below RBA’s desired level. As noted in the statement, the central bank noted that both the headline and core readings have been 'running a little below 2%, while reiterating the hopes that inflation would 'pick up gradually as the economy strengthens'. Affecting spending and hence inflation is wage growth which has remained subdued. The RBA suggested that the low-growth environment should 'continue for a while yet, although the stronger conditions in the labour market should see some lift in wage growth over time'.
Housing Market
Policymakers suggested that 'nationwide measures of housing prices are little changed over the past six months, with conditions having eased in Sydney'. While omitting the language that the housing prices in Melbourne were rising, CoreLogic data revealed that dwelling values in Melbourne rose +0.52% m/m in November. The rest of the comments about the housing market remained the same as the previous months. For instance, the RBA warned that 'growth in housing debt has been outpacing the slow growth in household income for some time' and the macroprudential measures have been implemented to curb medium-term risks associated with high and rising household indebtedness.
Australian Dollar
Given the fact the AUDUSD had fallen to a 5-month low of 0.753 last month and the pair recently has largely stayed at where it was at the November meeting, RBA noted that Aussie has been range-bounded. Yet, it continued to caution that 'an appreciating exchange rate would be expected to result in a slower pick-up in economic activity and inflation than currently forecast'.
Elliott Wave View: Nasdaq Short Term
Nasdaq Short term Elliott Wave view suggests that the rally to 6429.5 ended Intermediate wave (3). Intermediate wave (4) pullback is currently in progress to correct cycle from 8/21 low (5753.6) in 3, 7, or 11 swing before Index resumes the rally. Subdivision of Intermediate wave (4) is unfolding as a double three Elliott wave structure where Minor wave W ended at 6246 and Minor wave X ended at 6391.75. Minor wave Y of (4) is in progress towards 6096.66 – 6209.70 area, then Index should resume the rally higher from there or bounce in 3 waves at least. We don’t like selling the proposed pullback and expect buyers to appear from the above area for at least a 3 waves bounce as far as pivot at 8/21 low (5753.6) stays intact.
NQ_F Nasdaq 1 Hour Elliott Wave Chart
Denmark: No FX Intervention In November
- The Danish FX reserve was unchanged at DKK464bn in November.
- That was the eighth month in a row without FX intervention from Danmarks Nationalbank.
- We forecast EUR/DKK at 7.4425 on 1-6M and 7.4450 on 12M and for DN to keep the key policy rate unchanged at minus 0.65% on 12M.
Danmarks Nationalbank (DN) has just published November's FX reserve and central bank balance sheet. The FX reserve was unchanged at DKK464bn in November, with DN making no FX intervention. Government deposits were DKK139bn in November, down from DKK141bn in October.
That was the eighth month in a row without FX intervention, which highlights that it has been a quiet time for EUR/DKK since the French election, which prompted some FX intervention selling of DKK at the beginning of the year. EUR/DKK traded close to the 7.4400 level during November. It is furthermore the longest period of no FX intervention since the beginning of 2014, where DN went 14 months without intervening in FX markets.
In our view, EUR/DKK is stuck in the 7.4340-7.4450 range, with DN ready to step into the market around the level of 7.4330-40. We forecast EUR/DKK to trade around 7.4425 on 1-6M and 7.4450 on 12M and for DN to keep the key policy rate, the rate of interest on certificates of deposit, unchanged at minus 0.65% on 12M.
A focus on European politics in the market for EUR/DKK may return next year, with Italy set to hold elections, which could trigger demand for DKK. In addition, banks' net position will probably drop in Q1 18, which means slightly tighter DKK liquidity – another DKK positive. Finally, Danske Bank's DKK Exchange Market Pressure Index (EMPI) continues to signal persistent downwards pressure on EUR/DKK as DKK remains supported by strong economic fundamentals, e.g. a rising current account surplus. Hence, there is a risk to our forecast above that EUR/DKK will decline at the beginning of next year and put an end to the FX intervention drought.
GBP/JPY Daily Outlook
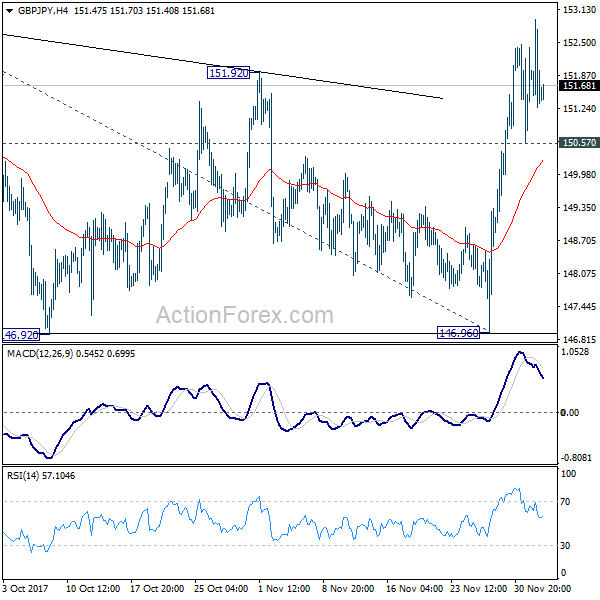
Daily Pivots: (S1) 150.84; (P) 151.89; (R1) 152.55; More...
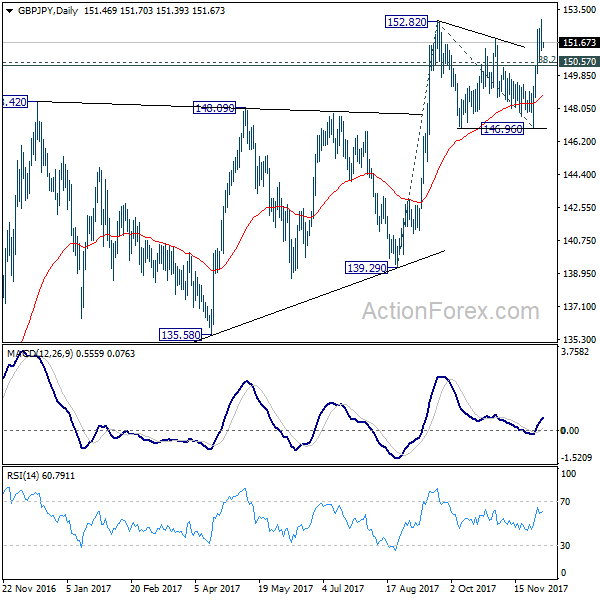
GBP/JPY lost upside momentum after breaching 152.82 resistance. But with 150.57 minor support intact, further rise is in favor. Sustained trading above 152.82 will confirm medium term rally resumption and target 61.8% projection of 139.29 to 152.82 from 146.96 at 155.32. On the downside, though, break of 150.57 minor support will dampen the bullish view and turn bias to the downside for 146.96 support again.
In the bigger picture, medium term rebound from 122.36 is still expected to resume after consolidation from 152.82 completes. Firm break of 38.2% retracement of 196.85 to 122.36 at 150.43 will carry long term bullish implications. In that case, GBP/JPY could target 61.8% retracement at 167.78. However, break of 46.96 support will indicate rejection from 150.43 key fibonacci level. And the three wave corrective structure of rebound from 122.36 will argue that larger down trend is resuming for a new low below 122.26.
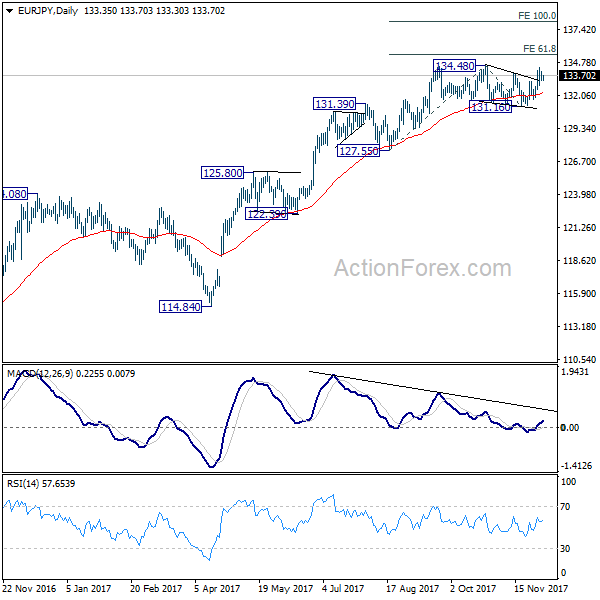
EUR/JPY Daily Outlook
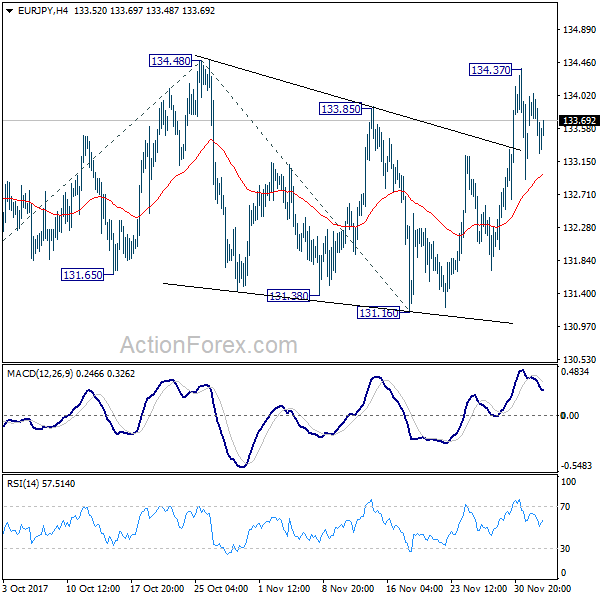
Daily Pivots: (S1) 133.07; (P) 133.55; (R1) 133.85; More....
Intraday bias in EUR/JPY remains neutral as it's staying in corrective trading below 134.37 temporary top. We're favoring the case that medium term up trend is nearly ready to resume. Break of 134.48 will target 61.8% projection of 127.55 to 134.48 from 131.16 at 135.44 and then 100% projection at 138.09. However, firm break of 131.16 support will now indicate near term trend reversal and turn outlook bearish for 127.55 key support.
In the bigger picture, medium term rise from 109.03 (2016 low) is seen as at the same degree as the down trend from 149.76 (2014 high) to 109.03 (2016 low). 61.8% retracement of 149.76 to 109.03 at 134.20 is already met. Sustained break there will pave the way to key long term resistance zone at 141.04/149.76. However, break of 127.55 support will suggest medium term topping and will turn outlook bearish for deeper fall back to 114.84/124.08 support zone at least.
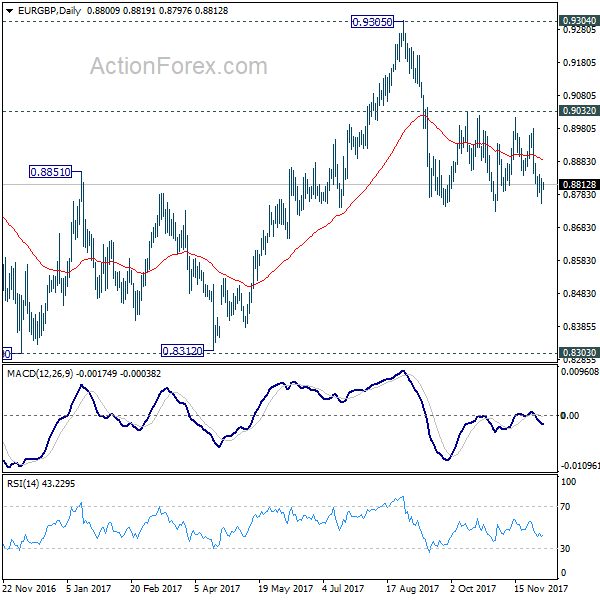
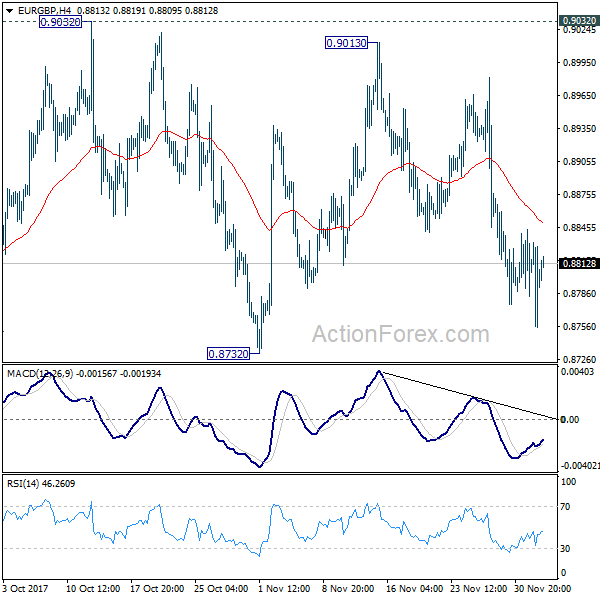
EUR/GBP Daily Outlook
Daily Pivots: (S1) 0.8760; (P) 0.8796; (R1) 0.8837; More...
No change in EUR/GBP as it's staying in range of 0.8732/9032. Intraday bias remains neutral and outlook stays bearish with 0.9032 resistance intact. That is, fall from 0.9305 is expected to resume later. Break of 0.8732 will target 0.8303 key support level. Nonetheless, decisive break of 0.9032 will confirm completion of the decline from 0.9305. In such case, intraday bias will be turned back to the upside for retesting 0.9305 key resistance.
In the bigger picture, there are various ways to interpret price actions from 0.9304 high. But after all, firm break of 0.9304/5 is needed to confirm up trend resumption. Otherwise, range trading will continue with risk of deeper fall. And in that case, EUR/GBP could have a retest on 0.8303. But we'd expect strong support from 0.8116 cluster support (50% retracement of 0.6935 to 0.9304 at 0.8120) to contain downside.
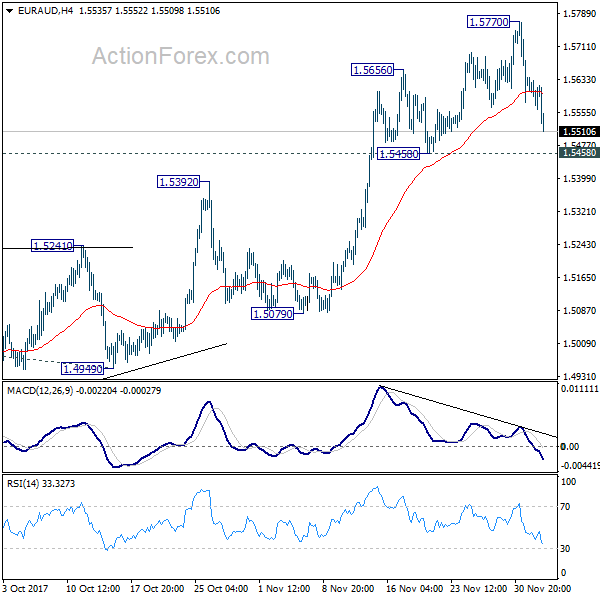
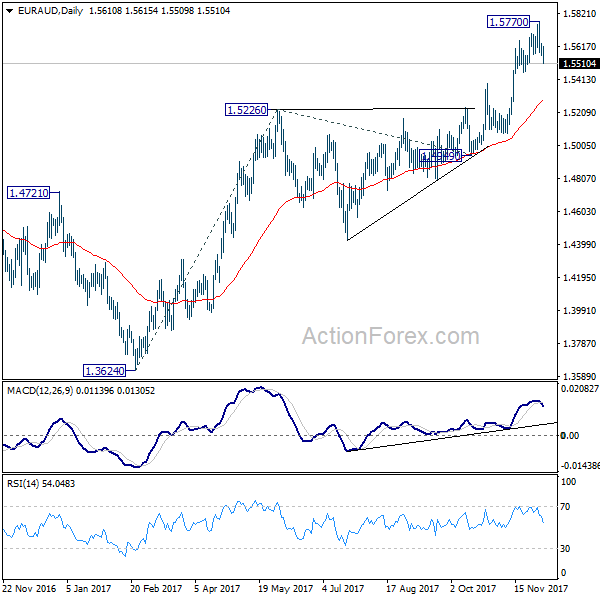
EUR/AUD Daily Outlook
Daily Pivots: (S1) 1.5571; (P) 1.5604; (R1) 1.5647; More....
EUR/AUD's fall from 1.5770 extends today and intraday bias remains on the downside for 1.5458 support and below. At this point, we'd expect strong support above 1.5226 key support to bring rebound. Medium term rally is still expected to resume later and break of 1.5770 will target 61.8% projection of 1.3624 to 1.5226 from 1.4949 at 1.5939 first.
In the bigger picture, we're holding on to the view that corrective decline from 1.6587 medium term top (2015 high) has completed at 1.3624. Rise from 1.3624 is expected to extend to retest 1.6587. We'll hold on to this bullish view as long as 1.5226 resistance turned support holds. Firm break of 1.6587 will resume long term rise from 1.1602 (2012 low).
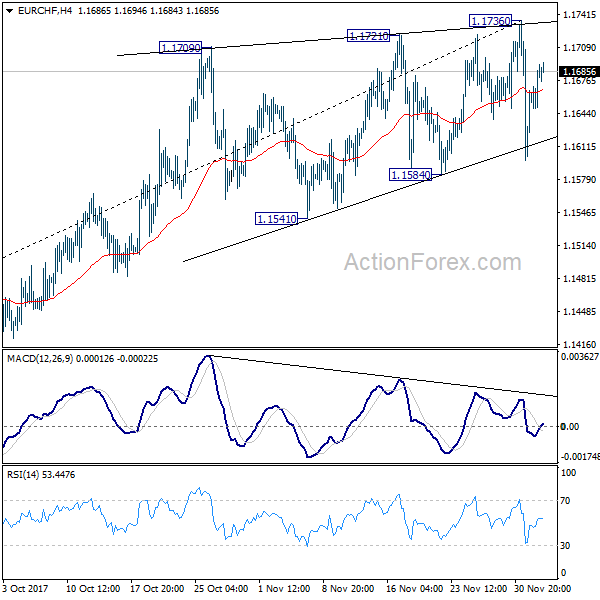
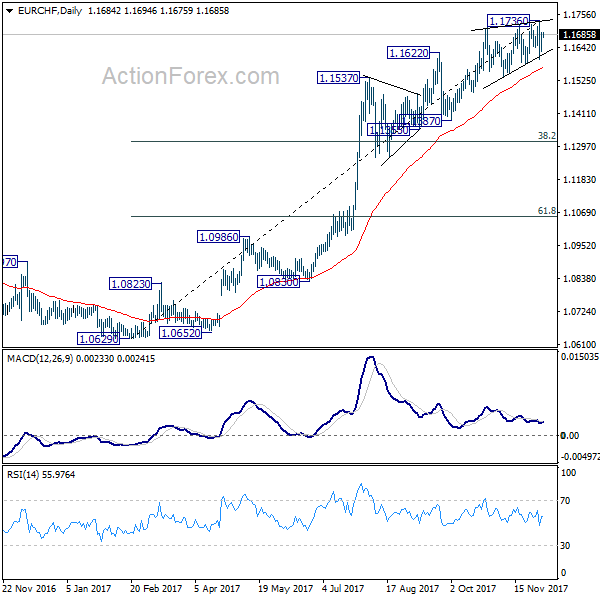
EUR/CHF Daily Outlook
Daily Pivots: (S1) 1.1644; (P) 1.1668; (R1) 1.1711; More...
Intraday bias in EUR/CHF remains neutral and outlook is unchanged. As noted before, persistent bearish divergence condition in 4 hour MACD and rising wedge like structure suggests that the cross is near to forming a top, if not formed. Hence, even in case of another rise, we'd expect limited upside potential. On the downside, sustained break of 1.1584 support will be a strong sign of trend reversal and should turn outlook bearish for 38.2% retracement of 1.0629 to 1.1736 at 1.1313.
In the bigger picture, while a medium term top could be around the corner, there is no change in the larger outlook. That is, long term rise from SNB spike low back in 2015 is still in progress and would extend. As long as 1.1195 resistance turned support holds, we'll hold on to this bullish view and expect another to prior SNB imposed floor at 1.2000. Though, we'll reassess the outlook if 1.1195 is firmly taken out.
EUR/USD Daily Outlook
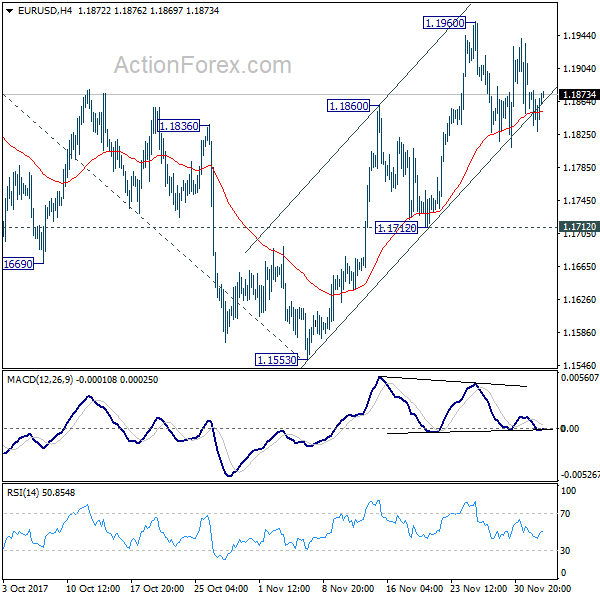
Daily Pivots: (S1) 1.1836; (P) 1.1857 (R1) 1.1886; More....
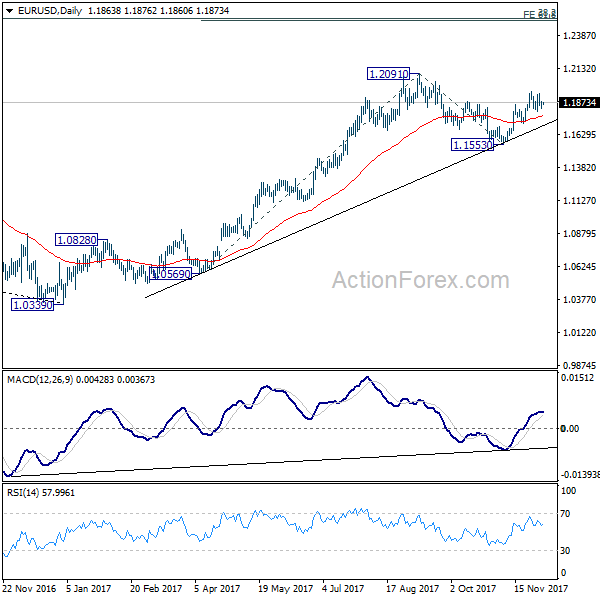
EUR/USD's consolidation from 1.1960 is still in progress and intraday bias remains neutral. With 1.1712 support intact, rise from 1.1553 is expected to resume later. Break of 1.1960 will turn bias to the upside for retesting 1.2091 high first. Break there will resume medium term up trend from 1.0339 and target 61.8% projection of 1.0569 to 1.2091 from 1.1553 at 1.2494, which is close to 1.2516 long term fibonacci level. We'd expect strong resistance from there to bring reversal. On the downside, break of 1.1712 will indicate completion of the rise from 1.1553 and turn near term outlook bearish.
In the bigger picture, rise from 1.0339 medium term bottom is seen as a corrective move for the moment. Therefore, in case of another rally, we'd be expect 38.2% retracement of 1.6039 (2008 high) to 1.0339 (2017 low) at 1.2516 to limit upside and bring reversal. Meanwhile, sustained trading below 55 week EMA (now at 1.1393) will suggest that such medium term rebound is completed and could then bring retest of 1.0339 low.