Sample Category Title
GOLD Riding Uptrend Channel
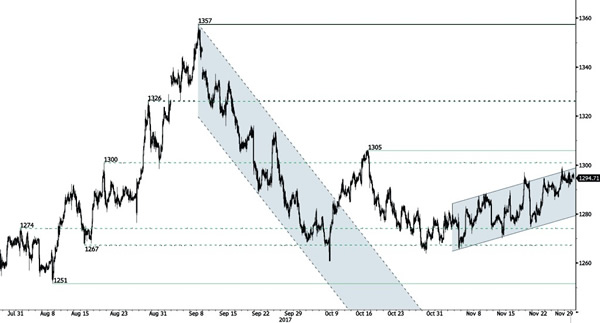
Gold is pushing higher. The technical structure confirms the end of the consolidation phase. Support lies at a distance at 1251 (08/08/2017 high). Resistance is located at 1288 (20/10/2017).
In the long-term, the technical structure suggests that there is a growing upside momentum. A break of 1392 (17/03/2014) is necessary ton confirm it, A major support can be found at 1045 (05/02/2010 low).
BITCOIN Mooning
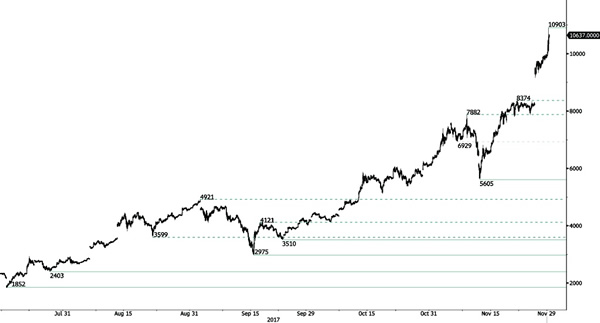
Bitcoin has jumped over the weekend. The technical structure shows a tremendous positive short-term momentum. Hourly support is located at 5605 (13/11/2017 low). Strong support stands very far at 2975 (22/08/2017 low). In the shortterm, the digital currency should continue rising above 10k.
In the long-term, the digital currency has had an exponential growth. There are decent likelihood that the asset will reach $40'000.
EUR/CHF Trading Below 1.17
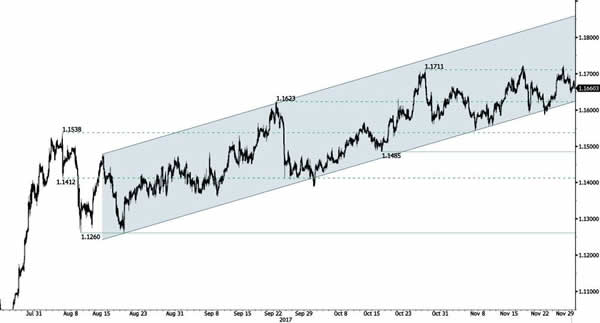
EUR/CHF continues to push towards resistance area above 1.17 and support given at 1.1610 (27/10/2017 low). Expected to show continued sideways move.
In the longer term, the technical structure has reversed. Strong resistance is given at 1.20 (level before the unpeg). Yet, the ECB's QE programme is likely to cause persistent selling pressures on the euro, which should weigh on EUR/CHF. Supports can be found at 1.0184 (28/01/2015 low) and 1.0082 (27/01/2015 low).
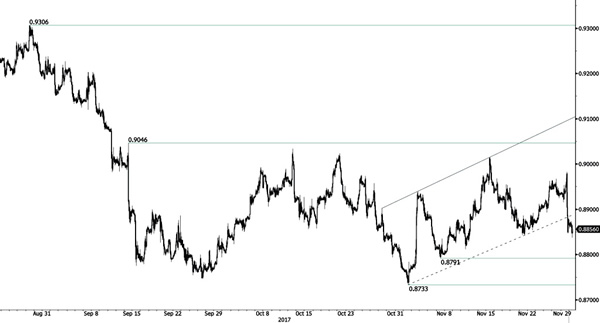
EUR/GBP Sharp Decline
EUR/GBP has collapsed unexpectedly despite the technical structure suggests further shortterm bullish momentum breaking hourly support at 0.8842 (21/11/2017 low). Next resistance is located at 0.8943 (27/11/2017 high).
In the long-term, the pair has largely recovered from recent lows in 2015. The technical structure suggests a growing upside momentum. The pair is trading above from its 200 DMA. Strong resistance can be found at 0.9500 (psychological level).
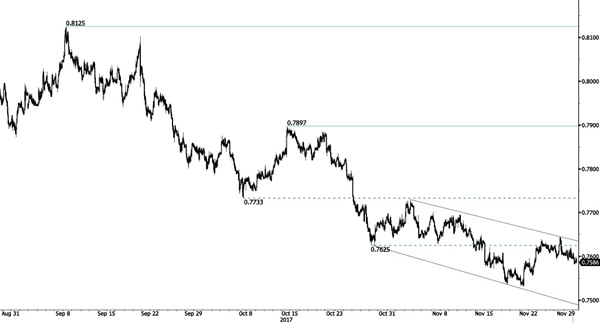
AUD/USD Riding Downtrend Channel
AUD/USD is ready to go even lower showing that downside pressures are still lively. Hourly resistance is given at a distance at 0.7897 (13/10/2017 high). Expected to show renewed pressures towards key support at 0.7535 (22/06/2017 low).
In the long-term, the trend is turning positive. Key supports stands at 0.6009 (31/10/2008 low) . A break of the key resistance at 0.8164 (14/05/2015 high) is needed to invalidate our long-term bearish view.
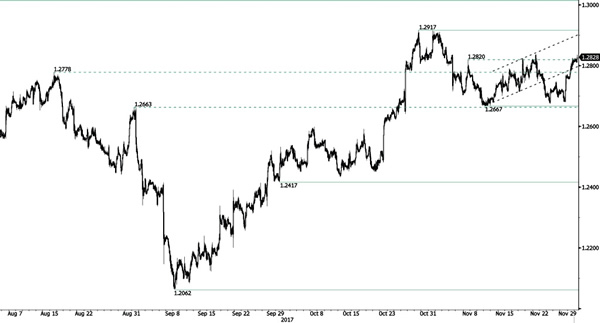
USD/CAD Pushing Higher
USD/CAD has broken hourly resistance can be found at 1.2837 (21/11/2017 high). Hourly support lies at 1.2667 (10/11/2017 low). Expected to show bearish pressures.
In the longer term, the pair has broken longterm support that can be found at 1.2461 (16/03/2015 low). Strong resistance is given at 1.4690 (22/01/2016 high). The pair is likely to head further lower.
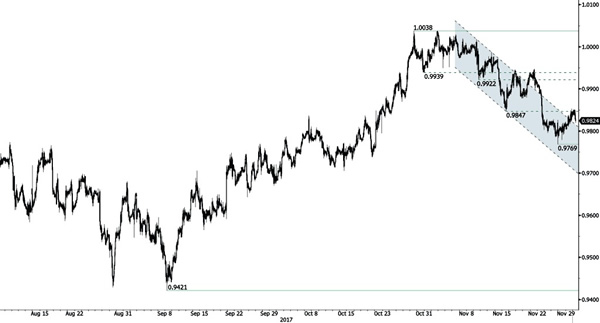
USD/CHF Ready For Another Downside Move
USD/CHF's technical structure is clearly bearish. The technical structure indicates further downside risks. The pair has failed to hold consistently above the parity. The road is wideopen for further decline.
In the long-term, the pair is still trading in range since 2011 despite some turmoil when the SNB unpegged the CHF. Key support can be found 0.8986 (30/01/2015 low). The technical structure favours nonetheless a long term bullish bias since the unpeg in January 2015.
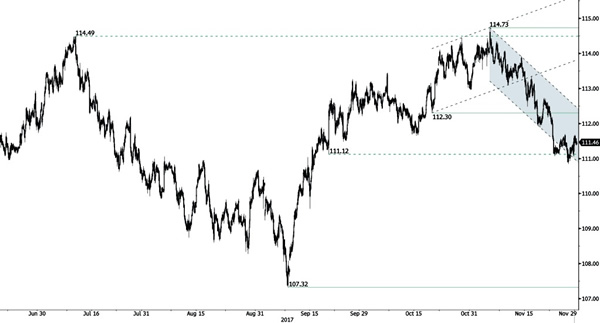
USD/JPY Holding Above 111.00
USD/JPY has broken short-term downtrend channel and strong support is located at 111.12 (20/09/2017 low). The road is wide open for further decline. Expected to decline below 111.00.
We favor a long-term bearish bias. Support is now given at 99.02 (10/08/2013 low). A gradual rise towards the major resistance at 125.86 (05/06/2015 high) seems unlikely. Expected to decline further support at 93.79 (13/06/2013 low).
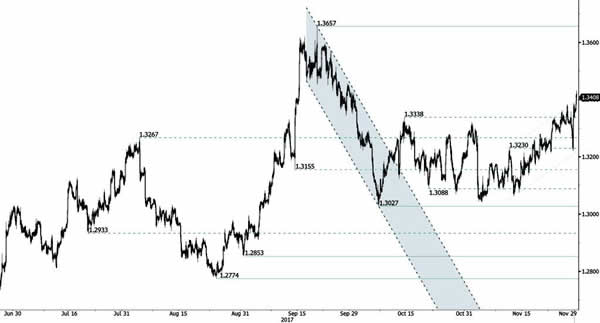
GBP/USD Strong Buying Demand
GBP/USD has been trading mixed over the past few days but the technical structure indicates an extension of bullish momentum. Support is given at 1.3027 (06/10/2017 low). Expected to show continued increase above former resistance at 1.3338 (13/10/2017 high).
The long-term technical pattern is reversing. The Brexit vote had paved the way for further decline. Long-term support can be found at 1.1841 (07/10/2017 low). Long-term resistance given around 1.35 is at stake and indicates a long-term reversal in the negative trend. Yet, it is very unlikely at the moment.
GBP/USD Elliott Wave Analysis
GBP/USD – 1.3408
Although cable retreated initially this week, renewed buying interest emerged at 1.3221 and the pair has surged again, adding credence to our bullish view that the erratic rise from 1.3027 is still in progress, hence upside bias remains for this move to extend further gain to resistance at 1.3455. Having said that, a sustained breach above this level is needed to suggest the correction from 1.3658 has ended at 1.3027 and bring subsequent rise to 1.3500-10 and then 1.3550-60.
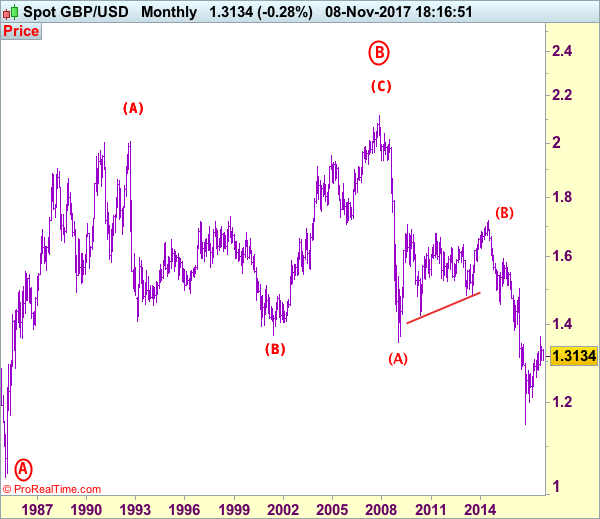
Our preferred count on the daily chart is that cable's rebound from 1.3500 (wave (A) trough) is unfolding as a wave (B) with A ended at 1.7043, followed by triangle wave B and wave C as well as wave (B) has possibly ended at 1.7192, below support at 1.4232 would add credence to this count, then further fall to 1.4000 level would follow but reckon downside would be limited to 1.3655 support and price should stay above previous support at 1.3500.
On the downside, whilst pullback to 1.3350-60 cannot be ruled out, reckon 1.3330-35 would limit downside and bring another rise later. Only below said support at 1.3221 would abort and signal top is formed instead, risk weakness to 1.3190-00, then towards 1.3140-50 but reckon downside would be limited to 1.3090-00 and support at 1.3062 should remain intact, bring another rebound later.
Recommendation: Buy at 1.3340 for 1.3540 with stop below 1.3240.
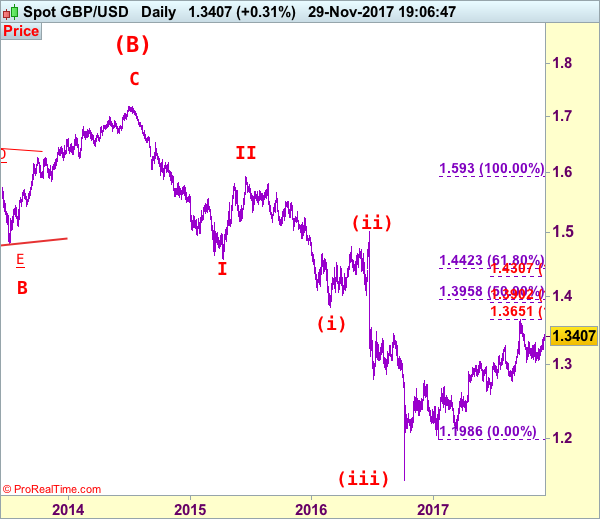
Longer term - Cable's rise from 1.0520 (Feb 1985) to 2.0100 (September 1992) is seen as [A], the decline to 1.3682 is labeled as (B) and (C) wave rally has ended at 2.1162 (9 Nov, 2007) which is also the top of larger degree wave B with circle. The selloff from there is a 5-waver with wave (A) ended at 1.3500 (23 Jan 2009), wave (B) itself is labeled as A: 1.6733, triangle wave B: 1.4813 and wave C as well as top of wave (B) ended at 1.7192 (2014), hence the selloff from there is an impulsive wave (C) with wave I : 1.4566, wave II 1.5930, an extended wave III is unfolding and already exceeded our downside target at 1.3500 and 1.3000, hence weakness to 1.2500 and possibly 1.2000 cannot be ruled out, however, price should stay well above psychological level at 1.0000.