Sample Category Title
EURJPY Expected To Remain In Medium-Term Range, Risk Tilted To Upside
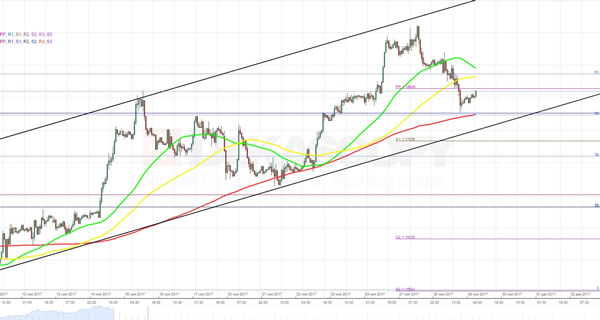
EURJPY has a more positive bias today after breaking above the shorter-period moving average (20-MA) on the 4-hour chart. There was a bullish crossover of the 20 with the 50-period MA.
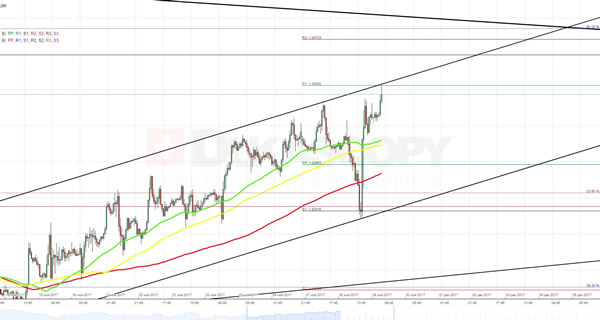
The pair's failure to make a sustained break below the bottom of the medium-term range at 131.50 has kept the market neutral in a sideways pattern since mid-September. The 134.50 level is capping EURJPY to the upside.
EURJPY appears well supported above 131.50 but upside momentum is relatively weak in the short-term, judging by the RSI on the 4-hour chart. There is scope for prices to push higher since risk is tilted to the upside. The target is 133.20, an important resistance area that held after being tested on November 24. A successful breach of this barrier would improve upside momentum and open the way towards 133.87. From here EURJPY could push higher towards the top of the range at 134.50 and then the odds would increase at this point for a resumption of the longer-term uptrend.
Alternatively, EURJPY may lose the current upside momentum and reverse back down towards the bottom of the range at 131.50. This level appears to provide firm support at the moment and thus more sideways trading is expected within the current range.
Technical Outlook: Spot Gold – Directionless N/T Action Eyes US Data / Fed Yellen’s Speech For Fresh Signals
Spot Gold made no reaction on North Korea's latest missile launch, staying in directionless mode for the second day.
A batch of data from the US are due today and along with speech of Fed's chair Janet Yellen, expected to provide more clues about trajectory of US central banks monetary policy.
From the technical point of view, outlook remains positive on firm bullish setup of daily studies. However, Monday's strong upside rejection at $1299 and yesterday's Doji candle, could early signs of stall.
Broken base of widening daily cloud offers solid support at $1288, which is expected to hold keep alive hopes of fresh upside and possible test of daily cloud top ($1309) break of which could trigger further bullish acceleration.
Conversely, close below daily cloud base would generate negative signal and risk fresh weakness.
Res: 1297, 1300, 1306, 1309
Sup: 1292, 1288, 1286, 1282
Technical Outlook: WTI OIL – Weak Tone On Surprise Oil Stocks Rise, OPEC Meeting In Focus
WTI oil stands at the back foot on Wednesday but holding above previous day’s low at $57.41. Oil price remains under pressure on concerns whether major oil exporters will reach a deal about extending current output cut beyond March 2018.
Additional pressure came from unexpected rise in US crude stocks after API report on Tuesday showed build in crude inventories by 1.82 million barrels, compared to forecasted draw of 2.5 million barrels.
Focus turns towards EIA crude inventories report due later today and forecasted for 2.3 million barrels draw, compared to 1.8 million barrels draw last week.
Another surprise could push oil price below strong support at $57.41 (Fibo 38.2% of $54.80/$59.02 upleg, reinforced by rising 10SMA) which for now holds pullback from 2 ½ year high at $59.02.
Break of $57.41 would open daily Tenkan-se ($57.09) and $56.41 (Fibo 61.8% of $54.80/$59.02) in extension.
Outcome of OPEC meeting tomorrow would provide more clues about near-term direction.
Res: 57.80, 58.02, 59.02, 59.82
Sup: 57.41, 57.09, 56.91, 56.41
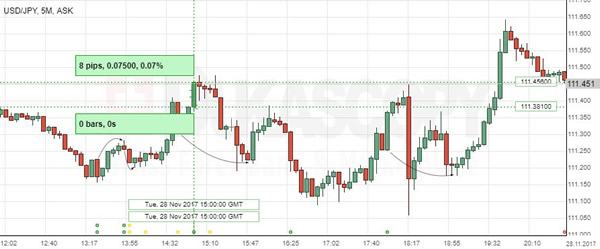
USDJPY: US CB Consumer Confidence
The US Dollar strengthened against the Japanese Yen on a strong enhancement in the US consumer confidance. The USD/JPY exchange rate increased 8 pips or 0.07% to reveal high volatility on a trading session, targeting the 111.65 area.
The Conference Board revealed that the Consumer Confidence Index for the US rose to the 129.5 mark in November, reaching the highest level in 17 years. The strong increase mostly reflected households’ optimistic perceptions of the job market. Economists noted that bullish consumers in conjunction with tight job market were reasonable grounds for the Fed to make the interest rate hike in December, despite worries over persistently low consumer inflation growth.
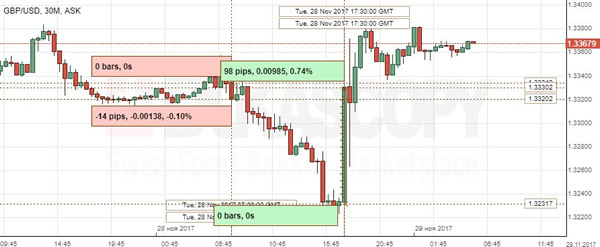
GBP/USD: BoE Stress Test Results
The Sterling weakened against the US Dollar on the Bank of England report showing its stress test results for this year. Britain’s biggest lenders all passed the BOE yearly stress tests ever since they were introduced in 2014, the country’s Central Bank stated, adding that major banks would continue to contribute to the real economy even in the case of 'disorderly' quit from the European Union.
GBP/USD jumped almost 100 base poins at 17:30 GMT on the news agencies’ reports that the EU and British negotiators reached an agreement on the Brexit bill. Then, the UK government official noted that source’s account on the matter was not recognised, but another newspaper confirmed the initial report, keeping the pair nearing 1.3380.
XAU/USD Analysis: Forms Minor Symmetrical Triangle
The second half of previous trading session the rate spent in horizontal movement. A release of better than expected US consumer sentiment data pushed it to the bottom, while another launch of ICBM by North Korea gave a reason to continue the surge. Technically, the southern side was protected by the 55- and 100-hour SMAs that are lying along the lower support line of the rising wedge formation, while the northern side contained the weekly and monthly R1. Although the pair has formed a minor symmetrical triangle, it is still expected to make a breakout to top. This assumption is based on market sentiment, which is 52% bullish as well as dominance of the larger pattern. However, there is a need to notice that release of the US Prelim GDP can lead to short-term strengthening of the buck.
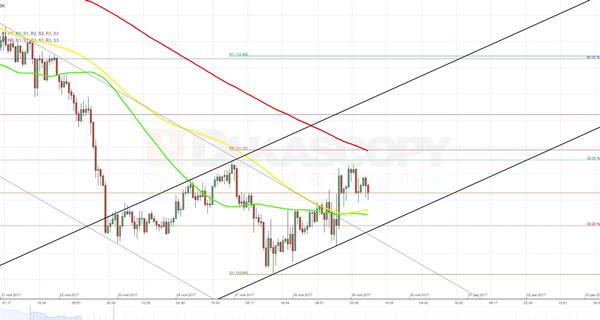
USD/JPY Analysis: Breaks Two-Week Long Channel Down
For the first time in many weeks, reports about another ballistic missile launch made by North Korea did not led to appreciation of the Yen. The news from Asia most probably was beat by a series of positive news coming from the United States. From technical point of view, strengthening of the buck led to breakout through strong resistance formed by the upper boundary of a descending channel together with the 55- and 100-hour SMAs. Although certain signs point out on formation of a new ascending channel, this view might be premature, as further path to the north is obstructed by resistance zone surrounding the 38.2% Fibonacci retracement level at 111.65 as well the weekly PP at 111.78 that is backed up by the 200-hour SMA. In other words, today the pair is likely to plunge back to 111.20.
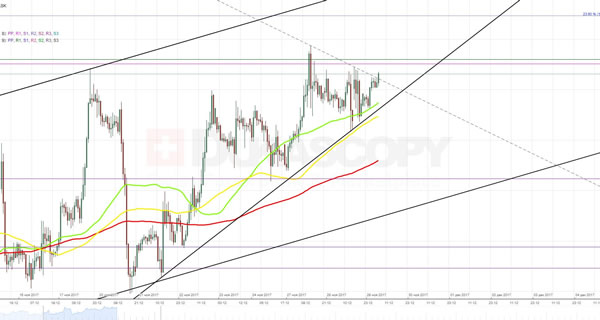
GBP/USD Analysis: Jumps By 1.1% Amid Progress In UK And EU Talks
As it was warned yesterday, publication of encouraging news from the United States one after another led to notable appreciation of the buck whose surge was stopped only is support zone located around the weekly S1 at 1.3231. Since the rebound was based on reports that Britain has finally managed to reach a deal with the European Union, the Pound advanced by 1.1% just in three hour and ended the day at previously mentioned 1.3380 resistance level. Although volatility was high, it did not lead to dissolution of the channel. In contrast, it forced only to adjust its boundaries. As a result, during this session bulls are expected to continue trying to push the cable to the weekly R1 at 1.3406. But as this indicator crosses upper trend-line of the pattern, a new rebound is expected to follow.
EUR/USD Analysis: Falls To 1.1836 Amid Progress On Tax Reform
In line with forecasts, an improvement in consumers’ sentiment dragged the pair to the weekly PP at 1.1864, while the subsequent news that two hesitating senators agreed to join other Republicans to support tax reform pushed the pair even further to the monthly R1 at 1.1826. As this barrier is located slightly above the bottom boundary of an ascending channel and is additionally supported by the 200-hour SMA, the pair is expected to make a fully-fledged rebound and start surging back to the 1.1910 and then 1.1960 levels. However, a resistance posed by the weekly PP as well as concentration of the 55- and 100-hour SMAs near the 61.8% retracement level at 1.1890 suggests that the rate is likely to make one more turnaround especially if it matches with release of info on the US Prelim GDP.
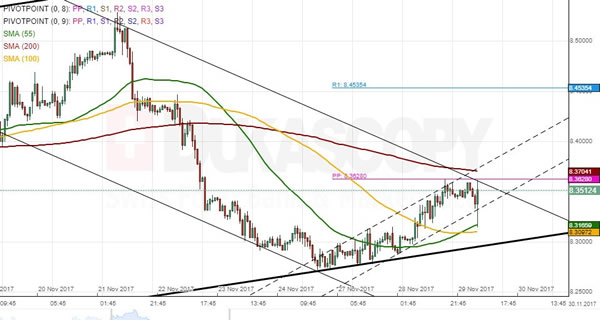
USD/SEK 1H Chart: Rate Pressured By SMAs
The US Dollar has been appreciating against the Swedish Krona in an ascending channel since late August. After failing to reach its upper boundary on November 21, the Greenback initiated a new wave down. Meanwhile, the lower boundary of the senior channel was tested for two consecutive sessions. The rate, however, managed to edge slightly higher until the weekly PP at 8.3628 was reached. Currently, the pair is located between the 55-, 100– and 200-hour SMAs. The pressure from both barriers might force it to move sideways. Its subsequent movement, however, is expected to be south and past the bottom boundary of the senior channel. In case this scenario occurs, this might mark a period of depreciation for the pair until some weekly or monthly pivot points halt this bearish momentum (both types of pivot points are to change at the end of this week, thus a specific downside target cannot be set).