Sample Category Title
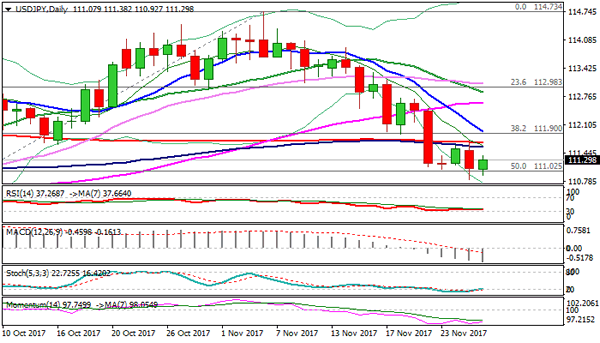
Technical Outlook: USDJPY – Strong Hesitation At 111.02 Fibo Support Could Result In Extended Consolidation
The pair shows strong hesitation at 111.02 support (50% of 107.31/114.73 rally) which was repeatedly cracked (dips to 110.83/92 on Mon/Tue) but so far without clear break lower. Near-term action may hold in extended consolidation above 111.02 pivot, as slow stochastic is reversing from oversold territory and generating bullish signal. However, limited upside is expected (ideally to be capped by 200SMA (111.68) to keep bearish bias intact. Bears need sustained break below 111.02 to signal resumption and expose targets at 110.70 (daily cloud base) and 110.15 (Fibo 61.8% of 107.31/114.73). Only extension and close above daily cloud top (112.16) would neutralize downside risk and signal stronger correction.
Res: 111.38, 111.70, 112.16, 112.62
Sup: 111.02, 110.83, 110.70, 110.15
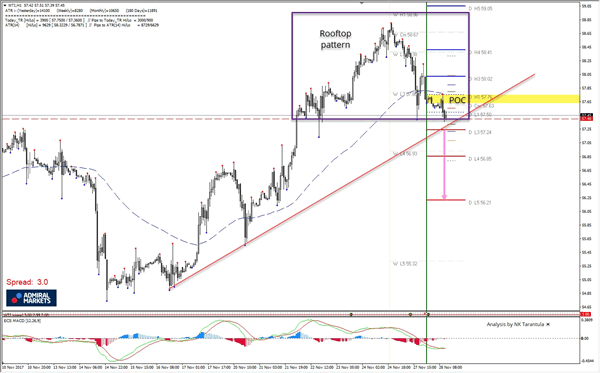
WTI Rooftop Pattern Continuation If D L3 Breaks
The WTI, went as planned as we could have seen in my previous analysis. Today we can see a rooftop pattern shaping up that is coming from W H1/D H5 confluence, and it is being held slightly above D L3 camarilla pivot. We can see the rooftop shape an need to be ready if breakout happens. For positional trades watch for POC zone 57.60-57.85 where the price could reject after a retracement. Breakout below D L3 and 4h close below 57.24 should make a continuation move towards 56.78 (ATR projection low) and 56.21 D L5 level.
W H3 - Weekly Camarilla Pivot (Weekly Interim Resistance)
W H4 - Weekly Camarilla Pivot (Strong Weekly Resistance)
D H4 - Daily Camarilla Pivot (Very Strong Daily Resistance)
D L3 – Daily Camarilla Pivot (Daily Support)
D L4 – Daily H4 Camarilla (Very Strong Daily Support)
POC - Point Of Confluence (The zone where we expect price to react aka entry zone)
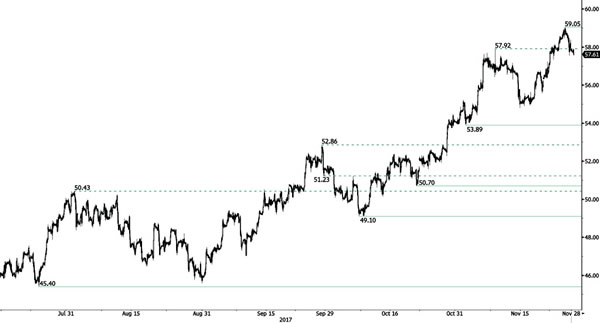
CRUDE OIL Bearish Retracement
Crude oil has finished its consolidation and is now ready to challenge the 60-dollar level. Expected to show continued increase. Support is given at a distance at 54.81 (14/11/2017 low)
In the long-term, crude oil has recovered after its sharp decline last year. However, we consider that further weakness are very likely. For the time being the pair lies in an upside momentum. Strong support lies at 35.24 (05/04/2016) while resistance can now be found at 55.24 (03/01/2017 high).
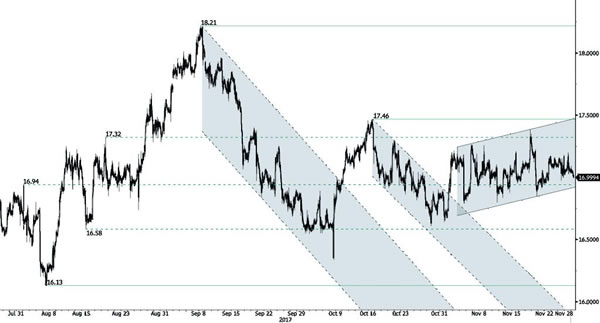
SILVER Monitoring Uptrend Channel
Silver is heading higher. Hourly support can be found at 16.60 (27/10/2017 low). Hourly resistance is given at 17.46 (13/10/2017 high). Additional support can be found at 16.13 (06/10/2017 low).
In the long-term, the trend is rater negative. Further downsides are very likely. Resistance is located at 25.11 (28/08/2013 high). Strong support can be found at 11.75 (20/04/2009).
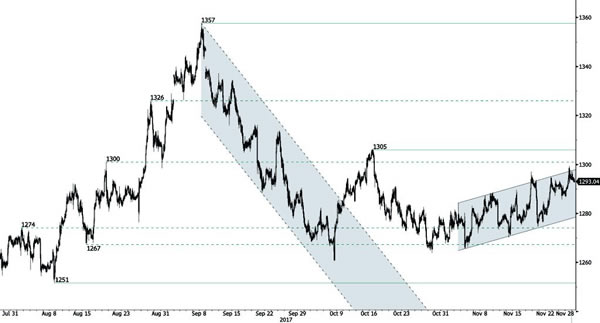
GOLD Riding Uptrend Channel
Gold is pushing higher. The technical structure confirms the end of the consolidation phase. Support lies at a distance at 1251 (08/08/2017 high). Resistance is located at 1288 (20/10/2017).
In the long-term, the technical structure suggests that there is a growing upside momentum. A break of 1392 (17/03/2014) is necessary ton confirm it, A major support can be found at 1045 (05/02/2010 low).
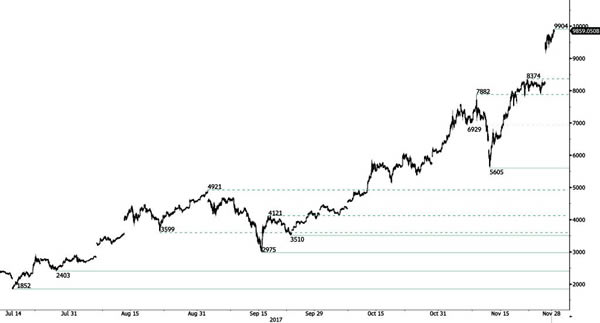
BITCOIN Stalling Below 10k
Bitcoin has jumped over the weekend. The technical structure shows a tremendous positive short-term momentum. Hourly support is located at 5605 (13/11/2017 low). Strong support stands very far at 2975 (22/08/2017 low). In the shortterm, the digital currency should continue rising above 10k.
In the long-term, the digital currency has had an exponential growth. There are decent likelihood that the asset will reach $40'000.
EUR/CHF Trading Around 1.17
EUR/CHF is trading slightly higher towards resistance area above 1.17 and support given at 1.1610 (27/10/2017 low). Expected to show continued sideways move.
In the longer term, the technical structure has reversed. Strong resistance is given at 1.20 (level before the unpeg). Yet, the ECB's QE programme is likely to cause persistent selling pressures on the euro, which should weigh on EUR/CHF. Supports can be found at 1.0184 (28/01/2015 low) and 1.0082 (27/01/2015 low).
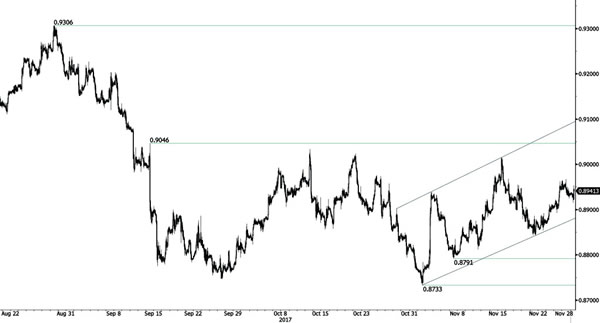
EUR/GBP Bullish Momentum Continues To Build
EUR/GBP has broken rising trendline, yet technical structure suggests further short-term bullish momentum. Hourly support is given at a distance at 0.8842 (21/11/2017 low). Next resistance is located at 0.8943 (27/11/2017 high).
In the long-term, the pair has largely recovered from recent lows in 2015. The technical structure suggests a growing upside momentum. The pair is trading above from its 200 DMA. Strong resistance can be found at 0.9500 (psychological level).
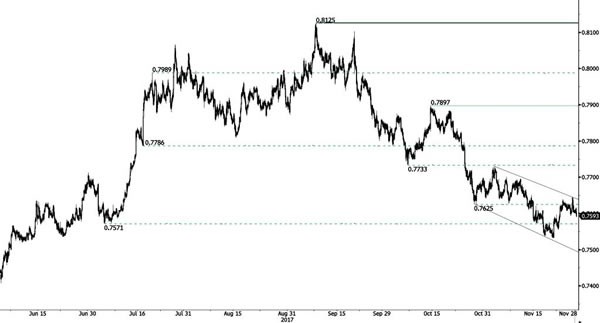
AUD/USD Riding Downtrend Channel
AUD/USDis ready to go even lower showing that downside pressures are still lively. Hourly resistance is given at a distance at 0.7897 (13/10/2017 high). Expected to show renewed pressures towards key support at 0.7535 (22/06/2017 low).
In the long-term, the trend is turning positive. Key supports stands at 0.6009 (31/10/2008 low) . A break of the key resistance at 0.8164 (14/05/2015 high) is needed to invalidate our long-term bearish view.
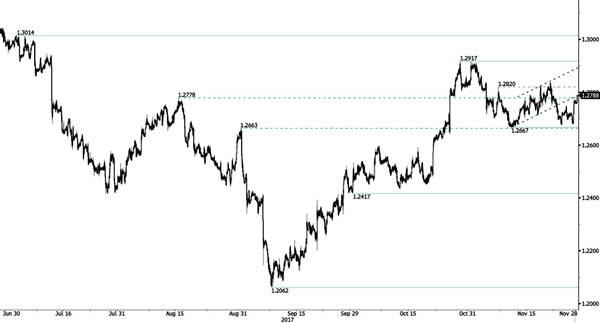
USD/CAD Sideways Price Action
USD/CAD has failed to clear resistance indicating downside risks. Hourly resistance can be found at 1.2837 (21/11/2017 high). Hourly support lies at 1.2667 (10/11/2017 low). Expected to show bearish pressures.
In the longer term, the pair has broken longterm support that can be found at 1.2461 (16/03/2015 low). Strong resistance is given at 1.4690 (22/01/2016 high). The pair is likely to head further lower.