Sample Category Title
Central Bank Speeches In The Spotlight On Tuesday
A mixture of economic data and monetary policy will drive the financial markets on Tuesday, giving investors plenty of factors to consider in implementing their daily portfolios.
The day begins at 07:00 GMT with a report on German consumer confidence courtesy of GfK. The consumer confidence index is expected to register 10.8 in December after hitting 10.7 the previous month.
Developments out of the United Kingdom will also make headlines Tuesday, beginning with the Bank of England’s Bank Street Stress Test results. At the same time, the BOE will unveil its latest Financial Stability Report, which provides an outlook on the banking sector’s stability and resilience in the face of adverse risks.
At 07:30 GMT, BOE Governor Mark Carney will deliver a speech that will be closely scrutinized by the financial markets. The Bank’s Monetary Policy Committee (MPC) voted to raise interest rates at its most recent meeting in an effort to keep inflation under control.
Shifting gears to North America, reports on the US goods trade balance and home values will make headlines through the early morning session. The Federal Reserve Bank of Richmond will also unveil its latest manufacturing index for the month of November.
The US policy wire will be highly active on Tuesday, with central bank members William Dudley, Patrick Harker and Jerome Powell scheduled to give remarks. Powell was recently chosen by President Donald Trump to head the all-powerful Fed once Janet Yellen’s term expires in February.
North of the border, the Bank of Canada (BOC) will release its Financial System Review, which provides a detailed breakdown of financial sector developments. Central bank governor Stephen Poloz will deliver a speech at 16:15 GMT.
The US dollar index posted modest gains at the start of the week, and was last seen trading steady at 92.91. The dollar index is weighed against a basket of six currencies, including the euro, pound, franc, yen, Swedish krona and Canadian dollar.
EUR/USD
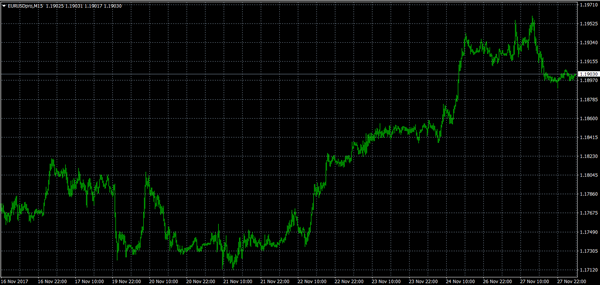
The euro pivoted sharply lower on Monday, with prices falling back toward 1.1900 US. The EUR/USD remains well supported, although gains north of 1.2000 are proving difficult. The 1.1875 level continues to offer strong support.
GBP/USD
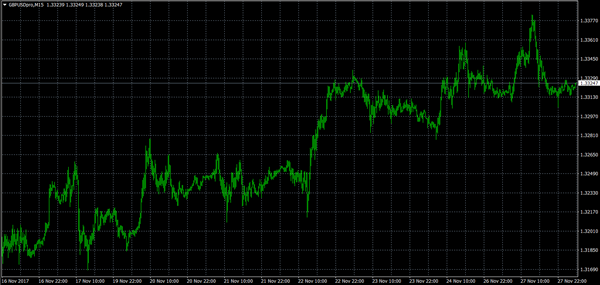
Cable touched a session high of 1.3377 before giving back most of its gains later in the day. GBP/USD remains well supported north of 1.3300, with the bulls eyeing a sustained rally north of 1.3350 for confirmation of further upside.
USD/CAD
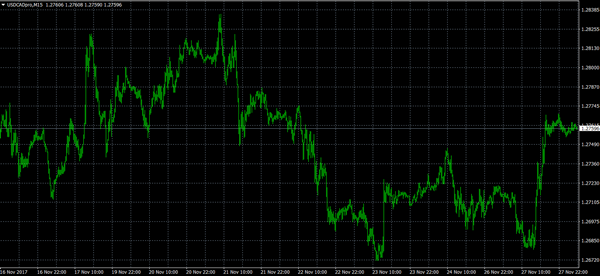
The US dollar shot up against its northern rival on Monday as oil prices struggled to resume their upward pace. The USD/CAD exchange rate was last seen trading at 1.2761 following an 80-pip rally at the start of the week. The gain pushed the pair outside of a fairly established trading range, leaving room for further upside in the short run
USD/JPY Elliott Wave Analysis
USD/JPY - 111.27
USD/JPY – Wave V of larger degree circle V has possibly ended at 75.31 and major correction has commenced and already met indicated target at 125.00.
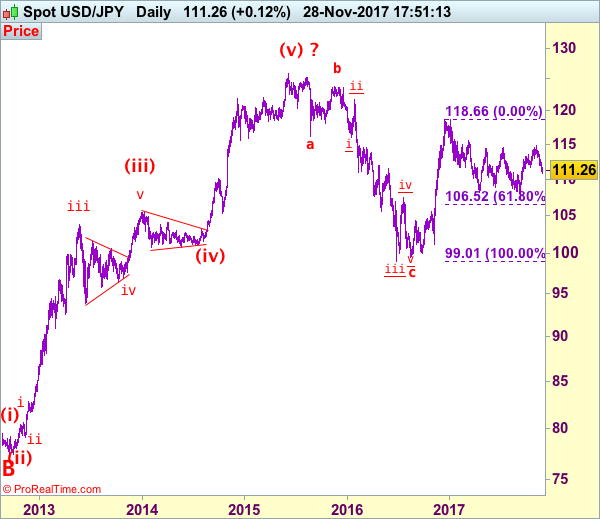
Dollar’s stronger-than-expected retreat from 114.74 signals top has been formed there, this also indicate at least the first leg of correction from 107.32 has ended there, hence consolidation with mild downside bias is seen for weakness to 110.50, then 110.00, however, near term oversold condition should prevent sharp fall below support at 109.55 and reckon 109.00 would hold from here, risk from there is seen for another rebound to take place later next month.
Our preferred count is that, triangle wave IV (with circle) ended at 101.45 and the circle wave V brought dollar down to the record low of 75.31 in 2011 and the subsequent rebound signal major correction has commenced with A leg ended at 84.19, followed by wave B at 77.14 and impulsive wave C is now unfolding (indicated upside target at 125.00 had been met) for gain towards 127.00 level. In the event dollar drops below support at 99.01, this would confirm medium term decline from 125.86 top (2015 high) has resumed for subsequent weakness to 98.00 and possibly 97.00.
Under this count, this wave C is unfolding as impulsive waves with (1) (2), 1 2 ended at 80.67, 79.07, 82.84 and 81.69 respectively, hence the extended wave 3 has ended at 103.74 and wave 4 correction of recent upmove should bring weakness to 92.57, then towards 90.88 but psychological support at 90.00 should limit downside and bring another rally later in wave 5, indicated target at 125.00 had been met and gain to 127.00 cannot be ruled out but reckon price would falter below 130.00.
On the upside, whilst initial recovery to 111.65-70, then 112.10-20 cannot be ruled out, reckon 112.65-70 would limit upside and bring another decline later. Only a daily close above previous support at 113.09 (now resistance) would abort and signal the retreat from 114.74 has ended instead, bring further gain to 113.50-60 and then 113.91 resistance. A daily close above this level is needed to retain bullishness and signal the pullback from 114.74 has ended, bring further gain to 114.05-10, then retest of 114.74 which is likely to hold from here. Looking ahead, above said resistance at 114.74 would extend recent upmove to 115.00, break there would signal the correction from 118.66 top has ended earlier at 107.32 and the rise from there may bring further gain to previous resistance at 115.51.
Recommendation: Sell at 112.50 for 110.50 with stop above 113.50
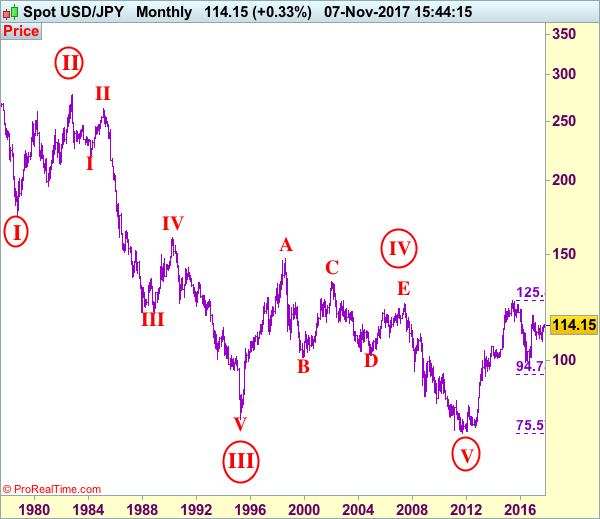
On the monthly chart, we have changed our preferred count that an impulsive wave is unfolding with major wave III with circle ended at 79.75, then followed by wave IV with circle and is labeled as a triangle with A: 147.64 (11 August, 1998), B: 101.25, C: 135.20, D: 101.67 and E leg ended at 124.14 to end the wave IV with circle. Hence, wave V with circle commenced from there and hit a record low of 75.31, however, the subsequent strong rebound signals this circle wave V has possibly ended there, hence gain to (indicated upside target at 122.00 and 125.00 had been met), the retreat from 125.86 suggests wave A of major correction has ended there and wave B correction back to 99.00, then 95.00 would be seen, however, reckon downside would be limited to 90.00, bring another rebound in wave C next year.
Trade Idea: EUR/JPY – Stand aside
EUR/JPY - 132.37
New strategy :
Stand aside
Position: -
Target: -
Stop:-
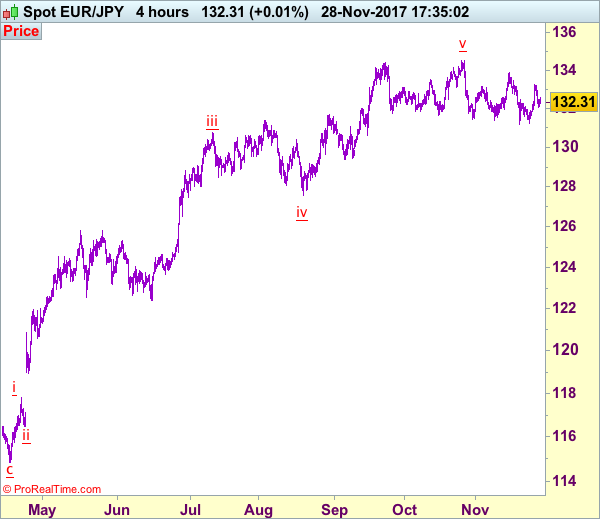
Despite staging a strong rebound to 133.24 late last week, lack of follow through buying and the subsequent retreat suggest further choppy consolidation would be seen and pullback to 131.90-00 cannot be ruled out, however, support at 131.17 (last week’s low) should remain intact, bring another rebound later. In case euro drops below 131.17 support, this would signal the fall from 134.50 top has resumed, then this erratic decline may extend weakness to 130.60-65 and possibly towards psychological level at 130.00 which is likely to hold from here.
On the upside, expect recovery to be limited to 132.75-80 and said resistance at 133.24 should remain intact, bring another retreat later. Only break of resistance at 132.47 would abort and signal a temporary low has been formed at 131.17, bring further gain to 133.15-20 but break there is needed to signal the entire correction from 134.50 top has ended, bring further gain to 133.50, then towards resistance at 133.89 (last week’s high) which is expected to cap euro’s upside. As near term outlook is mixed, would be prudent to stand aside for now.
Our latest preferred count is that wave (ii) is ABC-X-ABC which ended at 123.33 and wave (iii) is unfolding with wave iii ended at 100.77, followed by wave iv at 111.57 and wave v as well as the wave (iii) has ended at 97.04, followed by wave (iv) at 111.43 and wave (v) has ended at 94.12 which is also the end of the larger degree v, this also implied the major wave (C) has also ended there, hence major correction has commenced from there with (A) leg unfolding in its lower degree wave c which has possibly ended at 145.69. Under this count, A-B-C wave (B) has commenced with A leg ended at 136.23, wave B at 143.79 and wave C has possibly ended at 149.79.
Our larger degree count is that the decline from 139.26 is wave (C) and is sub-divided into a diagonal triangle i-ii-iii-iv-v with wave i - 105.44, wave ii- 123.33, wave iii - 97.03, wave iv - 111.43, followed by the final wave v as well as the end of wave (C) at 94.12, this also mark the bottom of larger degree wave B. Under this count, major rise in wave C has commenced as an impulsive wave with minor wave III ended at 145.69, wave V is still in progress for further gain to 150.00. Having said that, this so-called wave V could well be the first leg of larger degree 5-waver wave C and this wave C should bring at least a retest of wave A top at 169.97 (July 2008).
Technical Outlook: EURUSD – Corrective Dips Seen As Opportunity To Rejoin Bulls For Attack At 1.2000 Target
The Euro extended easing from Monday's high at 1.1961 where bulls stalled, shy of initial Fibo 76.4% target at 1.1965.
Corrective easing could be seen as buying opportunity for eventual attack at psychological 1.2000 barrier, as overall structure is firmly bullish and shows scope for full retracement of 1.2092 / 1.1553 descend.
Correction on overbought daily studies faces solid support at 1.1877 (daily cloud top) with deeper dips to be contained at 1.1830 zone (cloud base / rising 10SMA) before broader bulls resume.
Conversely, deeper correction towards daily Kijun-sen (1.1757), could be expected on close below daily cloud.
Res: 1.1920, 1.1965, 1.2000, 1.2033
Sup: 1.1885, 1.1877, 1.1830, 1.1776
Trade Idea: AUD/USD – Stand aside
AUD/USD – 0.7594
Original strategy:
Exit short entered at 0.7620
Position: - Short at 0.7620
Target: -
Stop:-
New strategy :
Stand aside
Position: -
Target: -
Stop:-
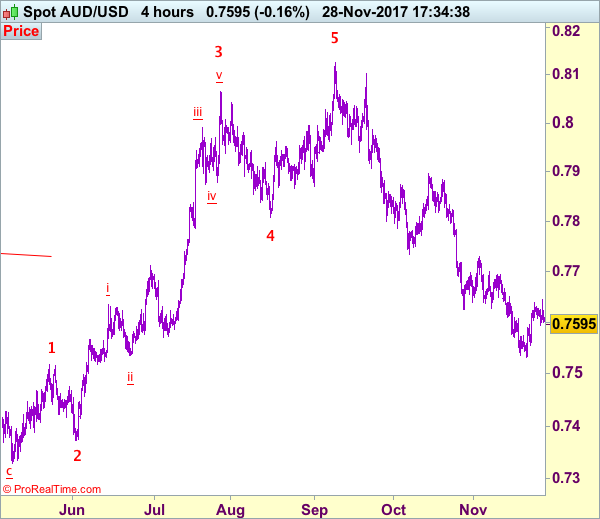
As aussie has retreated after meeting resistance at 0.7645, suggesting consolidation with mild downside bias would be seen and pullback to 0.7550-55 cannot be ruled out, however, break there is needed to signal the rebound from 0.7532 (last week’s low) has ended, bring retest of this level later, break there would extend recent decline from 0.8125 top for further weakness to 0.7500, then 0.7470.
On the upside, expect recovery to be limited to 0.7620-25 and said resistance at 0.7645 should remain intact, bring retreat later. A break of said resistance at 0.7645 would extend the corrective bounce from 0.7532 (last week’s low) for retracement of recent decline to 0.7670, then towards resistance at 0.7701 which is likely to hold from here. As near term outlook is mixed, would be prudent to stand aside for now.
On the 4-hour chart, recent upmove from 0.7329 is unfolding as an impulsive rise with wave 3 as well as smaller degree wave (iii) extending, only minor wave v of (iii) has ended at 0.8125, hence bullishness remains for this move to extend headway to 0.8200, then towards 0.8300, however, reckon upside would be limited to 0.8400 and the final wave 5 should falter below 0.8500, bring correction later.
EUR/AUD 1H Chart: Euro Consolidates Near Channel
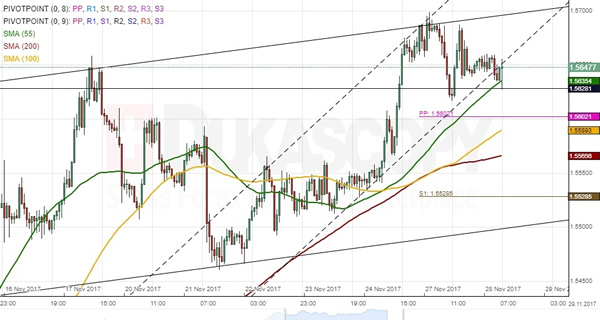
After breaching a seven-month channel on November 14, the common European currency began trading in a flat channel up. The pair tested its upper boundary circa 1.57 early on Monday, but has nevertheless failed to move lower, as the significant support formed by the monthly R2, the weekly PP and the 55-, 100– and 200-hour SMAs is restricting the pair in the 1.5630/1.5565 area. From technical point of view, the pair should initiate a new wave down, especially if the one-week channel up drawn with dashed lines is breached within the upcoming hours. However, given the strength of the nearest support cluster, the pair might fail to breach it at once and thus continue its consolidation phase. The pair, however, should eventually edge lower.
GBP/JPY 1H Chart: Wedge Near Maturity
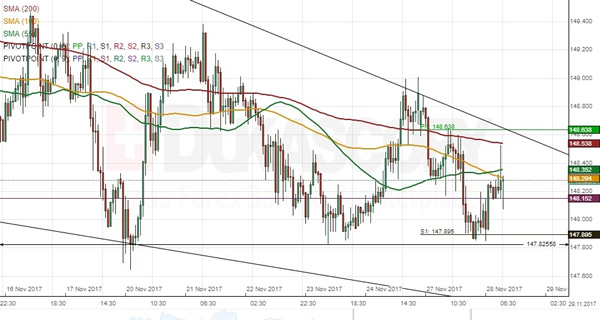
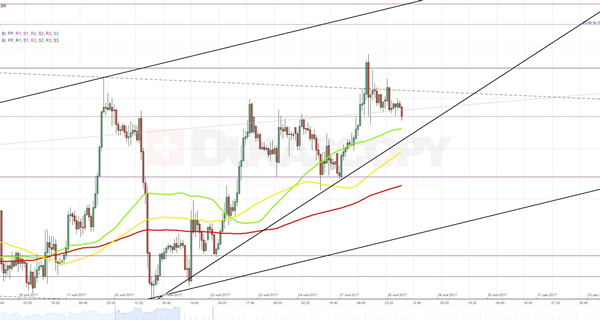
GBP/JPY is trading in a three-month descending triangle and a junior falling wedge which was formed on October 20. If looking at the current situation, the Pound is facing the combined resistance of the 100-, 55– and 200-hour SMAs and the weekly PP in the 148.30/65 area. This area coincides with the upper boundary of the wedge. Technical indicators suggest that the bearish sentiment might prevail in the market during this session. This might push the pair down to the lower triangle boundary circa the psychological 147.00 mark. Subsequently, both patterns point to a surge in the medium term, as it is more likely that the wedge is breached to the upside. The nearest northern target for this week could be the weekly R1 and the monthly PP circa 149.70. The latter , however, will change on Friday as a new month is to start.
XAUUSD Analysis: Forms Rising Wedge
The gold continued to rally against the buck on Monday. In result of the seven-hour surge, the pair managed to reach combined resistance formed by the monthly and weekly R1 at 1,297.00-1,298.00 and confirmed an assumption about transformation of the channel into the rising wedge formation. The appearance of new pattern only additionally confirmed that bulls are trying to push the rate to the 1,302.00 level. As that area is protected by the 23.6% Fibonacci retracement level, the pair is expected to make a fully-fledged rebound. However, in shorter perspective there is need to take into account that Trump’s meeting with Senate Republicans regarding prospects of tax reform as well as Powell’s appearance before Congress are likely to lead to strengthening of the buck and retreat to 1,292.00.
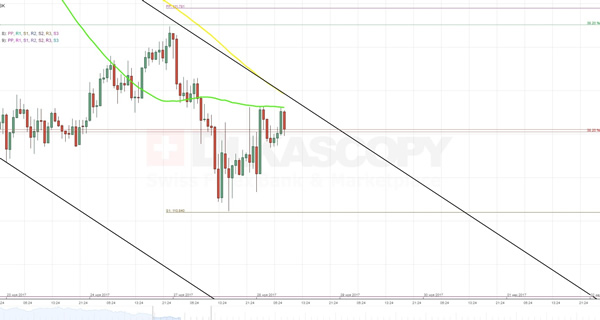
USDJPY Analysis: Approaches Combination Of MAs
After making a rebound from the upper edge of the currently active descending channel, the pair slipped through the 38.2% Fibonacci retracement level and landed on the weekly S1 at 110.84. As early hours of the current trading session did not bring any significant news, the pair made a rebound and approached the upper trend-line for the second time. As the boundary is secured by the falling 55- and 100-hour SMAs, it is unlikely that bulls will manage to break the pattern. On the other hand, a reaction on various events in the United States might lead to short-term spike to the 111.60 level. However, even in case this scenario materializes, the general downtrend should not be affected due to resistance formed by the 100- and 200-day SMAs that are explicitly seen on daily chart.
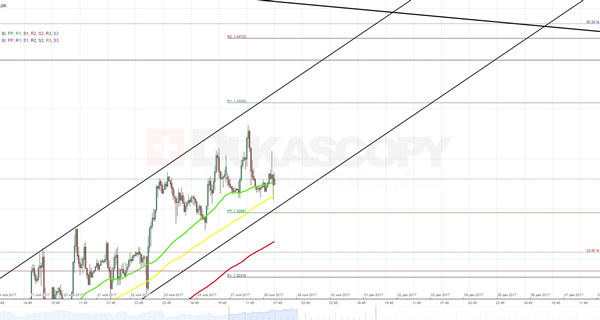
GBPUSD Analysis: Expectedly Rebounds From 1.3380
During previous trading session the cable surged to resistance zone located at 1.3370-1.3380 and then pulled back to the 1.3220. The plunge once again was stopped by a combination of the 55- and 100-hour SMAs, which are lying along the bottom boundary of an ascending channel. For now, such soars and retreats were proofed to be successful. Today, the rate is likely to try to plummet to the weekly PP amid the Governor Powell’s testimony before Congress and Trump’s meeting with Senate Republicans about adoption of the new tax reform. However, neither of these events is expected to stop the rate in medium perspective from reaching and making a rebound from the upper boundary of a long-term dominant descending channel near 1.3400.