Sample Category Title
SPOT GOLD – Eventual Break into Daily Cloud Signals Further Upside
Spot Gold price maintains firm tone on Tuesday and holding near fresh high at $1299 (the highest since mid-October).
The yellow metal's price eventually broke into thickening daily cloud (spanned between $1289 and $1309) after cloud base repeatedly capped upside attempts last week.
Sentiment remains positive for further advance as concerns over the pace of rate hikes and US tax overhaul continues to weigh on the greenback.
Bullish setup of daily techs also supports, with today's formation of 10/55SMA bull-cross, additionally supporting.
Bulls eye cracked pivot at $1297 (Fibo 38.2% of $1357/$1260 descend) and psychological $1300 barrier, break of which would open way towards next key point at $1309 (daily cloud top). Broken cloud base ($1289) marks key support and is expected to limit downside attempts.
Res: 1297; 1300; 1306; 1309
Sup: 1292; 1289; 1286; 1282

Trade Idea Wrap-up: EUR/USD – Buy at 1.1845
EUR/USD - 1.1884
Most recent candlesticks pattern : N/A
Trend : Near term up
Tenkan-Sen level : 1.1898
Kijun-Sen level : 1.1918
Ichimoku cloud top : 1.1922
Ichimoku cloud bottom : 1.1897
Original strategy :
Buy at 1.1845, Target: 1.1945, Stop: 1.1810
Position : -
Target : -
Stop : -
New strategy :
Buy at 1.1845, Target: 1.1945, Stop: 1.1810
Position : -
Target : -
Stop : -
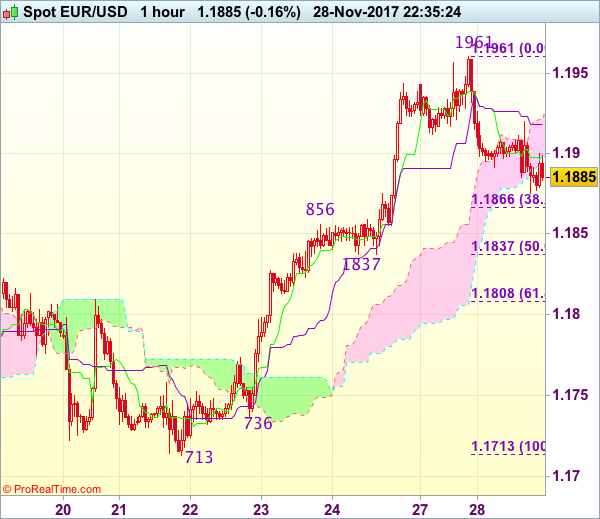
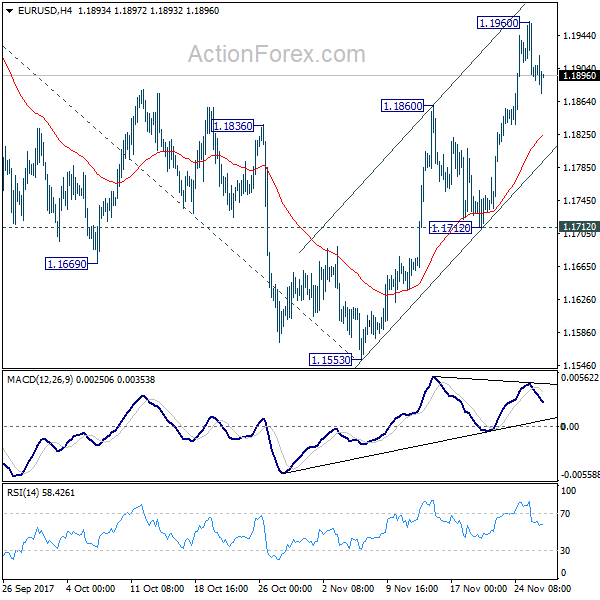
As the single currency has retreated after rising to 1.1961, suggesting consolidation below this level would be seen and pullback to 1.1865-70 (38.2% Fibonacci retracement of 1.1713-1.1961) cannot be ruled out, however reckon support at 1.1837 (also 50% Fibonacci retracement of 1.1713-1.1961) would limit downside and bring rebound later. Only break of said resistance at 1.1961 would confirm recent upmove has resumed and extend gain towards psychological level at 1.2000.
In view of this, we are looking to buy euro on pullback as said support at 1.1837 should contain downside, bring another rise later. Below this support would defer and suggest a temporary top is possibly formed, bring correction of recent rise to 1.1800-05 first.
Trade Idea Wrap-up: USD/JPY – Buy at 111.00
USD/JPY - 111.26
Most recent candlesticks pattern : N/A
Trend : Near term down
Tenkan-Sen level : 111.26
Kijun-Sen level : 111.11
Ichimoku cloud top : 111.35
Ichimoku cloud bottom : 111.29
Original strategy :
Buy at 111.00, Target: 112.00, Stop: 110.65
Position : -
Target : -
Stop : -
New strategy :
Buy at 111.00, Target: 112.00, Stop: 110.65
Position : -
Target : -
Stop : -
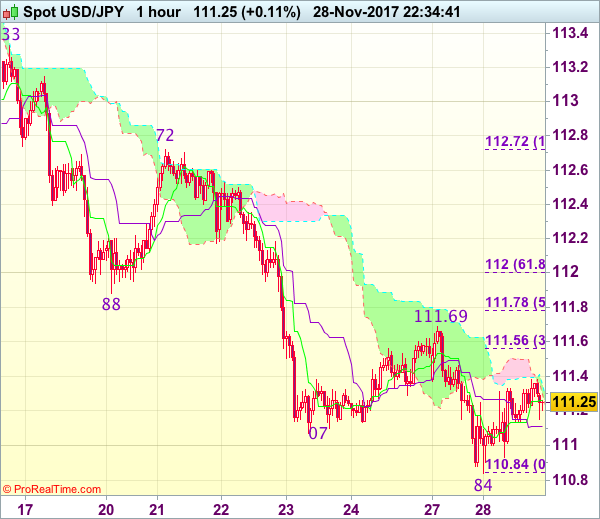
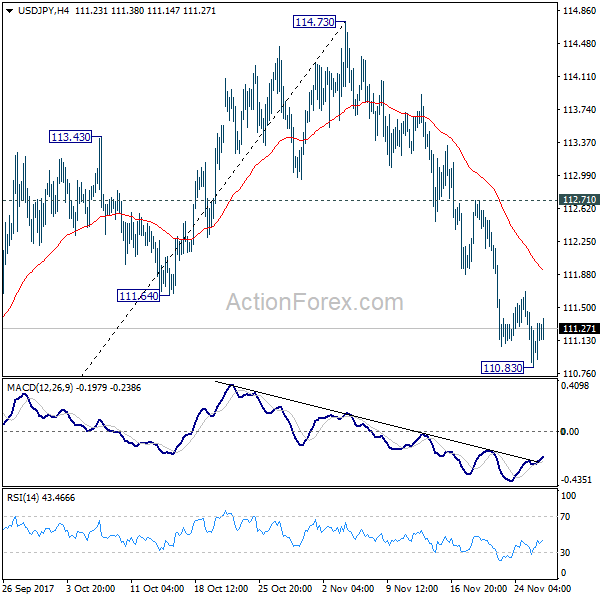
As the greenback recovered after falling to 110.84, suggesting consolidation above this level would be seen and corrective bounce to 111.60, then test of previous support at 111.88, however, reckon upside would be limited to 112.00 and price should falter below 112.35-40 and bring another decline later this week.
In view of this, we are looking to turn long on dips. Below said support at 110.84 would signal recent decline is still in progress and may extend weakness to 110.70 and possibly towards 110.50 but loss of momentum should limit downside to 110.20-25 and reckon 110.00 would hold from here.
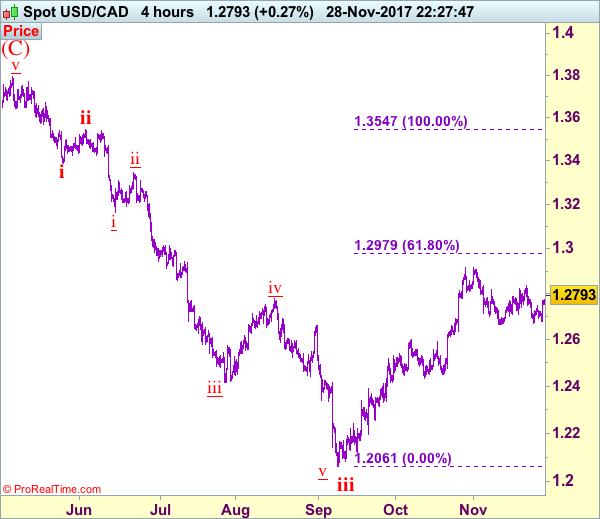
Trade Idea: USD/CAD – Sell at 1.2720
USD/CAD - 1.2682
Trend: Near term up
Original strategy :
Sold at 1.2720, stopped at 1.2780
Position: - Short at 1.2720
Target: -
Stop: - 1.2780
New strategy :
Stand aside
Position: -
Target: -
Stop:-
The greenback continued finding decent demand above previous support at 1.2665, suggesting further consolidation above this level would be seen and test of indicated resistance at 1.2937 cannot be ruled out, however, a sustained breach above there is needed to revive bullishness and signal the pullback from 1.2917 top has ended, bring further gain to 1.2880, then retest of this level later.
On the downside, below 1.750 would bring weakness to 1.2700-10 but said support at 1.2665 should remain intact, bring another rebound later. Only a break of 1.2665 would signal another leg of decline from 1.2917 top is underway for weakness to support at 1.2636, below there would bring stronger correction of recent rise to 1.2600 and later towards 1.2550-60
To recap, wave B from 1.3066 is unfolding as an a-b-c and is sub-divided as a: 1.2192, b: 1.2716 and wave c is a 5-waver with i: 1.1983, ii: 1.2506, extended wave iii with minor iii at 1.0206, wave iv ended at 1.0781 and wave v as well as wave iii has ended at 0.9931, hence the subsequent choppy trading is the wave iv which is unfolding as (a)-(b)-(c) with (a) leg of iv ended at 1.0854, followed by (b) leg at 1.0108 and (c) leg as well as the wave iv ended at 1.0674. The wave v is sub-divided by minor wave (i): 0.9980, (ii): 1.0374, (iii): 0.9446, (iv): 0.9913 and (v) as well as v has possibly ended at 0.9407, therefore, consolidation with upside bias is seen for major correction, indicated target at 1.3700 and 1.4000 had been met and further gain to 1.4700 would be seen later.
WTI Oil Extends Pullback from $59.02; Markets Focus Key Event – OPEC Policy Meeting
WTI oil price fell further on Tuesday, in extension of Monday's over 1% losses on pullback from recovery peak at $59.02. Pullback on oversold daily techs could extend further to test solid supports at $57.17 (rising 10SMA) and $56.65 (rising 20SMA). Extended corrective action should not exceed $56.41 support (Fibo 61.8% of $54.80/$59.02 upleg) to keep in play immediate hopes of testing psychological $60 barrier. Otherwise, deeper correction could be expected and supports at $55.80 (Fibo 76.4%) and $54.80 ( key n/t support / 14 Nov trough) would be exposed on break lower. Steep uptrend from $42.04 (2017 low) requires correction as overbought weekly studies are generating negative signal. OPEC meeting on Thursday is focused as key event for oil markets this week. It seems that the cartel is facing a tough policy talks, as OPEC's efforts to rebalance the oil market rise concerns about global oil deficit which could further boost oil prices. Currently, the cartel doesn't have a consensus about extension of current output cut program that raises concerns about the outcome of cartel's meeting on Nov 30.
Res: 57.90; 59.02; 59.82; 60.00
Sup: 57.41; 57.17; 56.65; 56.41
COPPER – Extended Bears Tested Critical Support Provided by Daily Cloud Base
Copper extends steep pullback from $3.1750 high (double upside rejection) and tested key support at $3.0642 (daily cloud base).
Bears were so far unable to break below cloud base after Tuesday's strong bearish acceleration surged into thick daily cloud (spanned between $3.0642 and $3.1151).
This is very significant support as the metal last traded below cloud in early June and since then the cloud was tracking ascend.
Firm break below cloud could spark stronger weakness and open way for test of initial target at $3.0305 (17 Nov trough), with 100SMA ($3.0049) and psychological $3.00 supports expected to come in focus.
Daily techs are coming into full bearish setup and support the notion.
However, bears may show stronger hesitation at cloud base and enter extended consolidation before bears resume.
Converged 10/20SMA's ($3.1049) should keep the upside protected, guarding the upper pivot at $3.1151 (daily cloud top).
Res: 3.0857; 3.1049; 3.1151; 3.1330
Sup: 3.0642; 3.0485; 3.0305; 3.0049
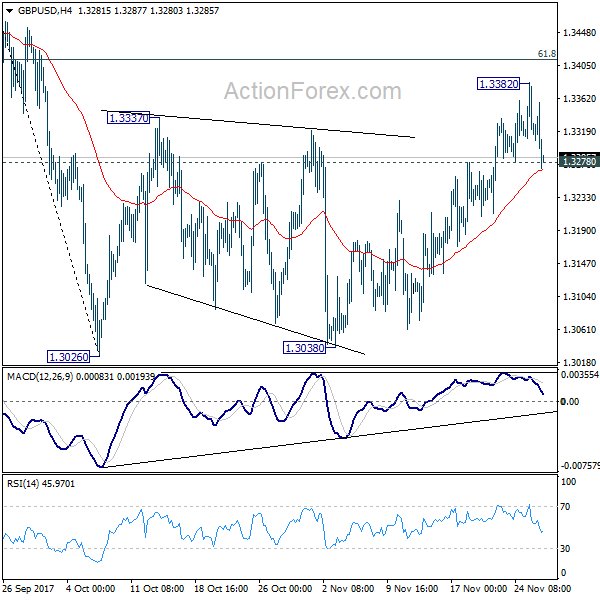
GBP/USD Mid-Day Outlook
Daily Pivots: (S1) 1.3290; (P) 1.3336; (R1) 1.3363; More....
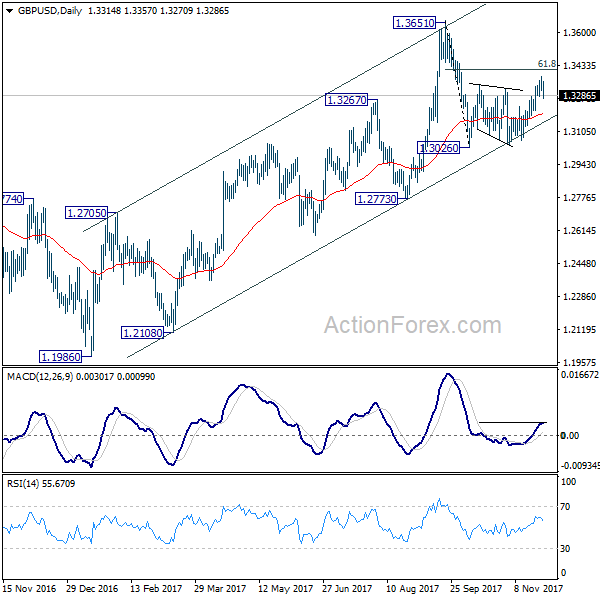
GBP/USD's rebound was limited at 1.3382 and weakens sharply. Loss of momentum and break of 1.3278 minor support revive the case that price actions from 1.3026 are merely a correction. Intraday bias is turned back to the downside and sustained trading below 4 hour 55 EMA will pave the way to retest 1.3026 low. Above 1.3382 resistance will target 61.8% retracement of 1.3651 to 1.3026 at 1.3412 instead.
In the bigger picture, as noted before, GBP/USD hit strong resistance from the long term falling trend line. Nonetheless, subsequent fall was contained by 55 week EMA (now at 1.3069). Outlook is a bit mixed. For the moment, as long as 1.3835 support turned resistance holds, medium term rise from 1.1946 are viewed as a corrective pattern. That is, we'd expect another leg in the long term down trend through 1.1946 low. However, sustained break of 1.3835 should at least send GBP/USD to 38.2% retracement of 2.1161 (2007 high) to 1.1946 (2016 low) at 1.5466.
EUR/USD Mid-Day Outlook
Daily Pivots: (S1) 1.1875; (P) 1.1918 (R1) 1.1941; More....
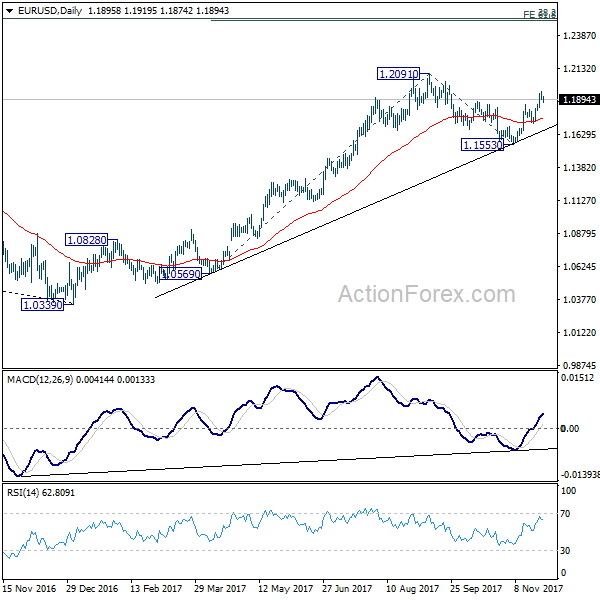
A temporary top is in place at 1.1960 and intraday bias in EUR/USD is turned neutral first. As long as 1.1712 support holds, rise from 1.1553 is expected to continue. Above 1.1960 will target 1.2091 high first. Break there will resume medium term up trend from 1.0339 and target 61.8% projection of 1.0569 to 1.2091 from 1.1553 at 1.2494, which is close to 1.2516 long term fibonacci level. We'd expect strong resistance from there to bring reversal. On the downside, break of 1.1712 will indicate completion of the rise from 1.1553 and turn near term outlook bearish.
In the bigger picture, rise from 1.0339 medium term bottom is seen as a corrective move for the moment. Therefore, in case of another rally, we'd be expect 38.2% retracement of 1.6039 (2008 high) to 1.0339 (2017 low) at 1.2516 to limit upside and bring reversal. Meanwhile, sustained trading below 55 week EMA (now at 1.1393) will suggest that such medium term rebound is completed and could then bring retest of 1.0339 low.
USD/JPY Mid-Day Outlook
Daily Pivots: (S1) 110.73; (P) 111.20; (R1) 111.57; More...
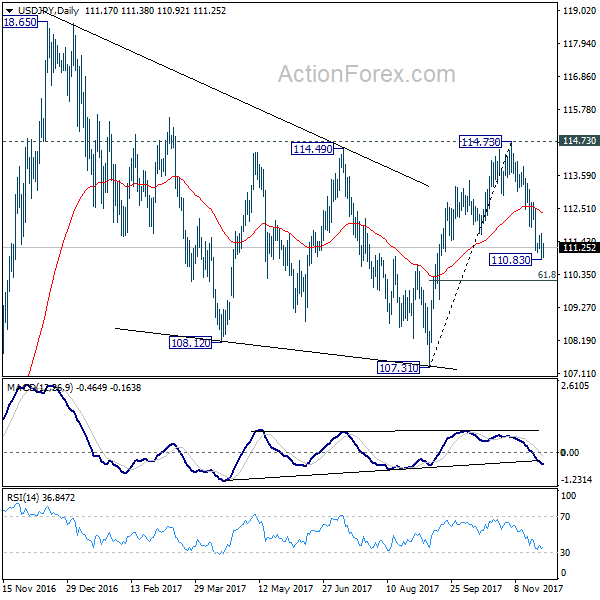
A temporary low is in place at 110.83 and intraday bias is turned neutral first. As long as 112.71 resistance holds, fall from 114.73 is expected to continue. Below 110.83 will target 61.8% retracement of 107.31 to 114.73 at 110.14. For the moment, we're still favoring the case medium term corrective pattern from 118.65 has completed at 107.31 already. Hence, we'll looking for bottoming below 110.14 to bring another rise. On the upside, break of 112.71 will suggest that the fall from 114.73 is completed and turn bias to the upside for retesting this resistance.
In the bigger picture, as long as 107.31 support holds, medium term rise from 98.97 (2016 low) is not completed yet. And another rise is in favor. Break of 114.73 resistance will target a test on 118.65 high first. However, break of 107.31 will dampen this will and extend the medium term fall back to 98.97 low.
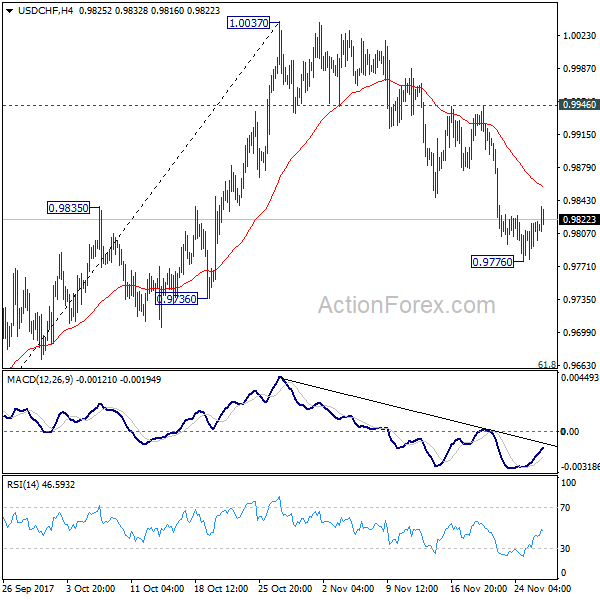
USD/CHF Mid-Day Outlook
Daily Pivots: (S1) 0.9788; (P) 0.9804; (R1) 0.9832; More....
Intraday bias in USD/CHF remains neutral as recovery from 0.9776 temporary low continues. As long as 0.9946 resistance holds, another fall is still expected. Below 0.9776 will extend the decline from 1.0037 to 61.8% retracement of 0.9420 to 1.0037 at 0.9656. We'll look for bottoming again below 0.9656 and above 0.9420. On the upside, break of 0.9946 resistance will indicate that the decline from 1.0037 has completed and bring retest of this resistance.
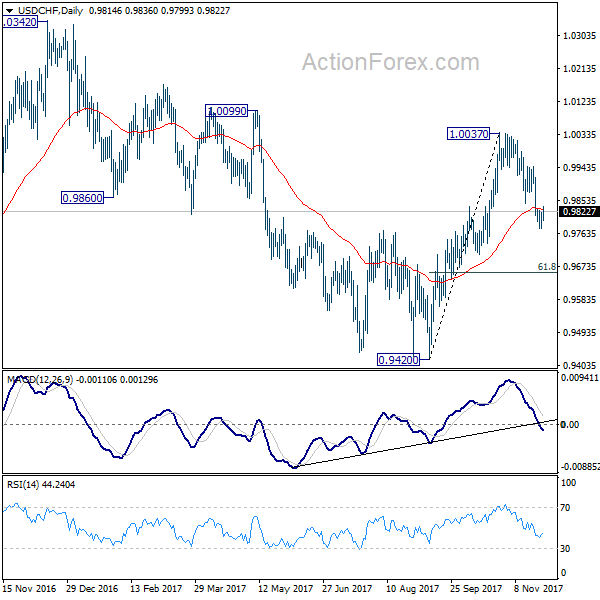
In the bigger picture, range trading continues between 0.9420/1.0342. At this point, 0.9420 appears to be a strong support level. Therefore, in case of decline attempt, we don't expect a firm break of this level. Nonetheless, strong break of 1.0342 is also needed to confirm upside momentum. Otherwise, medium term outlook will stay neutral.