Sample Category Title
Swiss Franc Trading A Tad Lower In The Morning Session
For the 24 hours to 23:00 GMT, the USD rose 0.07% against the CHF and closed at 0.9812.
On the macro front, Switzerland’s total sight deposits fell to a level of CHF577.5 billion in the week ended 24 November, compared to a level of CHF577.6 billion reported in the previous week.
In the Asian session, at GMT0400, the pair is trading at 0.9815, with the USD trading marginally higher against the CHF from yesterday’s close.
The pair is expected to find support at 0.9789, and a fall through could take it to the next support level of 0.9763. The pair is expected to find its first resistance at 0.9831, and a rise through could take it to the next resistance level of 0.9847.
Amid no macroeconomic releases in Switzerland today, investor sentiment would be governed by global macroeconomic factors.
The currency pair is showing convergence with its 20 Hr and 50 Hr moving averages.

Loonie Trading Flat, Ahead Of BoC Governor’s Speech
For the 24 hours to 23:00 GMT, the USD rose 0.33% against the CAD and closed at 1.2762.
In the Asian session, at GMT0400, the pair is trading at 1.2762, with the USD trading flat against the CAD from yesterday's close.
The pair is expected to find support at 1.2704, and a fall through could take it to the next support level of 1.2647. The pair is expected to find its first resistance at 1.2795, and a rise through could take it to the next resistance level of 1.2829.
Ahead in the day, investors would keep a close watch on a speech by the Bank of Canada (BoC) Governor, Stephen Poloz.
The currency pair is trading above its 20 Hr and 50 Hr moving averages.

EUR/USD Daily Outlook
Daily Pivots: (S1) 1.1875; (P) 1.1918 (R1) 1.1941; More....
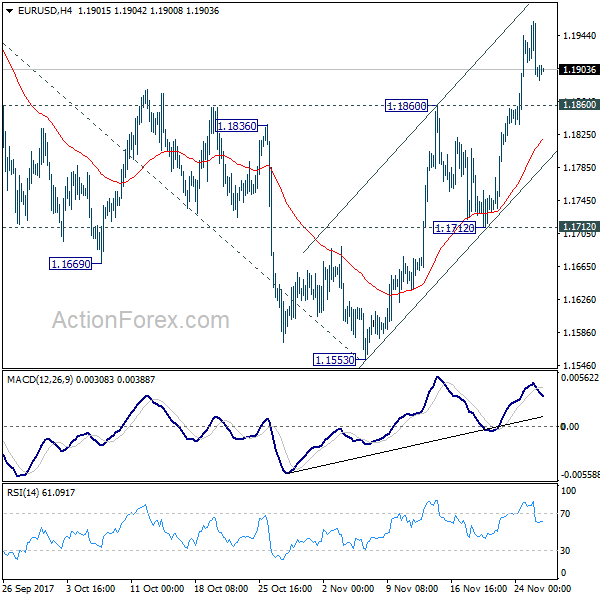
With 1.1860 minor support intact, intraday bias in EUR/USD stays on the upside. Current rise from 1.1553 should target a test on 1.2091 high. Break there will resume medium term up trend from 1.0339 and target 61.8% projection of 1.0569 to 1.2091 from 1.1553 at 1.2494, which is close to 1.2516 long term fibonacci level. We'd expect strong resistance from there to bring reversal. On the downside, touching 1.1860 support will turn intraday bias neutral first. But break of 1.1712 support is needed to indicate completion of rise from 1.1553. Otherwise, outlook will remain cautiously bullish in case of retreat.
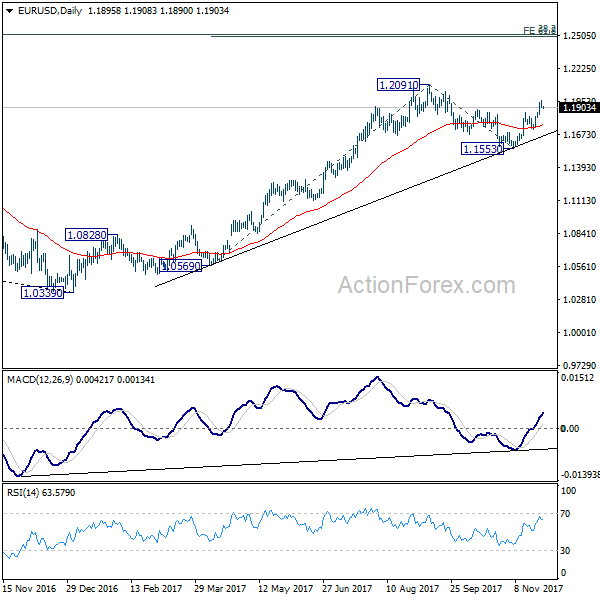
In the bigger picture, rise from 1.0339 medium term bottom is seen as a corrective move for the moment. Therefore, in case of another rally, we'd be expect 38.2% retracement of 1.6039 (2008 high) to 1.0339 (2017 low) at 1.2516 to limit upside and bring reversal. Meanwhile, sustained trading below 55 week EMA (now at 1.1393) will suggest that such medium term rebound is completed and could then bring retest of 1.0339 low.
GBP/USD Daily Outlook
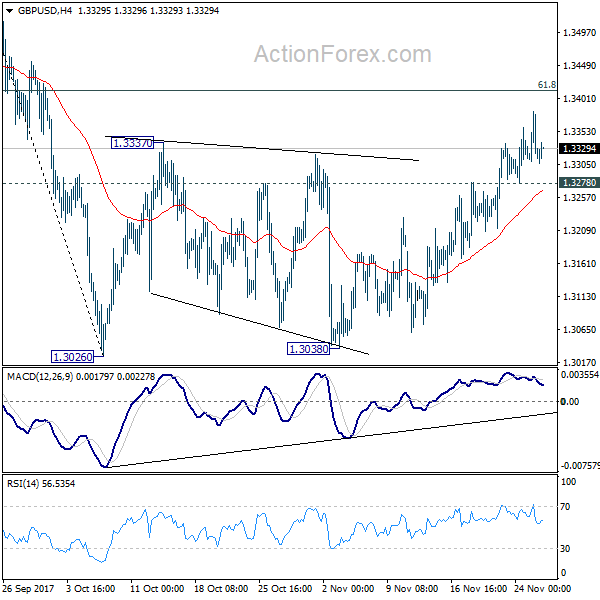
Daily Pivots: (S1) 1.3290; (P) 1.3336; (R1) 1.3363; More....
With 1.3278 minor support intact, further rise is expected in GBP/USD for 61.8% retracement of 1.3651 to 1.3026 at 1.3412. Sustained break there will pave the way to retest 1.3651 high. Nonetheless, rejection from 1.3412, or break of 1.3278 minor support will revive the case that price actions from 1.3026 are merely correction. And intraday bias will be turned back to the downside for 1.3026 low in that case.
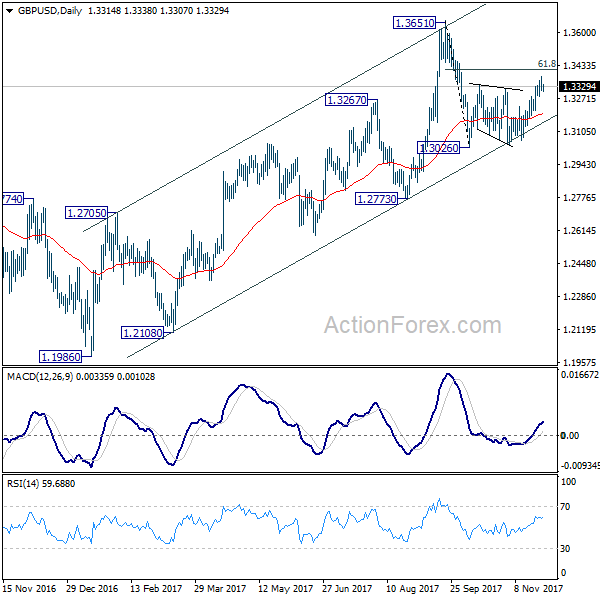
In the bigger picture, as noted before, GBP/USD hit strong resistance from the long term falling trend line. Nonetheless, subsequent fall was contained by 55 week EMA (now at 1.3069). Outlook is a bit mixed. For the moment, as long as 1.3835 support turned resistance holds, medium term rise from 1.1946 are viewed as a corrective pattern. That is, we'd expect another leg in the long term down trend through 1.1946 low. However, sustained break of 1.3835 should at least send GBP/USD to 38.2% retracement of 2.1161 (2007 high) to 1.1946 (2016 low) at 1.5466.
USD/CHF Daily Outlook
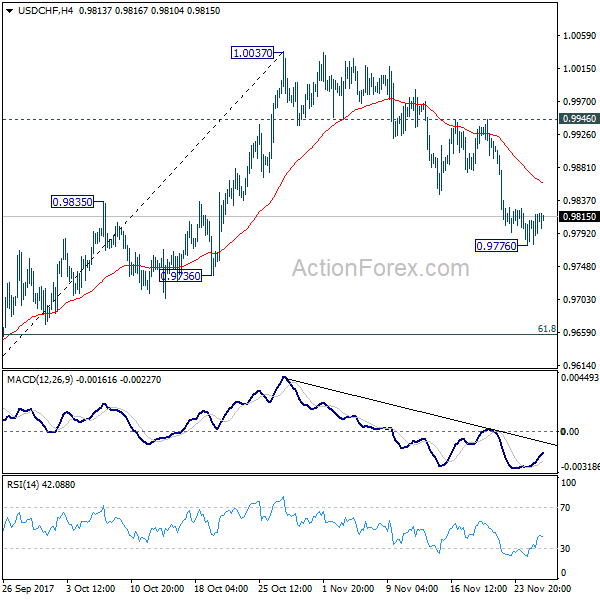
Daily Pivots: (S1) 0.9788; (P) 0.9804; (R1) 0.9832; More....
USD/CHF formed a temporary low at 0.9776 and intraday bias is turned neutral first. Another fall is expected as long as 0.9946 resistance holds. Below 0.9776 will extend the decline from 1.0037 to 61.8% retracement of 0.9420 to 1.0037 at 0.9656. We'll look for bottoming again below 0.9656 and above 0.9420. On the upside, break of 0.9946 resistance will indicate that the decline from 1.0037 has completed and bring retest of this resistance.
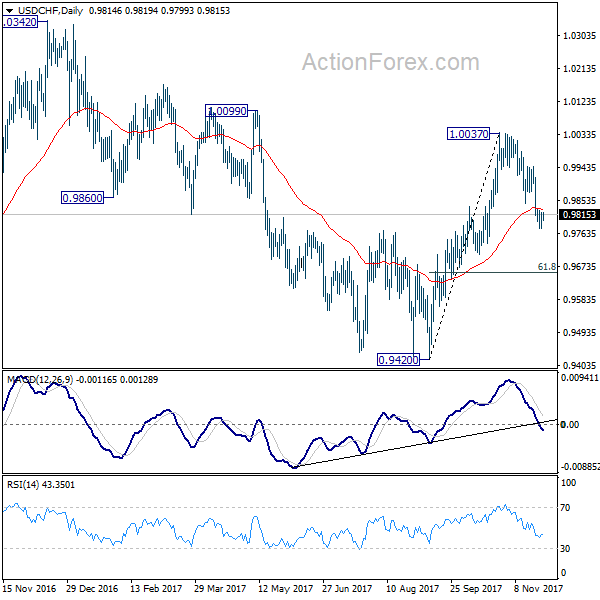
In the bigger picture, range trading continues between 0.9420/1.0342. At this point, 0.9420 appears to be a strong support level. Therefore, in case of decline attempt, we don't expect a firm break of this level. Nonetheless, strong break of 1.0342 is also needed to confirm upside momentum. Otherwise, medium term outlook will stay neutral.
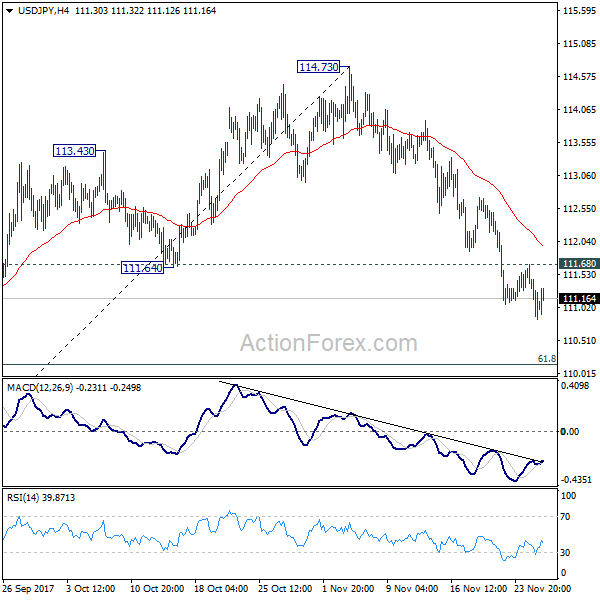
USD/JPY Daily Outlook
Daily Pivots: (S1) 110.73; (P) 111.20; (R1) 111.57; More...
Intraday bias in USD/JPY remains on the downside with 111.68 minor resistance intact. Current fall from 114.73 would target 61.8% retracement of 107.31 to 114.73 at 110.14. For the moment, we're still favoring the case medium term corrective pattern from 118.65 has completed at 107.31 already. Hence, we'll looking for bottoming below 110.14 to bring another rise. On the upside, above 116.68 minor resistance will turn intraday bias neutral first.
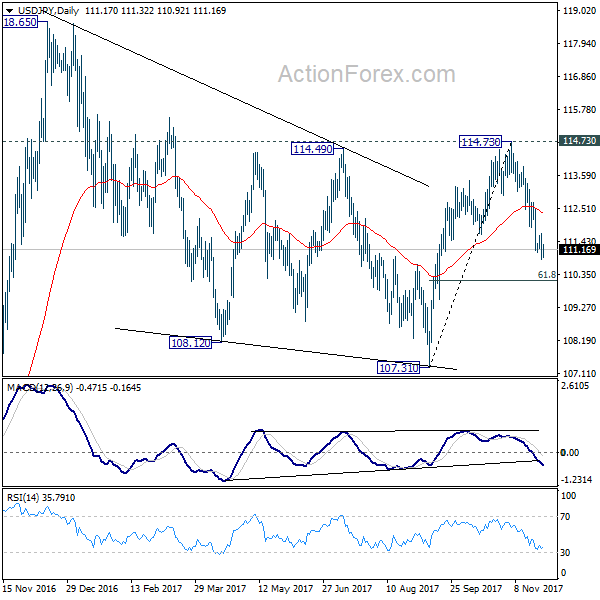
In the bigger picture, as long as 107.31 support holds, medium term rise from 98.97 (2016 low) is not completed yet. And another rise is in favor. Break of 114.73 resistance will target a test on 118.65 high first. However, break of 107.31 will dampen this will and extend the medium term fall back to 98.97 low.
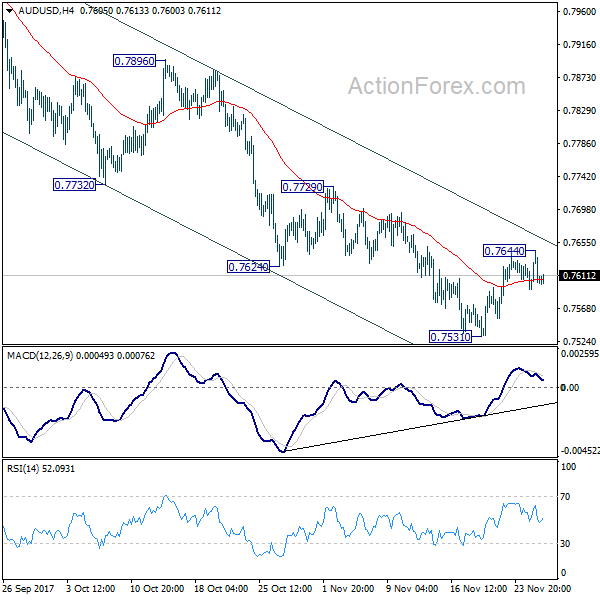
AUD/USD Daily Outlook
Daily Pivots: (S1) 0.7581; (P) 0.7613; (R1) 0.7632; More...
AUD/USD weakens again after edging higher to 0.7644 and intraday bias remains neutral. Near term outlook stays bearish with 0.7729 resistance intact and deeper decline is expected. Break of 0.7531 will resume whole decline from 0.8124 and target next key cluster level at 0.7322/8. However, considering bullish divergence condition in 4 hour MACD, break of 0.7729 will indicate near term reversal and bring stronger rebound back to 0.7896 resistance and above.
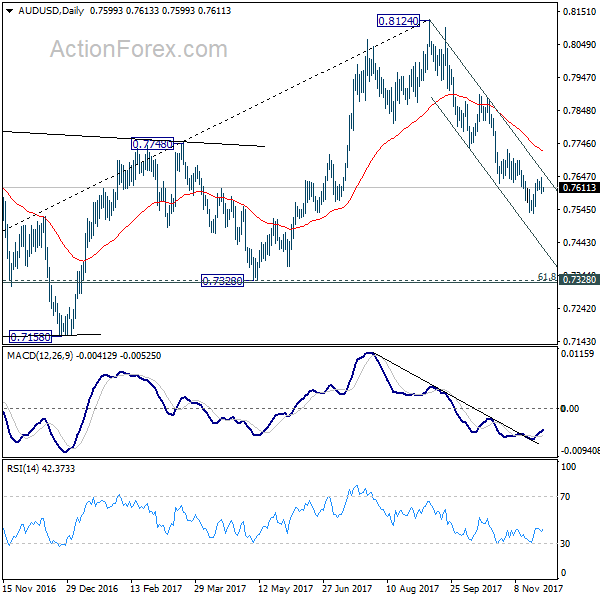
In the bigger picture, corrective rise from 0.6826 medium term bottom is likely completed at 0.8124, after hitting 55 month EMA (now at 0.8049). Decisive break of 0.7328 key cluster support (61.8% retracement 0.6826 to 0.8124 at 0.7322) will confirm. And in that case, long term down trend from 1.1079 (2011 high) will likely be resuming. Break of 0.6826 will target 61.8% projection of 1.1079 to 0.6826 from 0.8124 at 0.5496. This will now be the favored case as long as 0.7729 near term resistance holds.
Daily Wave Analysis: EUR/USD Approaches 1.20 Decision Zone For Bullish Trend
Currency pair EUR/USD
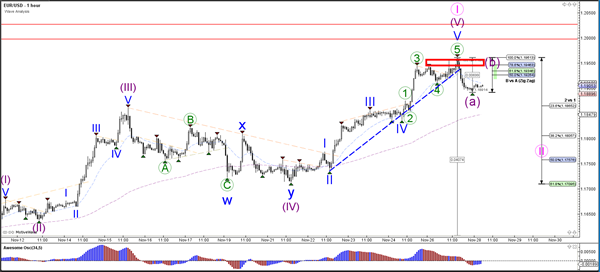
The EUR/USD uptrend is probably in a wave 5 (purple) of a larger wave 1 (pink). The 5th wave managed to reach 1.1960 but missed the 1.20 round level by a little bit. Price could still reach this resistance level later this week by extending wave 1 but eventually a correction within wave 2 (pink) is likely.
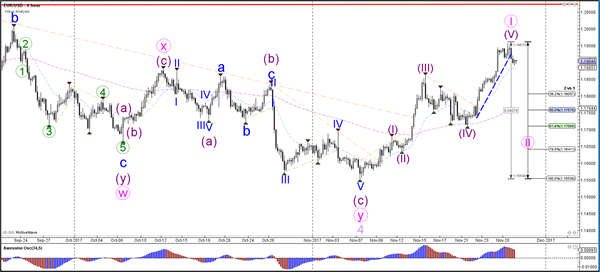
The EUR/USD uptrend could become extended if price manages to break above the resistance zone (red). In that case price could make it towards the resistance zone around 1.20. A failure to break could indicate a larger ABC (purple) correction within wave 2 (pink).
Currency pair GBP/USD
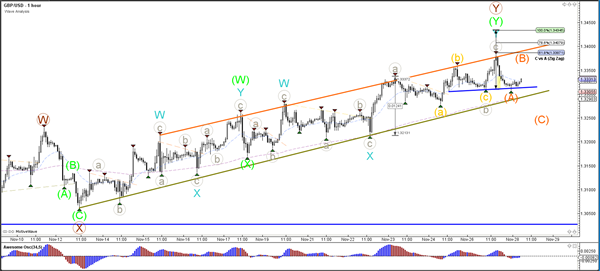
The GBP/USD channel has reached a key decision zone: the resistance of the sideways range (red). A new bullish breakout above the resistance (red) could indicate an uptrend whereas a bearish breakout could see price fall back to the bottom of the range (blue).
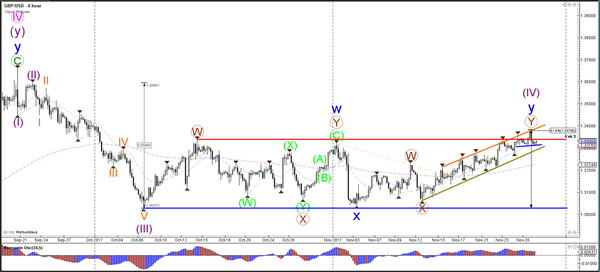
The GBP/USD bounced at the top and bottom of the channel and remains choppy in its movement. Now price is also showing double divergence between the two most recent tops, which could spark a potential ABC (orange) correction. A break above resistance could indicate a larger bullish momentum.
Currency pair USD/JPY
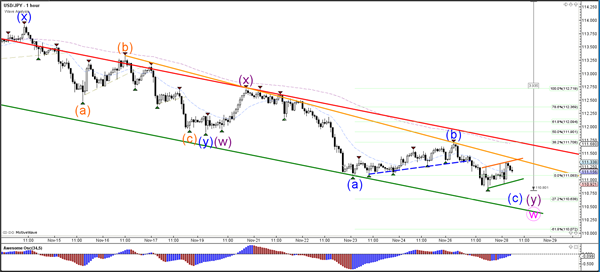
The USD/JPY bounced a second time at the 50% Fibonacci support level. Price could be expanding the bearish correction via a larger WXY (pink) pattern. A new bearish break below the 50% would most likely indicate a bearish continuation towards the 61.8% Fib.
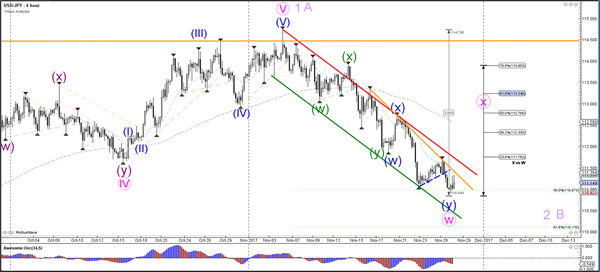
The USD/JPY could be building a bear flag chart pattern within a larger bearish wave C (blue). A bearish breakout could see price fall towards the Fibonacci targets whereas a bullish break could see price retest the trend channel (red).
Elliott Wave View: Dow Future
YM_F Dow Short term Elliott Wave view suggests that Intermediate wave (4) ended at 23204. Rally from there is unfolding as a leading diagonal Elliott wave structure. Minute wave ((i)) ended at 23464, Minute wave ((ii)) ended at 23241, Minute wave ((iii)) ended at 23599, Minute wave ((iv)) ended at 23432, and Minute wave ((v)) ended at 23616. The 5 waves leading diagonal rally also ended a higher degree Minor wave 1.
Minor wave 2 pullback is currently in progress to correct cycle from 11/15 low (23204) in 3, 7, or 11 swing before Index resumes the rally higher or at least bounce in 3 waves. The 50 – 76.4% retracement at 23302 – 23410 could be a potential area where Minor wave 2 may end, although the pullback doesn’t need to go that low. We don’t like selling the proposed pullback and expect buyers to appear once Minor wave 2 pullback is complete in 3, 7, or 11 swing provided pivot at 23204 low stays intact.
YM_F Dow 1 Hour Elliott Wave Chart
USD/CAD Daily Outlook
Daily Pivots: (S1) 1.2708; (P) 1.2739; (R1) 1.2799; More....
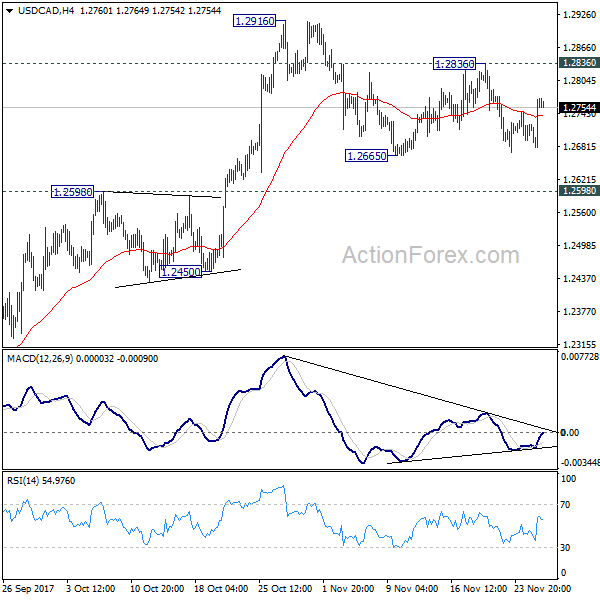
USD/CAD's correction from 1.2916 is still in progress and intraday bias stays neutral. Deeper decline could still be seen. . But we'd expect downside to be contained by 1.2598 resistance turned support and bring rebound. Above 1.2836 minor resistance will turn bias back to the upside for 1.2916 first. Further break of 1.2916 will resume whole rally from 1.2061 to 38.2% retracement of 1.4689 to 1.2061 at 1.3065. However, sustained break of 1.2598 will argue that rebound from 1.2061 has completed after hitting 55 week EMA (now at 1.2895). Near term outlook will be turned bearish in this case.
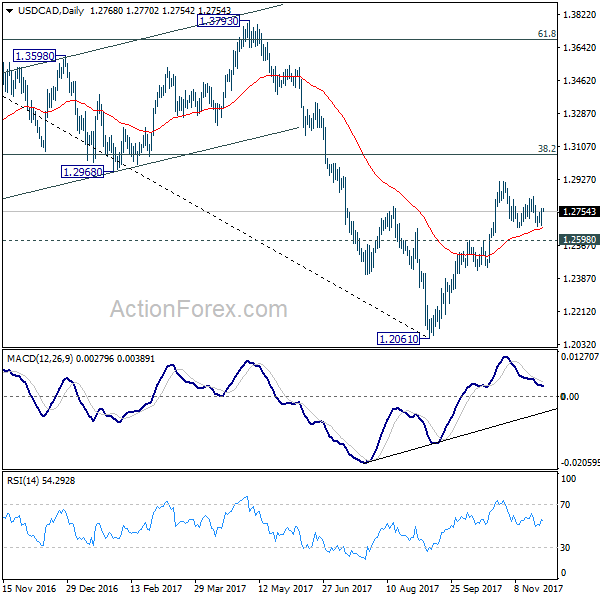
In the bigger picture, USD/CAD should have defended 50% retracement of 0.9406 (2011 low) to 1.4689 (2016 high) at 1.2048. And with 1.2048 intact, we'd favor the case that fall from 1.4689 is a correction. Rise from 1.2061 medium term bottom should now target 38.2% retracement of 1.4689 to 1.2061 at 1.3065. Firm break there will target 1.3793 key resistance next (61.8% retracement at 1.3685). We'll now hold on to this bullish view as long as 1.2450 support holds.