Sample Category Title
BITCOIN Ready To Reach 10k
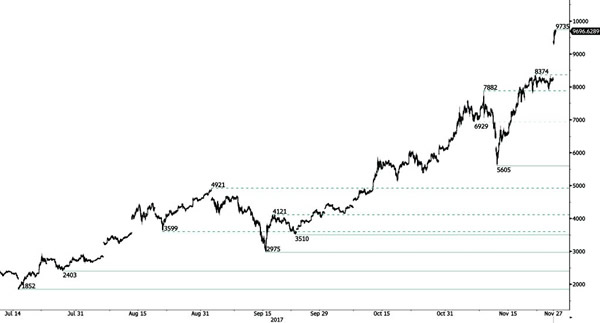
Bitcoin has jumped over the weekend. The technical structure shows a tremendous positive short-term momentum. Hourly support is located at 5605 (13/11/2017 low). Strong support stands very far at 2975 (22/08/2017 low). In the shortterm, the digital currency should continue rising and reach 10k.
In the long-term, the digital currency has had an exponential growth. There are decent likelihood that the asset will reach not only $10'000 but $15'000.
EUR/CHF Monitoring 1.17 Level
EUR/CHF is trading slightly higher towards resistance at 1.1711 and support given at 1.1610 (27/10/2017 low). Expected to show continued sideways move.
In the longer term, the technical structure has reversed. Strong resistance is given at 1.20 (level before the unpeg). Yet, the ECB's QE programme is likely to cause persistent selling pressures on the euro, which should weigh on EUR/CHF. Supports can be found at 1.0184 (28/01/2015 low) and 1.0082 (27/01/2015 low).

EUR/GBP Bullish Momentum Builds
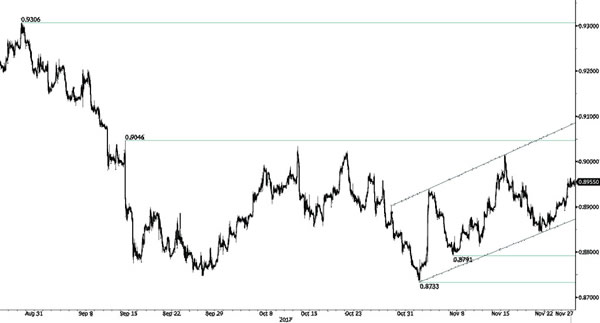
EUR/GBP has broken rising trendline, yet technical structure suggests further short-term bullish momentum. Hourly support is given at a distance at 0.8733 (01/11/2017 low). Next resistance is located at 0.9014 (27/10/2017 high).
In the long-term, the pair has largely recovered from recent lows in 2015. The technical structure suggests a growing upside momentum. The pair is trading above from its 200 DMA. Strong resistance can be found at 0.9500 (psychological level).
AUD/USD Riding Downtrend Channel
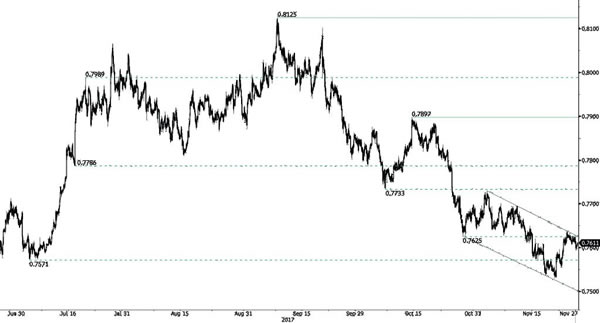
AUD/USD is ready to go even lower showing that downside pressures are still lively. Hourly resistance is given at a distance at 0.7897 (13/10/2017 high). Expected to show renewed pressures towards key support at 0.7535 (22/06/2017 low).
In the long-term, the trend is turning positive. Key supports stands at 0.6009 (31/10/2008 low) . A break of the key resistance at 0.8164 (14/05/2015 high) is needed to invalidate our long-term bearish view.
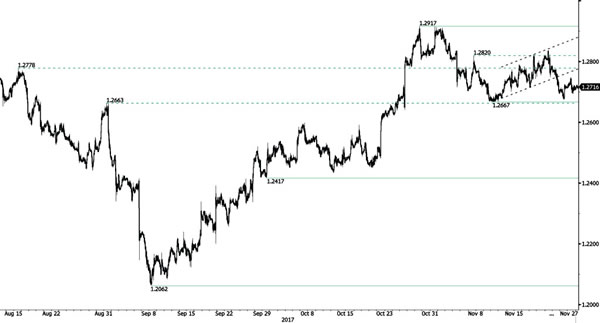
USD/CAD Sideways Price Action
USD/CAD has failed to clear resistance indicating downside risks. Hourly resistance can be found at 1.2837 (21/11/2017 high). Hourly support lies at 1.2667 (10/11/2017 low). Expected to show bearish pressures.
In the longer term, the pair has broken longterm support that can be found at 1.2461 (16/03/2015 low). Strong resistance is given at 1.4690 (22/01/2016 high). The pair is likely to head further lower.
USD/CHF Riding Lower
USD/CHF's technical structure is clearly bearish. The technical structure indicates further downside risks. The pair has failed to hold consistently above the parity. The road is wideopen for further decline.
In the long-term, the pair is still trading in range since 2011 despite some turmoil when the SNB unpegged the CHF. Key support can be found 0.8986 (30/01/2015 low). The technical structure favours nonetheless a long term bullish bias since the unpeg in January 2015.

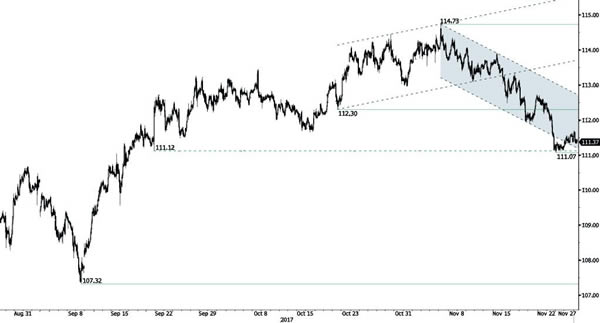
USD/JPY Holding Above 111.00
USD/JPY has broken short-term uptrend channel and strong support located at 111.12 (20/09/2017 low). The road is wide open for further decline.
We favor a long-term bearish bias. Support is now given at 99.02 (10/08/2013 low). A gradual rise towards the major resistance at 125.86 (05/06/2015 high) seems unlikely. Expected to decline further support at 93.79 (13/06/2013 low).
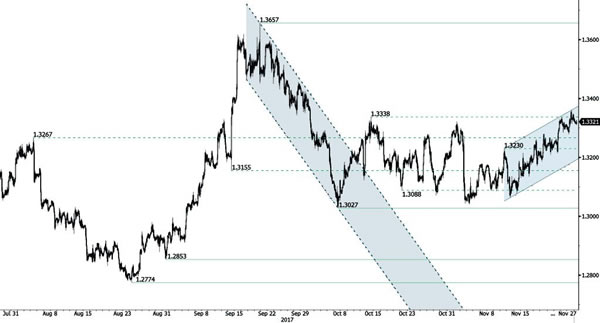
GBP/USD Riding Uptrend Channel
GBP/USD has broken 1.3230 resistance indicate an extension of bullish momentum. Support is given at 1.3027 (06/10/2017 low). Expected to show continued increase above former resistance at 1.3338 (13/10/2017 high).
The long-term technical pattern is reversing. The Brexit vote had paved the way for further decline. Long-term support can be found at 1.1841 (07/10/2017 low). Long-term resistance given around 1.35 is at stake and indicates a long-term reversal in the negative trend. Yet, it is very unlikely at the moment.
EUR/USD Breaking Resistance At 1.1878
EUR/USD is pushing higher. Hourly resistance located at 1.1878 (12/10/2017 high) has been broken. Hourly support is given at a distance at 1.1554 (07/11/2017 low). Expected to show continued increase.
In the longer term, the momentum is now turning largely positive. We favour a continued bullish bias. Key resistance is holding at 1.2252 (25/12/2014 high) while strong support lies at 1.0341 (03/01/2017 low).

Gold Firmer In Short-Term, Needs To Stay Above 1290 To Maintain Current Bullish Momentum
Gold is firmer in the short-term and prices are currently pivoting around the key 1290 level. On the 4-hour chart, the market turned more bullish after the crossover of the 50 and 200-period moving averages. RSI has risen above 50 which keeps the near-term bullish momentum intact.
The strong upleg above the 200-MA on November 22 has improved the bullish undertone. But strong resistance is expected in the zone between 1299.94 (November 17 high) and 1297.44 (38.2% Fibonacci of the downleg from 1357.47 to 1260.59). A daily close above the latter would strengthen bullish momentum to target the key 1300 psychological level. This is a critical level which if broken to the upside would open the way to the next high at 1306.05 and then at 1308.93 (50% Fibonacci).
Focusing on the shorter term, if gold fails to stay above 1290 then there is scope to dip towards 1283.28 (23.6% Fibonacci). Below this, the 200-MA at 1281.83 comes into view. The market needs to stay above it otherwise the current bullish momentum would weaken. Another leg lower would find support at 1274.42 and 1269.86 but further declines would increase the odds of breaking below 1260.59 to see a resumption of the downtrend from 1357.47 and shift the market out of its medium-term neutral phase.