Sample Category Title
XAUUSD Intraday Analysis
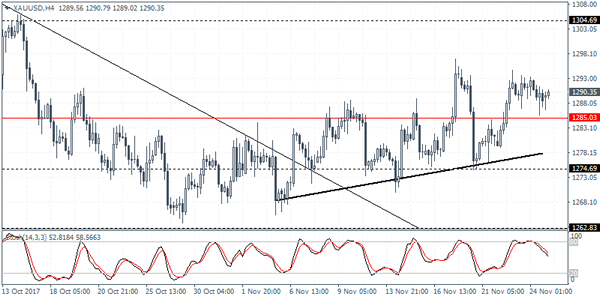
XAUUSD (1290.35): Gold prices managed to remain supported above the 1285 handle. However, price action remains choppy as gold prices started retreating from the previous highs formed near the 1296 level. In any case, we are expecting the declines to stall near the 1285 level where support could be formed. A rebound off this level will signal the near term gains that could target the 1300 region where resistance is seen. Alternately, a break down below 1285 could see gold prices moving back into the familiar range that was established with the lower support seen forming at 1274.
USDJPY Intraday Analysis
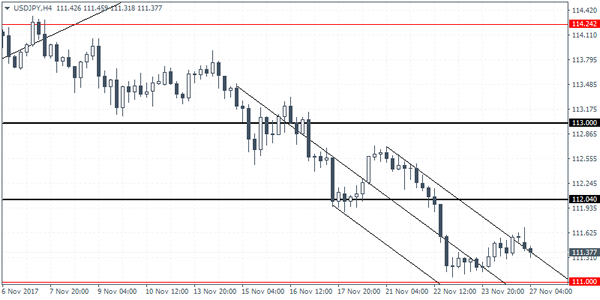
USDJPY (111.37): USDJPY attempted to reverse the losses with Friday's price action turning bullish. However, an early Asian trading session shows the price retracing back those gains. We expect to see a higher low being formed near the current levels. This would indicate a short-term correction towards the 112.00 level where resistance could be established. In the event that the USDJPY posts further declines, the lower support near 111.00 will be tested. The declines are likely to be held near this support level initially ahead of a short term correction. Alternately, a decline near 111.00 could see USDJPY falling towards 110.75 level which will mark the decline downwards.
EURUSD Intraday Analysis
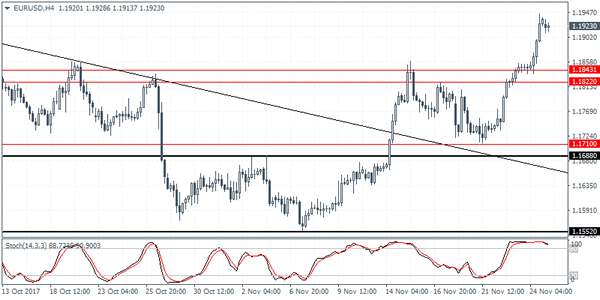
EURUSD (1.1923): The euro closed with strong gains on Friday marking a four day winning streak. Price action is seen trading close to 1.1950 level, where an unfilled gap from the 22nd of September is likely to be filled. In the near term, EURUSD could potentially correct itself downwards withsupport seen at the 1.1842 - 1.1822 level. Establishing support at this previously established resistance level will signal further increases in the near term. Above 1.1950, EURUSD could be seen aquiring further gains towards the 1.2000 handle. However, failure to establish any near term support could see EURUSD at the risk of correcting downards.
Euro Maintains Strong Gains, Quiet Day Ahead
The euro currency managed to post strong gains on Friday with the U.S. dollar identified as weakening. The rally in the common currency saw the 1.1900 handle being reclaimed once again. The decline in the U.S. dollar came amid stronger economic data from the Eurozone.
Oil prices also posted strong gains on Friday ahead of the OPEC meeting that is due to start this week. WTI Crude oil prices are seen trading close to the $60 a barrel price level. OPEC member nations and Russia are expected to announce further extensions to the oil production cuts this week.
Looking ahead in the economic calendar today there is some light activity. The U.S. trading session will see the release of the new home sales data. Economists polled are expecting to see the new home sales data rise to 627k in October. Previously, new home sales data surged by 667k in September marking a strong increase. Elsewhere, the BoE chief economist Andy Haldane is expected to speak today, followed by the outgoing FOMC voting member, Kashkari.
GBP/JPY Daily Outlook
Daily Pivots: (S1) 148.02; (P) 148.49; (R1) 149.11; More...
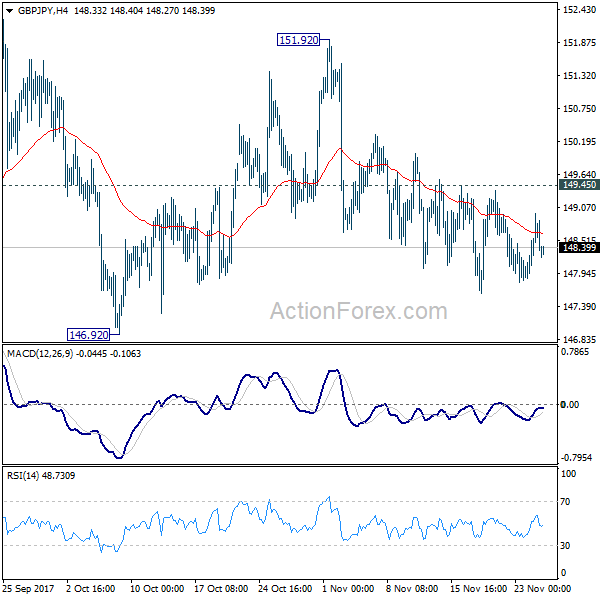
Outlook in GBP/JPY remains unchanged. Price actions from 152.82 are developing to a corrective pattern. As long as 149.45 minor resistance holds, deeper fall is mildly in favor through 146.92 support. But we'd expect strong support from 61.8% retracement of 139.29 to 152.82 at 144.45 to contain downside and bring rebound. On the upside, break of 149.45 resistance will turn bias back to the upside for 151.92/152.82 resistance zone instead.
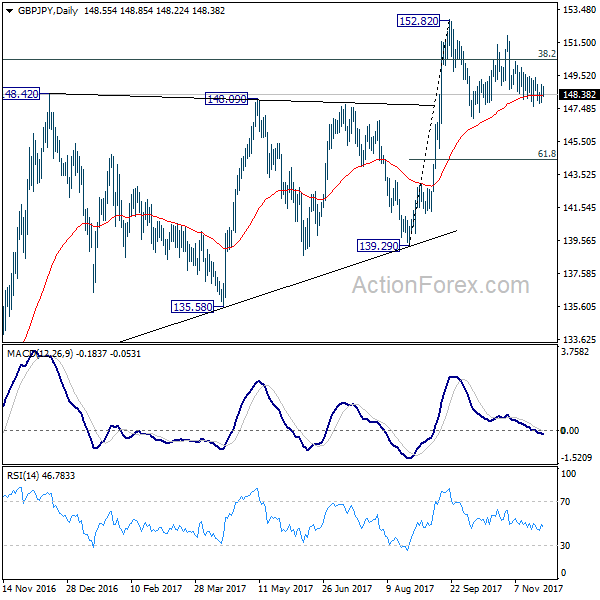
In the bigger picture, medium term rebound from 122.36 is still expected to resume after corrective pull back from 152.82 completes. Firm break of 38.2% retracement of 196.85 to 122.36 at 150.43 will carry long term bullish implications. In that case, GBP/JPY could target 61.8% retracement at 167.78. However, break of 139.29 will indicate rejection from 150.43 key fibonacci level. And the three wave corrective structure of rebound from 122.36 will argue that larger down trend is resuming for a new low below 122.26.
Baker Hughes Gives WTI The Blues
Oil trading shows signs of life in Asia trading with, WTI dropping on a higher Baker Hughes while Brent holds steady.
The price action in crude diverged in Asia this morning with WTI falling 0.40% to 58.55 while Brent crude enjoyed a small 0.12% gain to 63.88. The difference in price action was likely due to the Baker Hughes Rig Count data showing that eight rigs were added by shale producers in the U.S., as well as slightly overbought technical indicators.
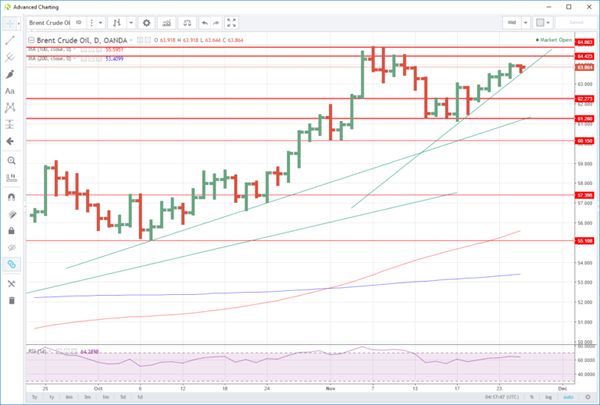
Brent’s downside, in particular, should be limited ahead of Thursdays crucial official OPEC meeting where we are expecting the production cut agreement to be rolled over to cover all of March 2018. The street has pretty much priced this in as a done deal, so anything less would almost certainly see both contracts coming under renewed selling pressure.
Brent crude continues to bubble under strong resistance at 64.40 and 64.75, both levels being daily double tops. It has interim support nearby at 63.50 with a break implying we could see a corrective sell-off to the next support at 62.30. Below this level is the crucial 61.25 multi-day low from early November.
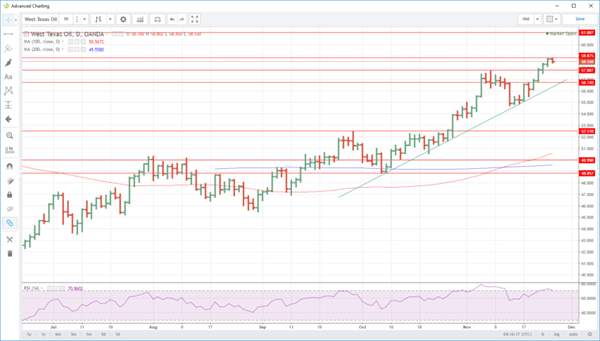
WTI’s relative strength index (RSI) continues to be at very overbought levels implying that it will find the going hard to the topside as the week starts. Like Brent, it is vulnerable to profit taking and position squaring ahead of the OPEC meeting. Initial resistance is at 58.90 with initial support at 57.80. A break of this level opens up a possible correction to 56.75 ahead of the trendline support at 56.30 today.
EUR/JPY Daily Outlook
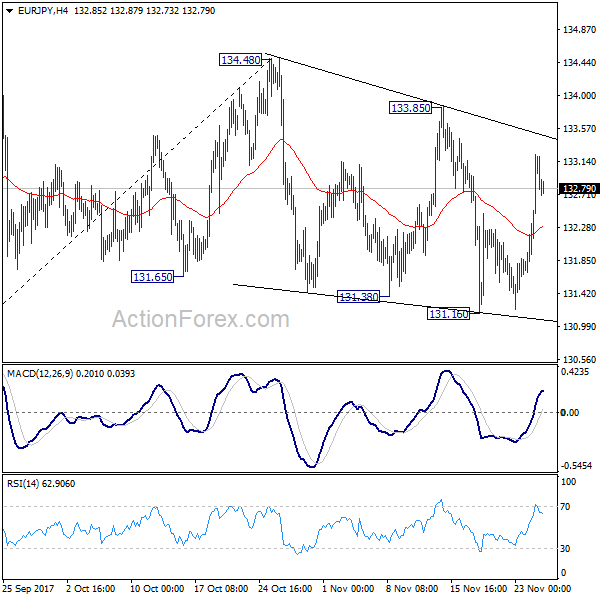
Daily Pivots: (S1) 132.08; (P) 132.65; (R1) 133.59; More....
Intraday bias in EUR/JPY remains neutral at this point. As long as 134.48 key resistance holds, risk remains on the downside. Break of 131.16 will target 38.2% retracement of 114.84 to 134.48 at 126.97, which is close to 127.55 support. We'll look for support from there to bring rebound on first attempt.
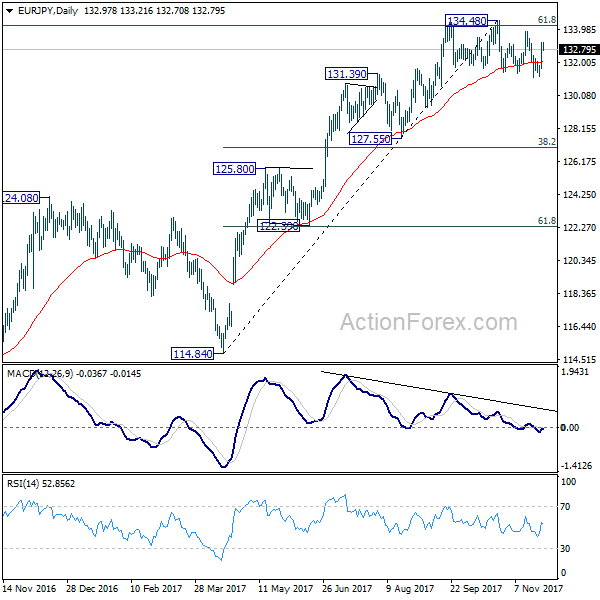
In the bigger picture, medium term rise from 109.03 (2016 low) is seen as at the same degree as the down trend from 149.76 (2014 high) to 109.03 (2016 low). 61.8% retracement of 149.76 to 109.03 at 134.20 is already met. Sustained break there will pave the way to key long term resistance zone at 141.04/149.76. However, break of 127.55 support will argue that the medium term trend has reversed and will turn outlook bearish for deeper fall back to 114.84/124.08 support zone at least.
Equities Slide Ahead Of A Busy Week, Oil Under The Radar
Despite a record high close on the S&P 500 last Friday, Asian equities edged lower, led by Korean markets. Chinese stocks continued to decline after having the biggest one-day selloff in 17months on Thursday, as rising government and corporate bond yields signaled tighter liquidity conditions. Whether the selloff is a slight correction after a strong surge in 2017, or steeper declines on the way, remains to be seen. However, rising bond yields, particularly junk bonds, should keep investors worried.
Bitcoin, no signs of slowing down
Bitcoin continued to gather pace over the weekend rising to above $9,000, despite warnings of bubble being created in this relatively new asset class. From a fundamental perspective it is still almost impossible to give the cryptocurrency a fair value, however, there has been a strong correlation between the price of Bitcoin and number of users opening new wallets. It is not just retail investors showing interest in the cryptocurrency, but many hedge funds have decided to join the party recently by including Bitcoins in their portfolios. Given that number of users haven’t exceeded 0.1% of the global population, there’s still more potential for this momentum trade to continue. Whether the price will be justified in the foreseeable future, depends on the adoption and the application of the new currency, but so far it still looks unstoppable.
OPEC meets
On Thursday OPEC and Russia will finally end speculations on whether the deal to cut output will be extended beyond March 2018. Brent crude is undoubtedly pricing in good news and probably a little geopolitical risk premium. The 32.5% surge in Brent price from a year ago reflects expectations that production cuts will remain in play for 2018 and failing to do that, will have negative consequences. At this stage, I think that the upside in Brent should remain limited, if tensions in the Middle East don’t escalate. However, the downside move will look ugly if OPEC & Russia fail to show a strong commitment to extending the production cuts. Investors and speculators are sitting on record net-long positions and upsetting the oil bulls at this stage isn’t a good idea.
U.S. stocks and dollar awaiting tax reforms
Expectations of tax reforms, in my opinion, have kept Wall Street optimistic throughout the year and stocks at record highs. It’s time for U.S. policymakers to deliver, or the long-awaited correction will likely occur soon. The Senate is back from recess and President Trump will meet senators on Tuesday. At this stage, neither economic data nor monetary policy will be given a lot of attention. It’s all about fiscal policies, and without meaningful progress it’s likely to be painful for stocks and the dollar.
The Chinese CSI300 Index Is Trading 1.3% Lower
Market movers today
Today is very quiet in terms of economic data releases and events.
In Sweden, household lending will give additional input on the consumer reaction to recent developments.
Fed Chair nominee Jerome Powell's confirmation hearing in the Senate's Banking Committee is scheduled for tomorrow. We think his approval will go smoothly.
This week's highlights are inflation data for both the euro area and the US. Also , ISM manufacturing on Friday will at tract at tention.
During the week, we have several important Scandi releases. In Sweden, focus is on the Q3 GDP dat a and the FSA's Financial Stabilit yreport . In Norway, retail sales and unemployment figures are due out . In Denmark, the second release of Q3 GDP data is due to be published on Thursday.
Selected market news
It has been relatively quiet over the weekend both in terms of news and price actions on financial markets. The moderate positive risk appetite seen in the European session on Friday was carried over to the US session and US equities ended Friday slightly higher as investors returned from holiday.
In Asia, most regional equity indices are trading lower this morning as Chinese markets have resumed the decline. The Chinese CSI300 index is trading 1.3% lower at the time of writing. In Japan, a stronger yen weighs on Japanese equities. Over the weekend, BoJ member Hitoshi Suzuki joined the camp of BoJ officials, hinting that the BoJ might consider adjusting its policy mix saying that ‘it wouldn't be strange if the BOJ conducted fine-tuning so market part icipants can familiarise themselves with a gradual process; as CPI approaches 2%, there should be a discussion on it '. Meanwhile, the recent flat tening of the US yield curve has eroded the profit potential significantly for Japanese investors buying US Treasuries. Further flat tening pressure on the US yield curve could lead to further yen appreciation.
The US PMIs released on Friday fell short of expectations with the manufacturing PMI declining to 53.8 in November from 54.6 in Oct ober while the service PMI fell to 53.7 from 55.3. The decline in the US PMIs stands in contrast to the ISM survey, which increased in October. Overall, the PMIs indicate slightly slower growth ahead, but still at healthy levels.
The combination of weak US PMI survey and the strong German Ifo survey support led a strong rally in EUR/USD on Friday with the cross jumping one figure from mid-1.18 to mid-1.19 and thereby breaking above the key resistance level at 1.1880.
On Friday, European Council President Donald Tusk gave UK Prime Minister Theresa May a deadline of 4 December to make additional efforts to resolve differences in the Brexit negotiations. If no progress is seen in the next 10 days, EU leaders are not likely to say that sufficient progress has been made when EU leaders meet at the EU Summit on 14 December. The divorce bill and what to do about the Irish border are the two main obstacles.
Daily Wave Analysis: EUR/USD Awaits Wave-4 Retracement After Impulsive 3rd Wave Completes
Currency pair EUR/USD
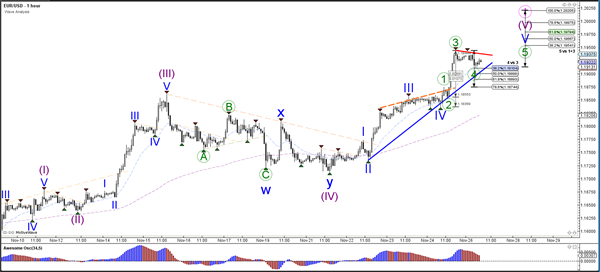
The EUR/USD uptrend is probably part of a wave 5 (purple) within a larger wave 1 (pink). Together with the previous resistance (red), the Fibonacci targets could act as potential resistance for the end of wave 1.
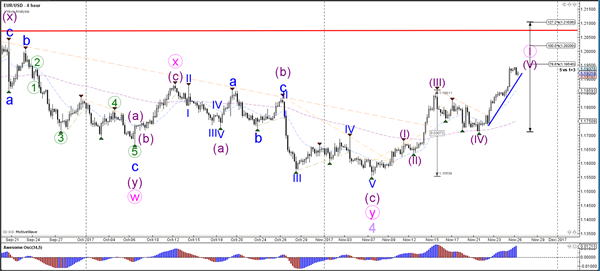
The EUR/USD is probably building a wave 4 retracement (green) within the uptrend. A break above resistance (red) could indicate a bullish continuation towards the Fib targets of wave 5 whereas a break below the 78.6% Fib invalidates the current wave 4.
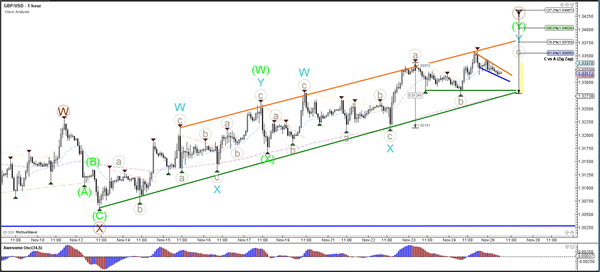
Currency pair GBP/USD
The GBP/USD channel has reached a key decision zone: the resistance of the sideways range (red). A bullish breakout above the resistance (red) could indicate a new uptrend whereas a bearish breakout could see price fall back to the bottom of the range (blue).
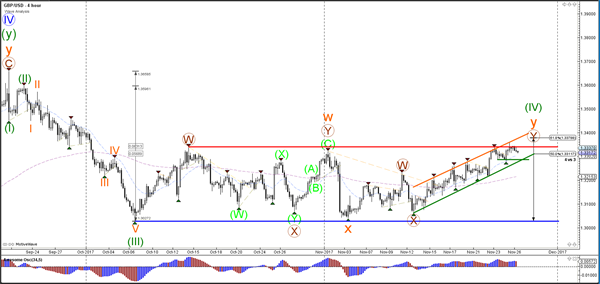
The GBP/USD Is building a bullish channel, which offers key decision zone for a bearish and bullish breakout and bounces. A break below the channel could indicate a bearish reversal whereas a bounce at support could indicate a continuation of the uptrend.
Currency pair USD/JPY
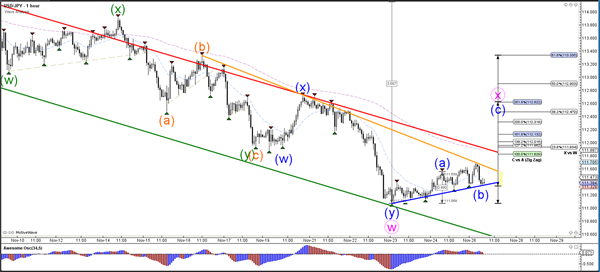
The USD/JPY bounced at the 50% Fibonacci support level and price could expand the bearish correction via a new WXY (pink) pattern. A bearish breakout below support (blue) could indicate that price will continue to fall within the bearish channel.
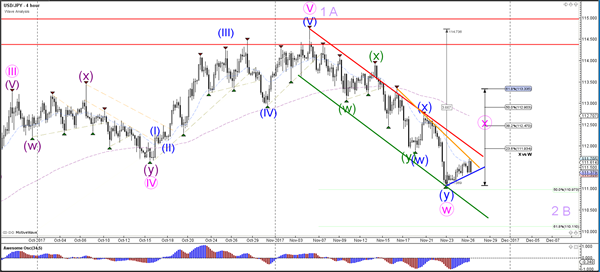
The USD/JPY could be building an ABC (blue) pattern within the wave X (pink).