Sample Category Title
Dollar Pressured By Risk-Off, Looming Senate Tax Vote, Euro And Pound Hold Near Multi-Week Highs
Asian markets had a poor start to the week as sentiment was dampened by sliding stocks in China and South Korea and uncertainty ahead of the Senate vote on the Republican's tax plan later this week. Investors were also cautious ahead of a busy data week for the major economies. The yen was the biggest beneficiary of today's risk aversion, rising against most of its major peers, while the US dollar wallowed at two-month lows against a basket of currencies.
Data showing that industrial profits in China were up by 25.1% year-on-year in October, the second highest on record, did little to lift risk appetite, with tumbling Chinese stocks weighing on the markets. With little else on the economic calendar today apart from US new home sales, the focus is on the week's upcoming inflation data out of Japan, the Eurozone and the US, GDP estimates for the US and Canada, and PMI releases for several countries, including China.
However, investors are likely to be more preoccupied with US politics as the Senate is expected to vote on its version of the tax bill on November 30. With a slim Republican majority of just two in the Senate, the vote can easily fail and cause a widespread market selloff.
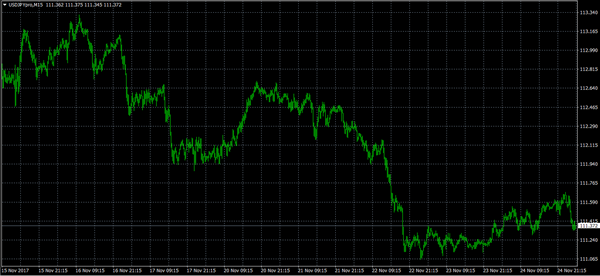
The dollar is already under pressure from a weakening inflation outlook in the US, which has cast doubt about how aggressively the Fed will need to raise rates over the next few years. The greenback gave up almost all of Friday's gains versus the yen today, moving back towards last week's 2½-month lows. It was last trading around 111.20 yen. It's broader measure, the dollar index, hit a fresh two-month low of 92.55.
The Congressional hearing on Fed Chair nominee Jerome Powell will be watched on Tuesday for an insight to Powell's views on monetary policy and on the US inflation picture. Incumbent chair, Janet Yellen, will also be appearing in Congress this week when she gives her semi-annual testimony on monetary policy.
The Australian and New Zealand dollars also struggled, but pares earlier losses to stand flat on the day as the European open approached. The aussie was last trading at $0.7619, while the kiwi stood was at $0.6882.
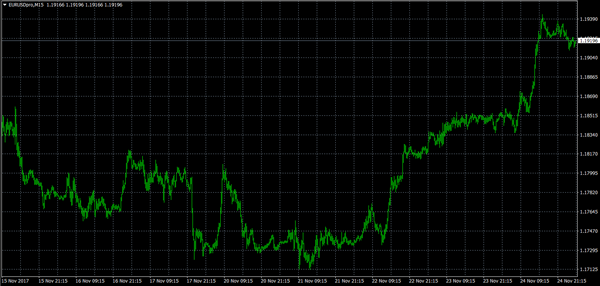
European currencies fared better with the euro climbing to two-month highs and the pound not too far from Friday's 1½-month high against the greenback. The euro was boosted last week from strong Eurozone PMI and German Ifo business surveys. Further lifting the single currency in recent days is news that Germany's SPD party have decided to pursue coalition talks with Angel Merkel's CDU party, following the collapse of the Jamaica coalition talks, and thus staving off fresh elections in the country. The euro broke above $1.1950 in early European trading today, its highest since September 22.
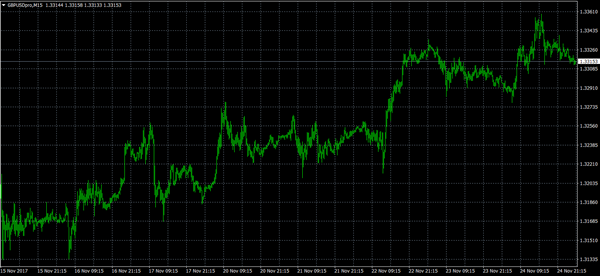
Sterling meanwhile has been rising on the back of growing hopes that the UK and EU are getting closer to a deal on the Brexit divorce terms after Theresa May raised her offer of the divorce bill. The pound was last trading at $1.3333, just shy of Friday's peak of $1.3359.
In commodities, gold surged back above $1290 an ounce as investors were drawn to the precious metal's safe-haven allure. Oil prices slipped back though, with WTI oil futures retreating from Friday's two-year high of $59 a barrel to fall to $58.33. Crude oil prices will remain in focus this week as OPEC and some non-OPEC countries meet in Vienna on November 30 to discuss extending the output cap deal by a further nine months until the end of 2018.
Bitcoin Smashing $9600 Not As Impressive As Ether’s Performance | OPEC, Who Holds The Key? | European Markets Lower,...
Bitcoin crushed $9600 mark
Major week focus; OPEC, Fed, BOE stress Test
Merkel grand coalition continues
Good Bye Balck Friday, Hello Cyber Monday
Bitcoin Doesn't Hold Smashing Record For This Year
There is only one headline which is worth looking at and grabbing the investor attention; Bitcoin smashed the level of $9500. A few weeks back, when the price of Bitcoin was trading near $8000, it became clear that investor would push this derivative toward the 10K mark given the strong demand global demand it has. Although a lot of noise and headlines are made by Bitcoin this year, however, it is Ether (another cryptocurrency coin) that holds the best performance of the year with over 5,500% gain.
The overall mood among European equity traders is not so positive as traders over in Asia didn't pay much attention to the positive close on Wall Street or to any of the Donald Trump's tweets about the tax reform. The sharp close on Wall Street on Friday was largely due to the fact that traders were making enormous bets about the Black Friday's shopping enthusiasm amid shoppers. Investors are expecting mammoth number from the retailers on the back of this.
Over in Europe, the focus is mainly going to remain on central left Social Democratic Party SPD which has adopted the correct path in order to form a coalition with Angela Merkel. A vast majority of SPD's member have shown their positive attitude over the weekend to reignite the coalition process.
It is mainly the political drama which is holding Germany back otherwise the economic numbers are showing solid performance. For instance, the business confidence that came out on Friday was encouraging. The upward trajectory for the Euro relies on the coalition talks and a more favourable outcome would push traders to move the euro higher against its major pairs.
This week has a particular importance for investors due to a number of key events unfolding which includes the OPEC meeting, Bank of England performing a stress test, the Federal Reserve coming in the spotlight and of course the US tax reform. Trump is going to get another chance to push his agenda as high as he can during his lunch meeting with Senate Republicans on Tuesday and the voting outcome could come as early as Thursday.
It is Royal Bank of Scotland which would grab the most amount of attraction when the Bank of England would release its stress test result on Tuesday. This is because the bank had to sell its assets to shore up the capital requirements during the BOE's previous stress test. The other two banks which would also be a matter of interest for traders are Barclays and Standard bank; both have resumed their dividend. The stress test would highlight if this was a right step for these banks and they are not getting ahead in order to please their investors.
OPEC: Russia and Saudia Arabia Hold the Key
Russia and Saudi Arabia hold the key when it comes to the upcoming OPEC meeting this week. The Russian crude oil production before the vienna accord was at 30 years high but since then it has dropped below 11million b/d. This shows the strong hand which Russia plays and without Russian intentions and its compliance, extending the unprecedented accord under which OPEC curbed its production output would be impossible. The soaring oil price has given much incentive to US shale oil drillers to strengthen their position as well, as a result, we have seen a strong evidence of an increase in the oil rigs which have come back in operation. Sadly, this week's OPEC meeting would not have an endnote saying mission accomplished, in fact far from it. The cartel would extend the production cut further in an attempt to reduce the glut further.
EUR/USD Elliott Wave Analysis
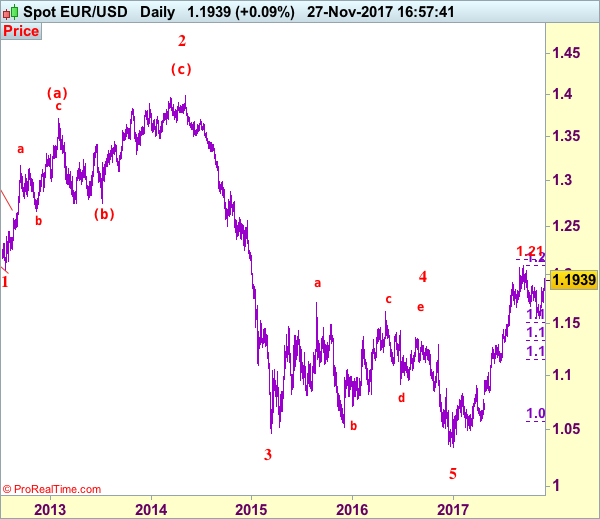
EUR/USD – 1.1939
EUR/USD: Wave (c) of 2 ended at 1.3993 and wave 3 of III has commenced for weakness to 1.0411 (1.236 of wave 1), then 1.0000.
The single currency only eased to 1.1713 last week before finding renewed buying interest (just missed our long entry at 1.1700) and broke above previous resistance at 1.1861-80, adding credence to our bullish view that the corrective fall from 1.2093 top has ended at 1.1554, hence upside bias remains for further gain towards 1.2000. Looking ahead, only a break above resistance at 1.2035 would retain bullishness and signal early upmove has resumed for retest of 1.2093 first. A break of this resistance would confirm resumption of recent upmove from 1.0340 low for headway to 1.2150-55 (61.8% projection of 1.1119-1.1910 measuring from 1.1662), then 1.2200-10.
Our preferred count on the daily chart remains that a wave (II) from 1.2329 ended at 1.5145 with A-leg ended at 1.4720, followed by wave B at 1.2457, the wave C from there was also a 3 legged move and is labeled as (a): 1.3739, (b): 1.2885, the wave iii of the 5-waver (c) from 1.2885 has ended at 1.4339 and wave iv is a triangle ended at 1.3878 and wave v formed a top at 1.5145. The decline from there is a 5-waver (C) with minor wave (i) of I of (C) ended at 1.4218 with wave (ii) ended at 1.4580, wave (iii) ended at 1.3267 and wave (iv) ended at 1.3692 and wave (v) ended at 1.1876, this is also the low of wave I of (C) and wave II ended at 1.4940, hence wave III is now in progress with a diagonal wave 1 ended at 1.2042, the breach of previous support at 1.1876 (wave I trough) adds credence to our view that the wave 2 has ended at 1.3993, wave 3 has commenced for further weakness to 1.0411, then towards 1.0000.
On the downside, whilst pullback to 1.1880 (previous resistance turned support) cannot be ruled out, reckon 1.1800 would hold and bring another rise later. Below said support at 1.1713 would abort and signal the rise from 1.1554 low has ended, bring weakness to 1.1650-60 but price should stay well above said support at 1.1554, bring another rebound later.
Recommendation: Buy at 1.1880 for 1.2080 with stop below 1.1780.
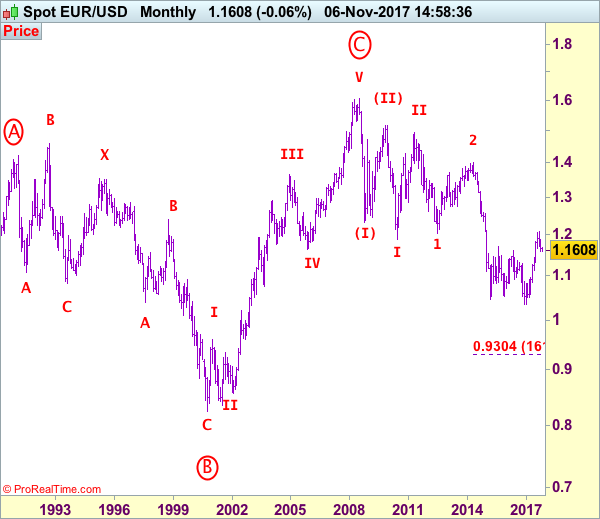
Euro's long-term uptrend started from 0.8228 (26 Oct 2000) with an impulsive structure. The rise from 0.8228 to 0.9593 (5 Jan 2001) is labeled as wave I, the retreat to 0.8352 (6 Jul 2001) is wave II and the rally to 1.3670 (31 Dec 2004) is wave III. Wave IV from there ended at 1.1640 (15 Nov 2005), the subsequent upmove to 1.6040 (July 15, 2008) is treated as wave V, the major selloff from the record high of 1.6040 to 1.2329 (October 27, 2008) signals a reversal has taken place with (I) leg ended at 1.2329 and once (II) ended at 1.5145, wave (III) itself is an extended move with I: 1.1876 and complex wave II ended at 1.4902, wave III has commenced with wave 1 and 2 ended at 1.2042 and 1.3993 respectively, wave 3 of III is now unfolding for weakness towards parity.
EURUSD Broadening Top Formed Between D L3 And D H3 Pivots
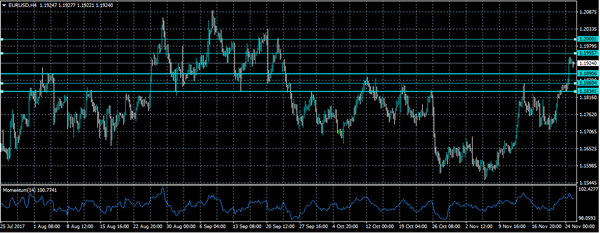
The EUR/USD has been progressing towards upper resistance levels with a bullish zigzag and a form of inverted pennant (Broadening top with a flagpole). We can spot the pattern exactly between L3 and D H3 camarilla pivots. A retracement to the POC zone ( D L3, ATR low, trend line) 1.1890-1.1905 could spur another rally towards 1.1960. If we don't see a retracement to the POC zone pay attention to a possible continuation above 1.1960 D H3. Strong momentum candle or a 4h close above D H3 - 1.1960 should target 1.1990 and possibly 1.2038 on a further bullish momentum.
W L3 - Weekly Camarilla Pivot (Weekly Interim Support)
W H3 - Weekly Camarilla Pivot (Weekly Interim Resistance)
W H4 - Weekly Camarilla Pivot (Strong Weekly Resistance)
D H4 - Daily Camarilla Pivot (Very Strong Daily Resistance)
D L3 – Daily Camarilla Pivot (Daily Support)
D L4 – Daily H4 Camarilla (Very Strong Daily Support)
POC - Point Of Confluence (The zone where we expect price to react aka entry zone)
Technical Outlook: USDJPY – Bearish Bias Below 200SMA
The pair is in red in early Monday's trading with near-term risk turning lower, after recovery attempts from strong 111.02 support (Fibo 50% of 107.31/114.73 rally) were short-lived and capped by 200SMA (111.70).
Immediate risk lies at 111.02 pivot, firm break of which would signal an end of near-term consolidation and resumption of bear-trend from 114.73 (06 Nov peak) towards our targets at 110.70 (daily cloud base) and 110.15 (Fibo 61.8% of 107.31/114.73) in extension.
Only firm break above 200SMA would sideline bearish threats while return and close above daily cloud top is needed to neutralize and signal higher base formation.
Res: 111.70, 112.08, 112.27, 112.90
Sup: 111.15, 111.02, 110.70, 110.15
US Data Headlines SLow Releae Schedule On Monday
The financial calendar will leave more questions than answers on Monday, as a dearth of economic data keeps investors fixated on geopolitics and President Trump’s push for tax reform. The calendar will feature more noteworthy events as the week progresses.
Action begins in Europe on Monday with the release of Swiss employment data at 08:15 GMT. The report will provide a quarterly snapshot of employment growth in Switzerland.
Later in the morning, the Italian government will release the consumer confidence index for November. The monthly gauge is a proxy for consumer spending, which is a major driver of the domestic economy. Separately, a government report on business confidence will also make headlines.
In terms of monetary policy, the European Central Bank (ECB) will release its biannual Financial Stability Review at 09:00 GMT. The report provides a detailed discussion of the possible sources of risks and vulnerability throughout the region.
The ECB will hold its next Governing Council meeting in Frankfurt on 14 December.
Shifting gears to the United States, the National Association of Realtors (NAR) will report on new home sales for the month of October. The report, which hits the newswires at 15:00 GMT, is expected to show a broad decline in new home sales last month. Sales skyrocketed 18.9% in September to a seasonally adjusted 667,000.
Later in the day, the Federal Reserve Bank of Dallas will release the manufacturing business index for the month of November. The monthly indicator provides an assessment of the state’s manufacturing activity, which provides key input into other indicators. Texas is one of America’s most economically powerful states.
In currencies, the US dollar index edged slightly higher on Monday, but remained in a firm downtrend extending all the way back to the start of the month. The DXY basket is currently trading at multi-month lows.
EUR/USD
Europe’s common currency lost ground against the dollar on Monday, but traded well above 1.1900 US. The EUR/USD faces immediate resistance at 1.1943, which is the high from 22 September. On the flipside, immediate support is located at 1.1880.
GBP/USD
Cable was down at the start of the week, but continued to hold above the critical 1.3300 level. GBP/USD has been on a sharp upward trajectory extending back several weeks. The pair faces immediate support at 1.3280. On the other side, 1.3370 represents the first resistance level.
USD/JPY
The USD/JPY edged slightly lower on Monday, but continued to hover well above the 111.00 mark. The pair is currently trading at 111.37, with immediate resistance located at the 100 and 200 DMAs near 111.60. On the other side of the ledger, support is located near the 111.00 psychological zone.
Trade Idea: GBP/USD – Buy at 1.3260
GBP/USD – 1.3341
New strategy :
Buy at 1.3260, Target: 1.3450, Stop: 1.3200
Position: -
Target: -
Stop:-
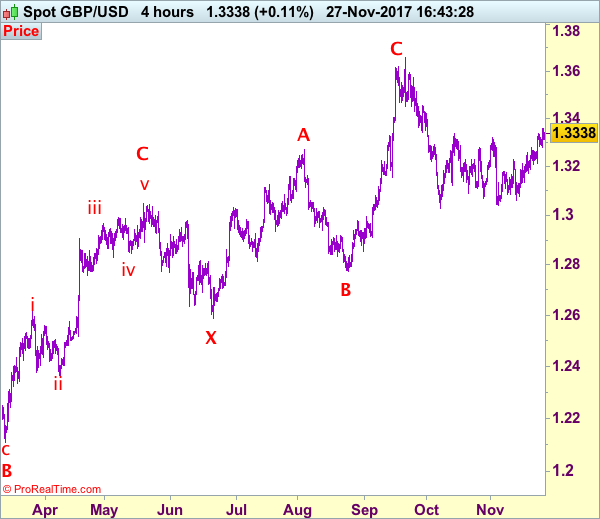
As cable has maintained a firm undertone after breaking above indicated resistance at 1.3338, adding credence to our view that a possible upside break of recent established broad range has occurred, hence upside bias remains for the erratic rise from 1.3027 low to extend further gain to 1.3400, however, near term overbought condition should limit upside and price should falter below 1.3470, bring retreat later. Our preferred count is that (pls see the attached chart) the wave IV is unfolding as a complex double three (ABC-X-ABC) correction with 2nd wave B ended at 1.2774, hence 2nd wave C could have ended at 1.3658.
In view of this, we are looking to buy cable on pullback as 1.3250-60 should limit downside and bring another rise later. Below support at 1.3209-13 would defer and suggest top is possibly formed, bring correction to 1.3150-60 and then 1.310 but reckon 1.3100 would hold, bring another rebound later.
Our preferred count on the daily chart is that cable's rebound from 1.3500 (wave (A) trough) is unfolding as a wave (B) with A ended at 1.7043, followed by triangle wave B and wave C as well as wave (B) has ended at 1.7192, the subsequent selloff is the larger degree wave (C) which is still unfolding with minor wave (III) of larger degree wave 3 ended at 1.1986, hence wave (IV) correction is in progress which could either be a triangle wave (IV) of a complex formation but upside should be limited to 1.3500 and price should falter well below 1.4000, bring another decline in wave (V) of 3 for weakness to 1.1500, then 1.1200.
EURO Strongly Bullish ABove 1.1890
The euro pushed sharply higher against the U.S dollar on Friday, reaching 1.1940, amidst low trading volumes. The EURUSD pair has opened the week above the 1.1900 level, with price-action currently hovering around the 1.1920 region. Traders are likely to seek further technical confirmation that the break higher was genuine, as U.S traders return to their desks after Thanksgiving holidays. Later today traders will look to New Home Sale data from the U.S to set the tone for the U.S dollar.
The EURUSD pair remains strongly bullish while trading above the 1.1890 technical level. Further upside towards 1.1955 and the psychological 1.2000 level seems likely.
A sustained loss of the 1.1890 level should lead to a euro price-correction towards the 1.1855 and 1.1830 technical levels.
GBPUSD Remains A buy ABove 1.3307
The British pound moved to a 5-week trading high against the U.S dollar on Friday, hitting 1.3360. The pair currently trades around the 1.3320 level, as the greenback slightly advances, after coming under intense selling pressure on Friday. The GBPUSD pair has a series of key macro-economic risk events this week, including UK and U.S GDP releases, and Manufacturing data from both sides of the Atlantic. The dip buying mentality that we have seen in sterling, is likely to continue whilst the 1.3307 technical support level is strongly defended.
The GBPUSD pair remains strongly technically bullish while holding price-action above the 1.3307 level. Further upside towards the 1.3360 and 1.3400 levels appears possible this week.
Should price-action on the GBPUSD pair start to decline below the 1.3307 support level, sellers will likely push the pair towards the 1.3268 level. Extended support is found at the 1.3230 level.
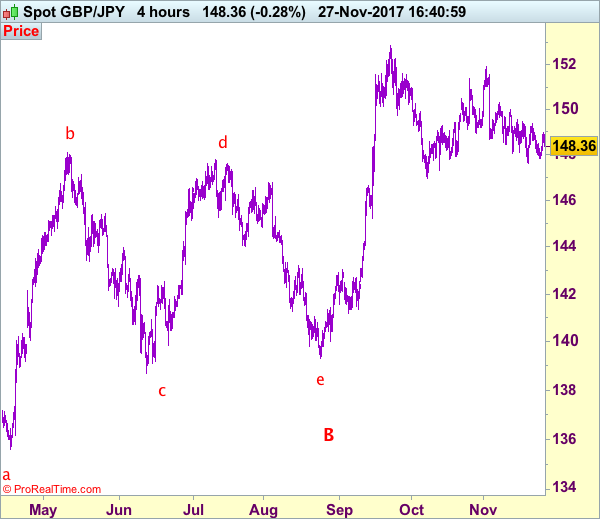
Trade Idea: GBP/JPY – Buy at 148.00
GBP/JPY - 148.40
New strategy :
Buy at 148.00, Target: 149.70, Stop: 147.60
Position: -
Target: -
Stop:-
Although sterling met resistance at 148.95 on Friday and has retreated, as outlook remains consolidative, reckon downside would be limited to 148.00 and as long as indicated support at 147.65 (last week’s low) holds, prospect of another rebound remains, above said resistance at 148.95 would bring subsequent bounce to 149.45-55, however, reckon resistance at 149.70 would cap upside and bring retreat later. Only a break above this level would signal the fall from 151.90 top has ended and bring further subsequent gain to 150.00 resistance, then towards another previous resistance at 150.30 which is likely to hold from here.
In view of this, we are looking to buy sterling on dips. Below said support at 147.65 would signal the erratic decline from 151.90 top has resumed and bring retracement of early rise to support at 147.30, then 146.90-00 but oversold condition should limit downside to 146.40-50, bring another rebound later.
Our preferred count is that larger degree wave V with circle is unfolding from 251.12 with wave (I) 219.34, (II): 241.38 and wave (III) is subdivided into 1: 192.60, 2: 215.89 (23 Jul 2008) and wave 3 ended at 118.87 earlier in 2009. The correction from there to 162.60 is wave 4 which itself is a double three and is labeled as first a-b-c ended at 151.53, followed by wave x at 139.03, 2nd a ended at 162.60, 2nd b at 146.75 and 2nd c leg of wave 4 ended at 163.00. Therefore, the decline from 163.00 to 116.85 is now treated as wave 5 which also marked the end of larger degree wave (III), hence wave (IV) major correction has commenced for retracement of the wave (III) from 241.38 and upside target at 183.95-00 (50% Fibonacci retracement of the wave (II) from 241.38) had been met, a drop below 160.00 would suggest wave (IV) has ended at 195.85, bring decline in wave (V) for initial weakness to 130 (already met) and 120.