
Sample Category Title
EURUSD Bearish In The Short-Term But Little Changed In The Big Picture
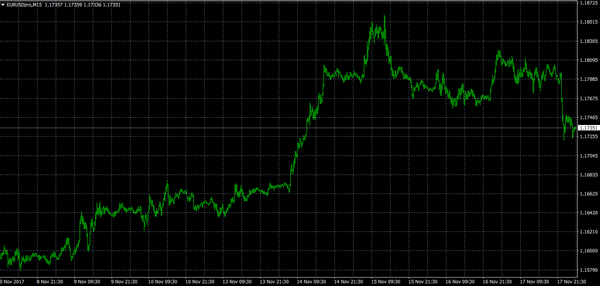
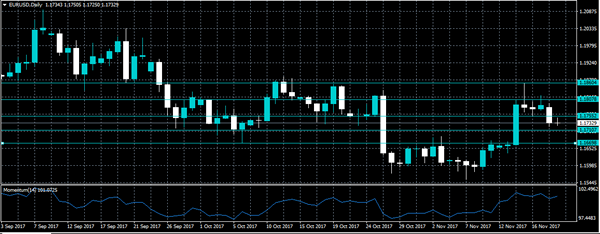
EURUSD is bearish in the short-term but is little changed in the big picture with little signs of a reversal in the underlying bull trend.
The market is currently testing the 50-day moving average after breaking below the 23.6% Fibonacci retracement level of the rise from 1.0820 to 1.2091. The intra-day bias is tilted to the downside with scope to target the 38.2% Fibonacci at 1.1603 and then support at the 50% retracement at 1.1453. A further extension lower from here would bring prices to a critical level at 1.1300 (near the 61.8% Fibonacci). A move below this area would shift the overall trend to bearish.
A daily close above the immediate resistance level at 1.1792 would weaken the near-term bearish bias and turn the market’s focus back to the upside with scope to re-test the 1.2091 peak, the highest in almost 3 years. From this point, the odds are high for a move towards 1.2500.
The medium-term technical picture still remains positive and the 50 and 200-day moving averages maintain a bullish alignment. The shorter-term bias is weaker as the market remains capped below 1.1880.
Slow Monday Session Likely To Keep Investors Focused On Politics
A dearth of economic data on Monday will keep investors glued to US political developments as Republicans race against time to implement a new tax bill before the year’s end.
The day begins at 07:00 GMT with a report on German producer inflation. The producer price index (PPI) is forecast to rise 0.2% in October after climbing 0.3% the month before. This translates into a year-over-year gain of 2.7%. Annualized PPI came in at 3.1% in September.
Later in the session, the Greek government will report on the current account balance for the month of September. The August balance showed a surplus of €1.827 billion when measured in year-over-year terms.
At 14:00 GMT, European Central Bank (ECB) President Mario Draghi will deliver a speech that will be closely watched by the financial markets. The ECB is embarking on a long path to policy normalization after announcing it will begin to wind down its quantitative easing program next year. However, policymakers said there is a good chance that stimulus will continue longer than previously expected.
It is unlikely that Trump’s Republicans will pass much needed tax reform this year. Several members of his own party have lashed out against the proposed reforms, signaling that they will not support any measure that increases the deficit. Trump’s tax plan intends to make up for the shortfall with added growth.
US markets are expected to see diminished volume as the week draws to a close as traders take a few extra days off for the Thanksgiving holiday. This could impact US dollar pairs on Thursday and Friday.
EUR/USD
The euro slammed on the breaks Monday, falling sharply below the 1.1800 handle. The EUR/USD touched a session low near 1.1720. It would later recover near 1.1732 for a daily drop of 0.5%. The pair has fallen below the immediate support level of 1.1745. The psychological 1.1700 level is the next zone of support, followed by 1.1665. On the opposite side of the ledger, immediate resistance is located at 1.1830, followed by 1.1860 and 1.1890.
USD/JPY
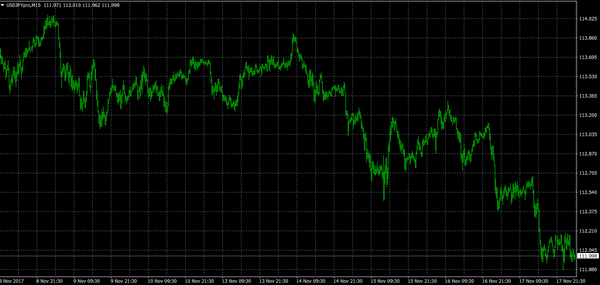
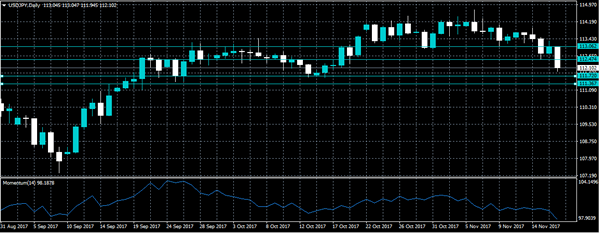
The dollar traded within a narrow range against the yen on Monday, as the pair continued to hold near 112.00. Prices remain well supported above 111.90. A clean break below that level would expose heavier losses toward 111.50, which is a critical support level.
GBP/USD
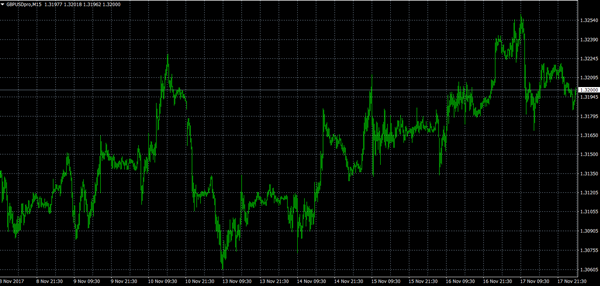
Cable traded within a narrow range at the start of the week, with the GBP/USD holding slightly above 1.3200. The pair faces immediate resistance at 1.32330, followed by 1.3260. Pound sterling remains at the mercy of Brexit talks, which means investors can expect further volatility in the near term. Economic data from both sides of the Atlantic can also influence this trade.
EURO Intraday Bearish Below 1.1755 Level
The euro is under severe pressure against the U.S dollar after coalition talks between Angela Merkel's CDU party and the FDP party have broken down, bringing political uncertainty to Germany. After last week's strong trading gains, the EURUSD pair currently trades around the 1.1730 level. Traders are likely to remain tempered by today's risk-off trading theme, which is currently dominating intraday sentiment. Financial markets now await a key-note speech from ECB President Mario Draghi and any political news from Germany.
The EURUSD pair is intraday bearish while trading below the 1.1755 technical level. Further downside towards the 1.1710 and 1.1679 support levels looks likely.
Should price action move above the 1.1755 level, further technical buying towards the 1.1807 level remains possible.
USDJPY Intraday Bearish Below 112.47 Level
The U.S dollar continues to trade on the back-foot against the Japanese yen currency, after a strongly bearish Friday price-close, price-action now hovers around the 112 handle. A broad-based sell-off in global stock has led to a further strengthening of Japanese yen, as traders move into the perceived safety of the yen currency. USDJPY traders are likely to remain cautious early week, with the breakdown of coalition talks in Germany and the release of the Federal Open Market Committee Meeting Minutes.
The USDJPY pair remains bearish on an intraday basis while trading below the 112.47 technical level. Further losses towards the 111.72 and 111.36 look increasingly likely.
Should the USDJPY pair trade back above the 112.47 technical level, buyers will likely push price-action towards the 113.07 resistance level.
EUR/USD Elliott Wave Analysis
EUR/USD – 1.1777
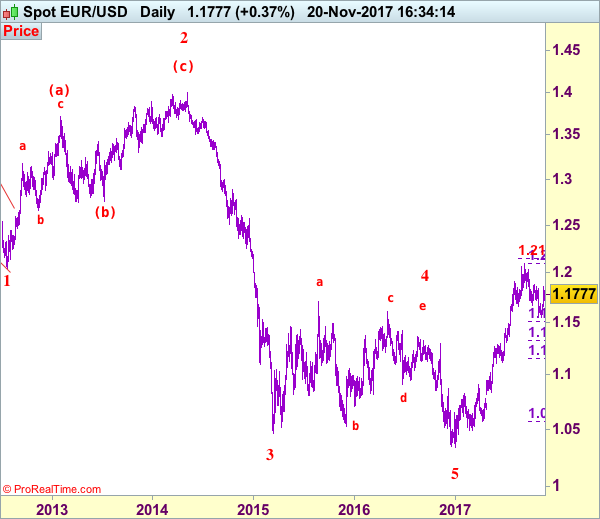
EUR/USD: Wave (c) of 2 ended at 1.3993 and wave 3 of III has commenced for weakness to 1.0411 (1.236 of wave 1), then 1.0000.
Euro’s stronger-than-expected rebound from 1.1554 dampened our bearishness an signal the corrective fall from 1.2093 top has possibly ended there, hence consolidation with upside bias is seen for gain towards resistance at 1.1880, however, a daily close above there is needed to add credence to this view, bring further subsequent rise to 1.1930-40, then towards 1.2000. Looking ahead, only a break above resistance at 1.2035 would retain bullishness and signal early upmove has resumed for retest of 1.2093 first. A break of this resistance would confirm recent upmove from 1.0340 low has resumed for headway to 1.2150-55 (61.8% projection of 1.1119-1.1910 measuring from 1.1662), then 1.2200-10.
Our preferred count on the daily chart remains that a wave (II) from 1.2329 ended at 1.5145 with A-leg ended at 1.4720, followed by wave B at 1.2457, the wave C from there was also a 3 legged move and is labeled as (a): 1.3739, (b): 1.2885, the wave iii of the 5-waver (c) from 1.2885 has ended at 1.4339 and wave iv is a triangle ended at 1.3878 and wave v formed a top at 1.5145. The decline from there is a 5-waver (C) with minor wave (i) of I of (C) ended at 1.4218 with wave (ii) ended at 1.4580, wave (iii) ended at 1.3267 and wave (iv) ended at 1.3692 and wave (v) ended at 1.1876, this is also the low of wave I of (C) and wave II ended at 1.4940, hence wave III is now in progress with a diagonal wave 1 ended at 1.2042, the breach of previous support at 1.1876 (wave I trough) adds credence to our view that the wave 2 has ended at 1.3993, wave 3 has commenced for further weakness to 1.0411, then towards 1.0000.
On the downside, whilst pullback to 1.1700-10 cannot be ruled out, reckon 1.1635-40 would hold and bring another rebound later. Below 1.1600 would risk another test of said support at 1.1554 but only break there would abort and signal the fall from 1.2093 top has resumed for further weakness to 1.1510-15 (38.2% Fibonacci retracement of 1.0570-1.2093), however, reckon downside would be limited to support at 1.1479 and 1.1330-35 (50% Fibonacci retracement) should remain intact, bring rebound later.
Recommendation: Buy at 1.1700 for 1.1900 with stop below 1.1600.
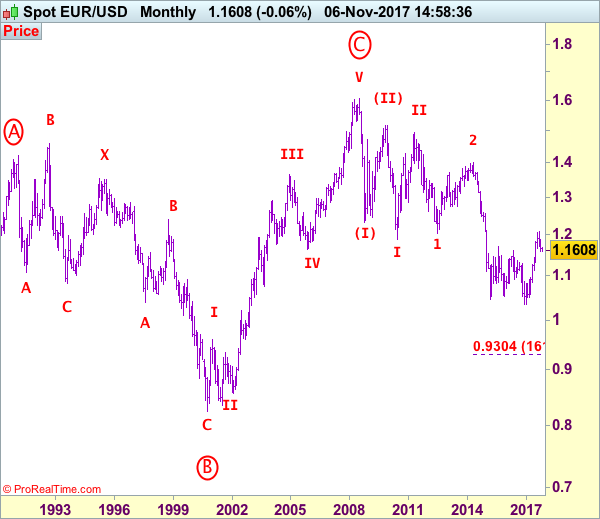
Euro's long-term uptrend started from 0.8228 (26 Oct 2000) with an impulsive structure. The rise from 0.8228 to 0.9593 (5 Jan 2001) is labeled as wave I, the retreat to 0.8352 (6 Jul 2001) is wave II and the rally to 1.3670 (31 Dec 2004) is wave III. Wave IV from there ended at 1.1640 (15 Nov 2005), the subsequent upmove to 1.6040 (July 15, 2008) is treated as wave V, the major selloff from the record high of 1.6040 to 1.2329 (October 27, 2008) signals a reversal has taken place with (I) leg ended at 1.2329 and once (II) ended at 1.5145, wave (III) itself is an extended move with I: 1.1876 and complex wave II ended at 1.4902, wave III has commenced with wave 1 and 2 ended at 1.2042 and 1.3993 respectively, wave 3 of III is now unfolding for weakness towards parity.
Resistance Turned Support For Euro To Dollar
Key Highlights
- The Euro gained bullish momentum this past week and traded above 1.1700 against the US Dollar.
- There was a break above a major contracting triangle with resistance at 1.1765 on the 4-hours chart of EUR/USD.
- The US Building Permits in Oct 2017 increased 5.9%, much better than the forecast of +2%.
- Today in the Euro Zone, the German PPI numbers for Oct 2017 will be released which is forecasted to register an increase of 2.7% (YoY).
EURUSD Technical Analysis
The Euro made a nice upside move this past week and traded above 1.1800 against the US Dollar. The EUR/USD pair traded as high as 1.1859 before starting a downside correction.
During the upside move, there was a break above a major contracting triangle with resistance at 1.1765 on the 4-hours chart. The pair traded as high as 1.1859 before finding resistance and starting a correction.
It moved below the 23.6% Fib retracement level of the last wave from the 1.1554 low to 1.1859 high. However, the same broken triangle is now acting as a support near 1.1720 along with the 200 simple moving average (green, 4-hour).
As long as the pair is above the 1.1700 and the 50% Fib retracement level of the last wave from the 1.1554 low to 1.1859 high, it remains supported in the near term.
US Building Permits
Recently in the US, the Building Permits Change for Oct 2017 was released by the US Census Bureau, at the Department of Commerce. The forecast was slated for a rise of 2% in the Building Permits compared with the last decline of 4.5%.
However, the actual result was a lot better, as there was an increase of 5.9% in the Building Permits in Oct 2017. The last reading was also revised up from -4.5% to 3.7%.
The report added:
Privately-owned housing units authorized by building permits in October were at a seasonally adjusted annual rate of 1,297,000. This is 5.9 percent (±1.4 percent) above the revised September rate of 1,225,000 and is 0.9 percent (±1.6 percent)* above the October 2016 rate of 1,285,000.
Overall, the EUR/USD pair was pressured after the release, but it remains supported above the 1.1700-1.1720 levels in the near term.
Forex Technical Analysis: EUR/USD, USD/JPY, GBP/USD
EUR/USD
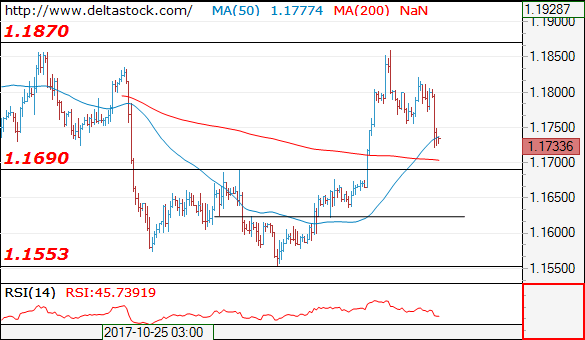
Current level - 1.1733
Today's slide bottomed at 1.1720 and although there is a risk of a dip to 1.1690, my outlook is already counter-trend, for a reversal and rise towards 1.1780 area. Initial hurdle lies at 1.1760.
| Resistance | Support | ||
| intraday | intraweek | intraday | intraweek |
| 1.1760 | 1.1870 | 1.1730 | 1.1690 |
| 1.1870 | 1.2090 | 1.1690 | 1.1550 |
USD/JPY
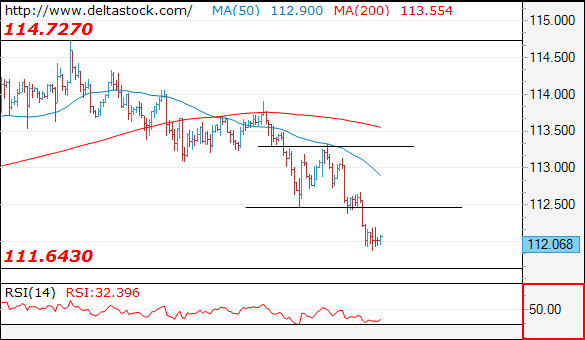
Current level - 112.06
The downtrend is intact, but due to the 111.60 support I favor a reversal, for a climb back to 113.40 area. Initial resistance lies at 112.50.
| Resistance | Support | ||
| intraday | intraweek | intraday | intraweek |
| 112.50 | 115.50 | 111.60 | 111.60 |
| 113.40 | 116.80 | 111.60 | 107.30 |
GBP/USD
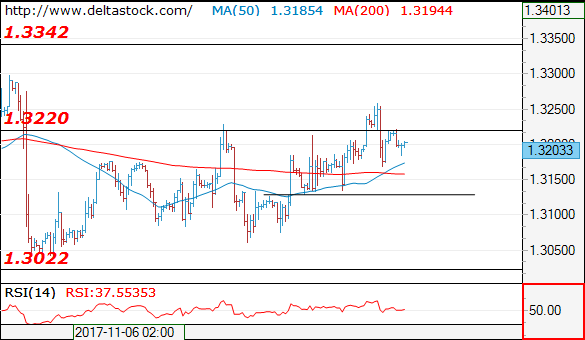
Current level - 1.3203
The overall outlook is positive above 1.3130, for a rise towards 1.3340 zone.
| Resistance | Support | ||
| intraday | intraweek | intraday | intraweek |
| 1.3220 | 1.3340 | 1.3130 | 1.3020 |
| 1.3340 | 1.3430 | 1.3060 | 1.2760 |
Trade Idea: GBP/USD – Stand aside
GBP/USD – 1.3243
New strategy :
Stand aside
Position: -
Target: -
Stop:-
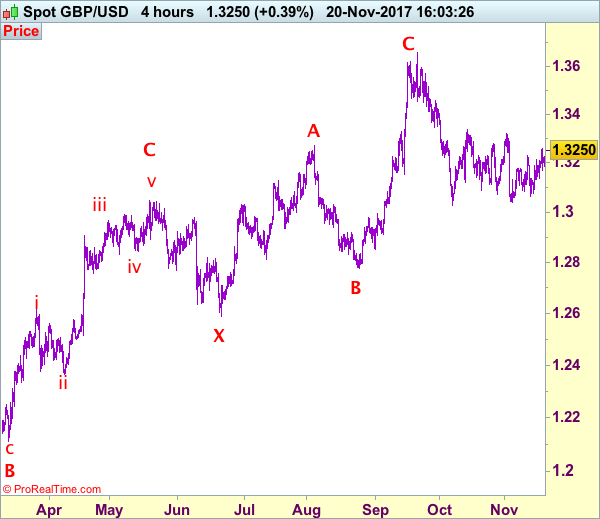
Although cable has maintained a relatively firm undertone after recent rebound and marginal gain above resistance at 1.3260 (last week’s high) cannot be ruled out, as broad outlook remains consolidative, reckon upside would be limited to 1.3300 and reckon resistance area at 1.3321-38 would hold and bring further choppy trading later. Our preferred count is that (pls see the attached chart) the wave IV is unfolding as a complex double three (ABC-X-ABC) correction with 2nd wave B ended at 1.2774, hence 2nd wave C could have ended at 1.3658.
On the downside, whilst pullback to 1.3200 cannot be ruled out, reckon minor support at 1.3170 would contain downside and bring another rise later. A drop below 1.3170 would bring test of 1.3130-35 but break there is needed to signal the rebound from 1.3039 has ended and bring weakness to 1.3100 first, however, reckon support at 1.3062 would hold from here.
Our preferred count on the daily chart is that cable's rebound from 1.3500 (wave (A) trough) is unfolding as a wave (B) with A ended at 1.7043, followed by triangle wave B and wave C as well as wave (B) has ended at 1.7192, the subsequent selloff is the larger degree wave (C) which is still unfolding with minor wave (III) of larger degree wave 3 ended at 1.1986, hence wave (IV) correction is in progress which could either be a triangle wave (IV) of a complex formation but upside should be limited to 1.3500 and price should falter well below 1.4000, bring another decline in wave (V) of 3 for weakness to 1.1500, then 1.1200.
The Week Ahead: Central Bankers, Euro And UK GDP In Focus
Asian shares were depressed on Monday morning, as investors remained guarded amid lingering concerns over U.S. tax reforms.
The caution from Asia is likely to rollover into European markets which are currently tussling with renewed political uncertainty, after German Chancellor Angela Merkel’s failure to form a new government over the weekend. With uncertainty over U.S. tax reforms and political risk in Europe eroding appetite for riskier assets, Wall Street could come under further selling pressure this afternoon.
Central Bankers in the limelight
We could see some fireworks across markets this week as central bank heavyweights such as European Central Bank President Mario Draghi, Bank of England Governor Carney and Fed Chair Janet Yellen take the spotlight. ECB Draghi will be testifying on the economy and monetary policy before the European Parliament in Brussels on Monday, while Mark Carney is set to testify on inflation and the economic outlook before the Treasury Select Committee on Tuesday. With Janet Yellen also due to participate at a panel discussion in New York this week, investors will be on alert to glean fresh insights into monetary policy if they are on the table.
Euro gripped by political uncertainty
The Euro was vulnerable to heavy losses on Monday after German Chancellor Angela Merkel was unable to form a new government on Sunday night.
With this bombshell development heightening concerns over political instability in Europe’s largest economy and sparking speculation of fresh elections, the Euro may be instore for further punishment. Although Europe’s encouraging macro fundamentals may offer some background support to the Euro long term, political risk has the ability to trigger further selloffs in the shorter term.
Taking a look at the technical picture, the EURUSD remains bearish below 1.1850. A breakdown and solid daily close below 1.1730 may encourage a further decline back towards 1.1680 and 1.1600, respectively
Sterling steady against Dollar... but for how long?
There is a growing suspicion that Sterling’s abrupt appreciation last week Friday had nothing to do with a change of sentiment towards the currency but rather Dollar weakness.
This could be a volatile trading session for the currency with the Inflation report parliamentary hearing, Autumn Forecast Statement and second reading of the third quarter GDP all in focus. With inflation still hovering around the highest level in over five years at 3%, it will be interesting to hear Carney’s thoughts at the inflation report hearing on Tuesday. In regards to GDP data released later in the week, Sterling could shed more tears if GDP prints below market estimates.
From a technical standpoint, the GBPUSD punched above the 1.3230 level last week, on the back of Dollar weakness. Bulls have a shot at 1.3300 if prices can keep above the 1.3150 level. Alternatively, sustained weakness below 1.3230 may encourage a further decline back towards 1.3150.
Trade Idea: GBP/JPY – Stand aside
GBP/JPY - 148.45
New strategy :
Stand aside
Position: -
Target: -
Stop:-
Despite falling to 147.65 earlier today, current rebound suggests consolidation above this level would be seen and recovery to 148.90-00 cannot be ruled out, however, reckon resistance at 149.45-55 would cap upside and bring retreat later. Only a break above this level would signal the fall from 151.90 top has ended and bring further subsequent gain to 150.00 resistance, then towards another previous resistance at 150.30 which is likely to hold from here.
On the downside, below said support at 147.65 would signal the erratic decline from 151.90 top is still in progress, bring retracement of early rise to support at 147.30, then 146.90-00 but oversold condition should limit downside to 146.40-50, bring another rebound later. As near term outlook is still mixed, would be prudent to stand aside for now.
Our preferred count is that larger degree wave V with circle is unfolding from 251.12 with wave (I) 219.34, (II): 241.38 and wave (III) is subdivided into 1: 192.60, 2: 215.89 (23 Jul 2008) and wave 3 ended at 118.87 earlier in 2009. The correction from there to 162.60 is wave 4 which itself is a double three and is labeled as first a-b-c ended at 151.53, followed by wave x at 139.03, 2nd a ended at 162.60, 2nd b at 146.75 and 2nd c leg of wave 4 ended at 163.00. Therefore, the decline from 163.00 to 116.85 is now treated as wave 5 which also marked the end of larger degree wave (III), hence wave (IV) major correction has commenced for retracement of the wave (III) from 241.38 and upside target at 183.95-00 (50% Fibonacci retracement of the wave (II) from 241.38) had been met, a drop below 160.00 would suggest wave (IV) has ended at 195.85, bring decline in wave (V) for initial weakness to 130 (already met) and 120.
