
Sample Category Title
EUR/USD Daily Outlook
Daily Pivots: (S1) 1.1760; (P) 1.1791 (R1) 1.1817; More...
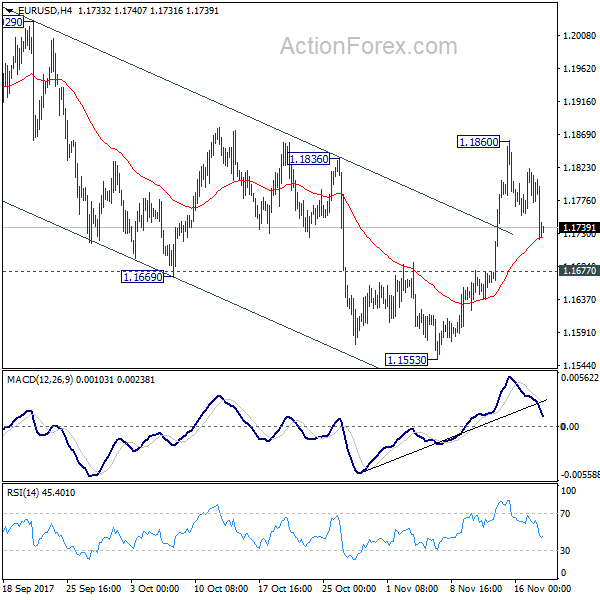
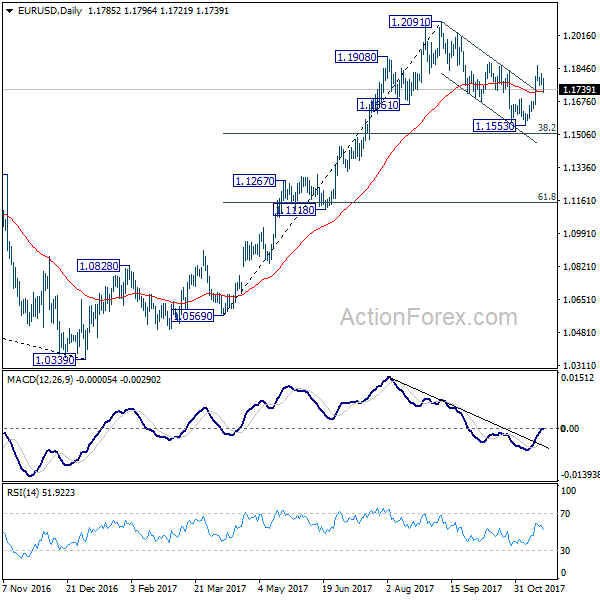
EUR/USD's pull back from 1.1860 extends lower today but stays above 1.1677 minor support. Intraday bias remains neutral first and another rise is expected. As noted before, corrective fall from 1.2091 has completed at 1.1553 already, ahead of 38.2% retracement of 1.0569 to 1.2091 at 1.1510. Above 1.1860 will turn bias to the upside for retesting 1.2091 high. However, break of 1.1677 will dampen this bullish view and turn focus back to 1.1553 low instead.
In the bigger picture, rise from 1.0339 medium term bottom is seen as a corrective move for the moment. Therefore, in case of another rally, we'd be cautious on 38.2% retracement of 1.6039 (2008 high) to 1.0339 (2017 low) at 1.2516 to limit upside and bring reversal. Meanwhile, sustained trading below 55 week EMA (now at 1.1373) will suggest that such medium term rebound is completed and could then bring retest of 1.0339 low.
USD/JPY Candlesticks and Ichimoku Analysis
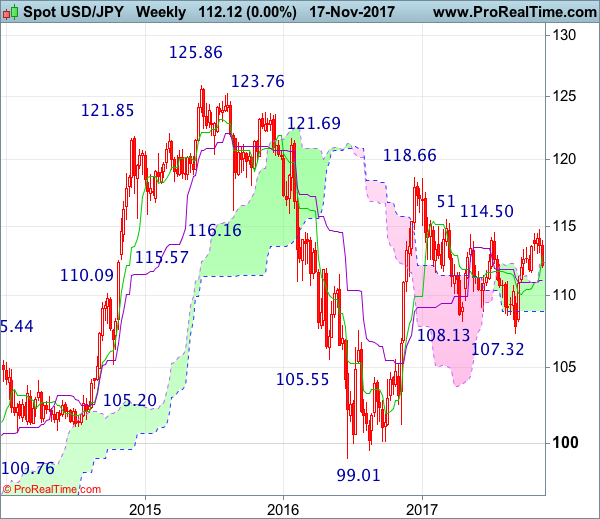
Weekly
• Last Candlesticks pattern: Dark cloud cover
• Time of formation: 10 Jul 2017
• Trend bias: Down
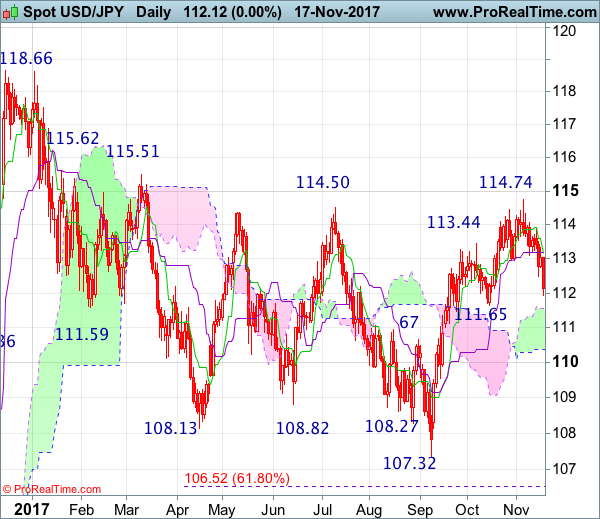
Daily
• Last Candlesticks pattern: Evening doji
• Time of formation: 7 Aug 2017
• Trend bias: Down
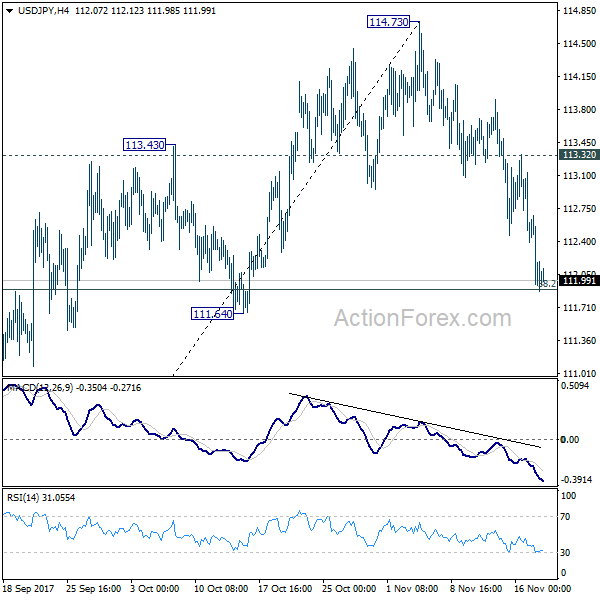
USD/JPY – 112.09
Although the greenback rebounded initially to 113.91, dollar had met heavy selling pressure there and dropped quite sharply since, dampening our bullishness and suggesting a temporary top has been formed at 114.74, hence consolidation with mild downside bias is seen for test of previous support at 111.65, however, break there is needed to retain bearishness and extend the fall from 114.74 top for retracement of recent upmove to 111.00, having said that, reckon the lower Kumo (now at 110.38) would contain downside, price should stay above 110.00, bring rebound later due to near term oversold condition.
On the upside, whilst recovery to 112.50-60 cannot be ruled out, reckon the Tenkan-Sen (now at 112.98) would limit upside and bring another decline later. Above 113.45-50 would bring another test of said resistance at 113.91 but only a daily close above this last week’s high) would suggest low is formed instead, bring a stronger rebound to 114.10-20 and later retest of said recent high at 114.74. Looking ahead, only a break above this level would revive bullishness and signal early fall from 118.66 has ended and extend the rise from 107.32 to 115.00, then towards previous resistance at 115.51-62.
Recommendation : Sell at 112.90 for 110.90 with stop above 113.90
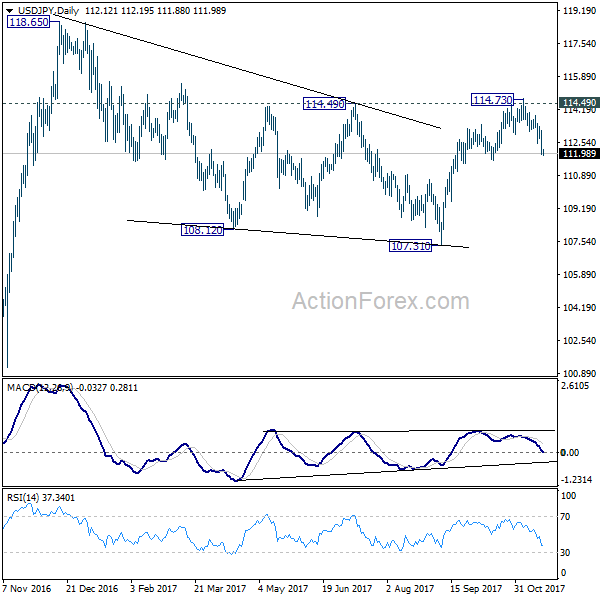
On the weekly chart, despite early brief breach of previous resistance at 114.50, lack of follow through buying and the subsequent stronger-than-expected retreat formed another long black candlestick, suggesting a temporary top has been formed at 114.74, hence consolidation with mild downside bias is seen for weakness to previous support at 111.65, break there would extend fall to the Kijun-Sen (now at 111.03), however, near term oversold condition should limit downside to 110.40-50 and reckon 110.00 would hold from here.
On the upside, expect recovery to be limited to 112.50-60 and reckon the Tenkan-Sen (now at 113.11) would hold and bring another decline later. A weekly close above the Tenkan-Sen would bring test of said last week’s high at 113.91 but only break there would revive bullishness and signal the retreat from 114.74 has ended, bring retest of this level. Once this resistance is penetrated, this would extend recent rise from 107.32 to 115.51-62 resistance area, break there would add credence to our view that early erratic decline from 118.66 has ended at 107.32, then headway to 116.50-60 and possibly 117.00-10 would follow.
GBP/USD Daily Outlook
Daily Pivots: (S1) 1.3168; (P) 1.3213; (R1) 1.3258; More....
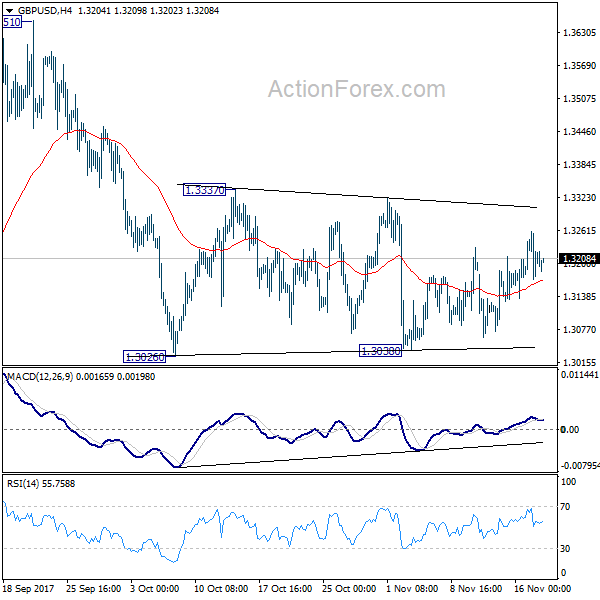
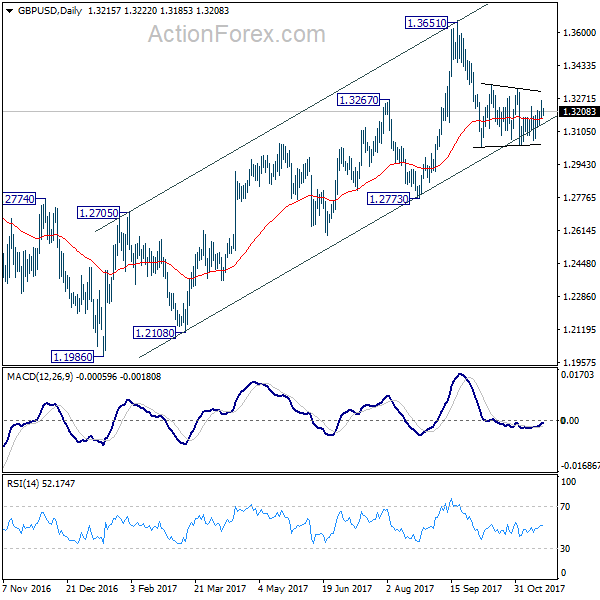
GBP/USD remained bounded in range of 1.3026/3337 and intraday bias remains neutral first. Upside of recovery should be limited below 1.3337 resistance to bring fall resumption. Break of 1.3038 will now resume decline from 1.3651 to 1.2773 key support level. However, decisive break of 1.3337 will indicate that pull back from 1.3651 is completed and medium term rise from 1.1946 is resuming.
In the bigger picture, as noted before, GBP/USD hit strong resistance from the long term falling trend line. Current development is starting to favor that corrective rebound from 1.1946 low has completed at 1.3651. Decisive break of 1.2773 will confirm this bearish case and target a test on 1.1946 low next, with prospect of resuming the low term down trend. Nonetheless, break of 1.3320 resistance will restore the rise from 1.1946 for 38.2% retracement of 2.1161 (2007 high) to 1.1946 (2016 low) at 1.5466.
USD/CHF Daily Outlook
Daily Pivots: (S1) 0.9859; (P) 0.9901; (R1) 0.9926; More....
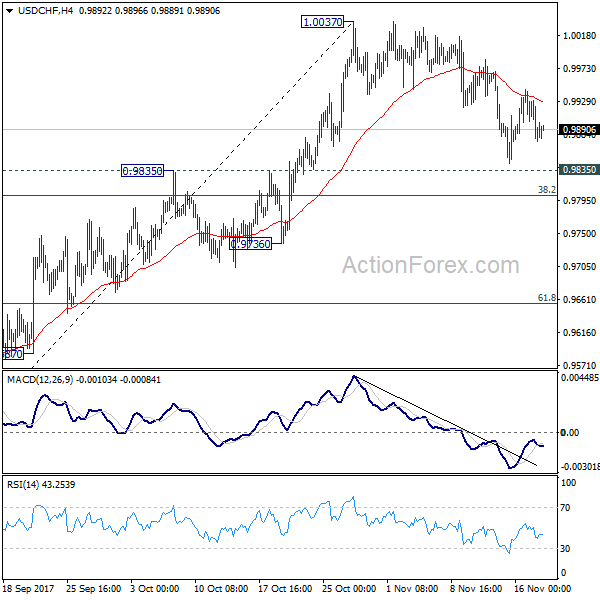
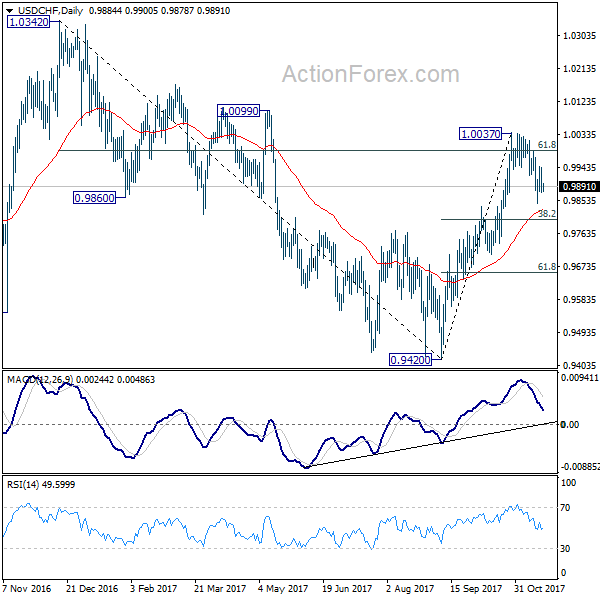
Intraday bias in USD/CHF remains neutral for the moment. On the upside, firm break of 1.0037 resistance will extend the rise from 0.9420 and target 1.0342 high. However, sustained break of 0.9835 resistance turned support will argue that whole rebound form 0.9420 is completed and turn outlook bearish. In that case, USD/CHF should target 61.8% retracement of 0.9420 to 1.0037 at 0.9565 and possibly below.
In the bigger picture, current development suggests that USD/CHF has defended 0.9443 (2016 low) key support level again. Rise from 0.9420 could be a medium term up move and should target a test on 1.0342 high. This represents the upper end of a long term range that started back in 2015. On the downside, break of 0.9736 support is now needed to indicate completion of the rise from 0.9420. Otherwise, further rally will remain in favor in medium term.
USD/JPY Daily Outlook
Daily Pivots: (S1) 111.62; (P) 112.38; (R1) 112.82; More...
Intraday bias in USD/JPY remains on the downside a the decline from 114.73 is in progress. Decisive break of 111.64 support will argue that whole rebound from 107.31 has completed. In that case, deeper fall would be seen to 61.8% retracement of 107.31 to 114.73 at 101.14 and below. On the upside, though, break of 113.32 minor resistance will indicate that the pull back is completed and turn bias back to the upside.
In the bigger picture, medium term rise from 98.97 (2016 low) is not completed yet. It should resume after corrective fall from 118.65 completes. Break of 114.49 resistance will likely resume the rise to 61.8% projection of 98.97 to 118.65 from 107.31 at 119.47 first. Firm break there will pave the way to 100% projection at 126.99. This will be the key level to decide whether long term up trend is resuming. However, firm break of 111.64 support will dampen this view and turn focus back to 107.31 instead.
EUR/AUD Daily Outlook
Daily Pivots: (S1) 1.5500; (P) 1.5578; (R1) 1.5655; More....
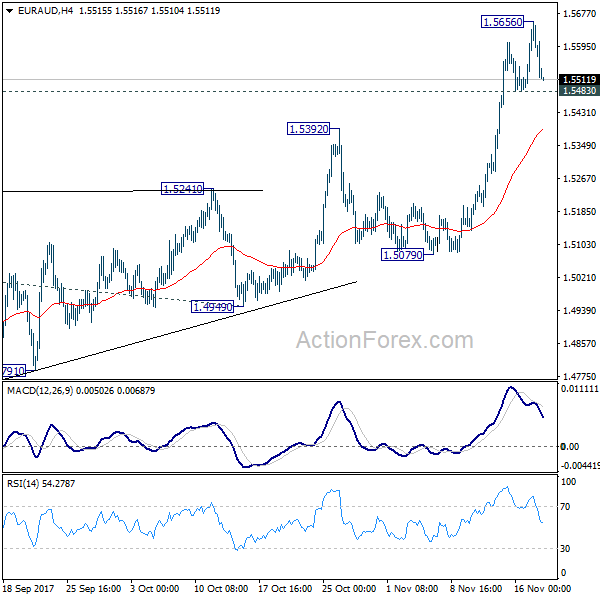
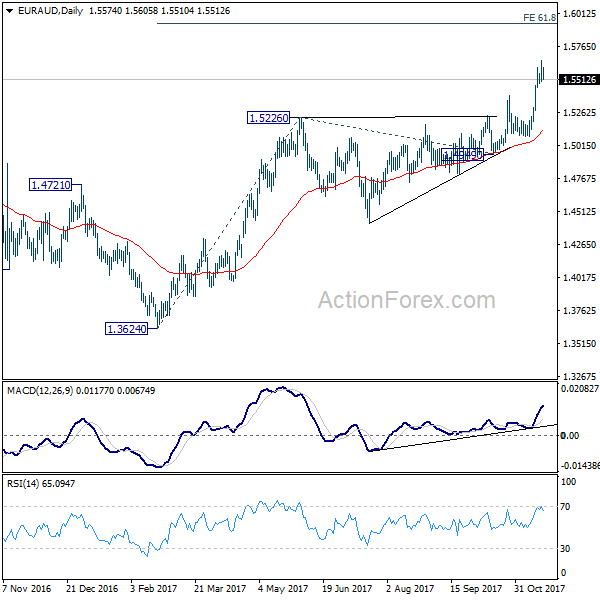
A temporary top is in place at 1.5656 with today's sharp fall. Intraday bias in EUR/AUD is turned neutral first. Some consolidations could be seen. But downside should be contained by 4 hour 55 EMA (now at 1.5390) and bring rise resumption. Above 1.5656 will extend the rally from 1.3624 and target 61.8% projection of 1.3624 to 1.5226 from 1.4949 at 1.5939 first.
In the bigger picture, we're holding on to the view that corrective decline from 1.6587 medium term top (2015 high) has completed at 1.3624. Rise from 1.3624 is expected to extend to retest 1.6587. We'll hold on to this bullish view as long as 1.5226 resistance turned support holds. Firm break of 1.6587 will resume long term rise from 1.1602 (2012 low).
Aussie Trading Lower In The Asian Session
For the 24 hours to 23:00 GMT, the AUD declined 0.25% against the USD and closed at 0.7567 on Friday.
LME Copper prices declined 0.5% or $35.5/MT to $6728.5/MT. Aluminium prices declined 1.4% or $29.0/MT to $2077.0/MT.
In the Asian session, at GMT0400, the pair is trading at 0.7554, with the AUD trading 0.17% lower against the USD from Friday’s close.
The pair is expected to find support at 0.7525, and a fall through could take it to the next support level of 0.7497. The pair is expected to find its first resistance at 0.7593, and a rise through could take it to the next resistance level of 0.7633.
Going forward, minutes of the Reserve Bank of Australia’s (RBA) November monetary policy meeting, due to release overnight, would garner significant amount of market attention.
he currency pair is showing convergence with its 20 Hr moving average and trading below its 50 Hr moving average.

Angela Merkel Fails To Form A New Coalition Government In Germany
For the 24 hours to 23:00 GMT, the EUR rose 0.21% against the USD and closed at 1.1797 on Friday.
On the data front, seasonally adjusted construction output in the Euro-zone climbed 0.1% MoM in September, after recording a revised flat reading in the prior month. Additionally, the region’s seasonally adjusted current account surplus widened to a record high level of €37.8 billion in September, compared to a revised current account surplus of €34.5 billion in the prior month.
Meanwhile, the European Central Bank (ECB) Chief, Mario Draghi, reiterated that Euro-zone’s robust economic recovery was still in need of “substantial” monetary policy support to boost stubbornly low inflation and sluggish wage growth.
The greenback declined against its major peers on Friday, after a probe into Russian influence relating to the 2016 US presidential election deepened.
However, losses in the US Dollar were limited, after better-than-expected economic releases in the US boosted optimism over the health of the nation’s housing sector.
Data showed that housing starts in the US advanced 13.7% on a monthly basis to an annual rate of 1290.0K in October, jumping to a one-year high level, amid a surge in residential construction activity in the South. Markets had expected housing starts to rise to a level of 1190.0K, after recording a revised level of 1135.0K in the prior month.
Moreover, the nation’s building permits advanced 5.9% on monthly basis to an annual rate of 1297.0K in October, notching its highest level in nine months. In the prior month, building permits had registered a revised level of 1225.0K, while investors had envisaged for a rise to a level of 1250.0K.
In the Asian session, at GMT0400, the pair is trading at 1.1737, with the EUR trading 0.51% lower against the USD from Friday’s close, after the German Chancellor, Angela Merkel failed to form a coalition Government which sparked a wave of political uncertainty in the Euro-zone’s largest economy.
The pair is expected to find support at 1.1700, and a fall through could take it to the next support level of 1.1663. The pair is expected to find its first resistance at 1.1796, and a rise through could take it to the next resistance level of 1.1855.
Moving ahead, market participants would focus on a speech by the ECB President, Mario Draghi scheduled in a few hours. Further, the US leading indicator for October, set to release later in the day, will be on investors’ radar.
The currency pair is trading below its 20 Hr and 50 Hr moving averages.

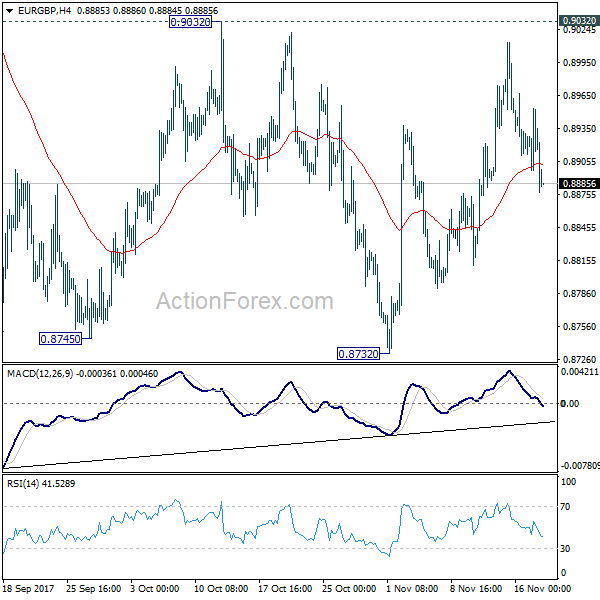
EUR/GBP Daily Outlook
Daily Pivots: (S1) 0.8892; (P) 0.8922; (R1) 0.8947; More...
EUR/GBP is staying in range of 0.8732/0.9032 and intraday bias remains neutral first. With 0.9032 resistance intact, deeper decline is mildly in favor in the cross. Break of 0.8732 will resume the fall from 0.9305 and target 0.8303 key support level. However, on the upside, decisive break of 0.9032 will confirm completion of the decline from 0.9305. In such case, intraday bias will be turned back to the upside for retesting 0.9305 key resistance.
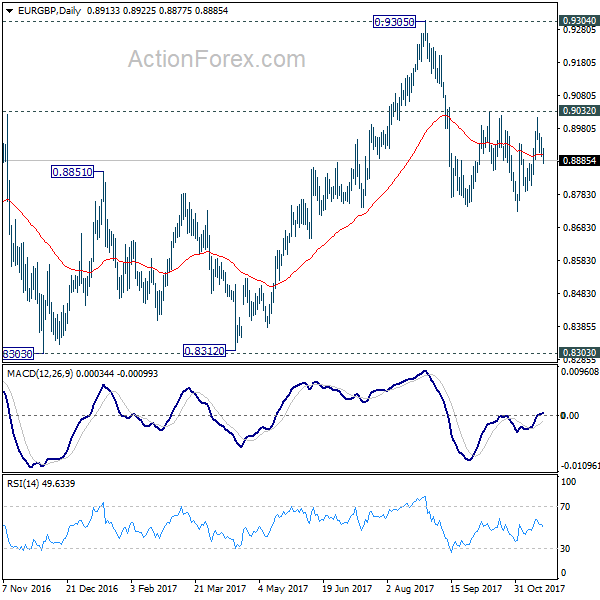
In the bigger picture, there are various ways to interpret price actions from 0.9304 high. But after all, firm break of 0.9304/5 is needed to confirm up trend resumption. Otherwise, range trading will continue with risk of deeper fall. And in that case, EUR/GBP could have a retest on 0.8303. But we'd expect strong support from 0.8116 cluster support (50% retracement of 0.6935 to 0.9304 at 0.8120) to contain downside.
Pound Trading On A Weaker Footing This Morning
For the 24 hours to 23:00 GMT, the GBP rose 0.17% against the USD and closed at 1.3215 on Friday.
In the Asian session, at GMT0400, the pair is trading at 1.3200, with the GBP trading 0.11% lower against the USD from Friday’s close.
The pair is expected to find support at 1.3160, and a fall through could take it to the next support level of 1.3120. The pair is expected to find its first resistance at 1.3250, and a rise through could take it to the next resistance level of 1.3300.
In the absence of any major macroeconomic releases in the UK today, investor sentiment would be determined by global macroeconomic factors.
The currency pair is trading below its 20 Hr moving average and showing convergence with its 50 Hr moving average.
