Sample Category Title
Politics, Politics And Politics
Euro falls on German coalition distress
The markets are busy digesting headlines from German Press that the German Free Democratic Party is said to be breaking off coalition talks with Merkel. Chancellor Angela Merkel has been trying to model a coalition between her Christian Democratic Union (CDU), the Christian Social Union (CSU), the pro-business FDP and the Green party following federal elections at the end of September.
It's undoubtedly a blow for Merkel but highlights the vast difference of interparty opinions surrounding migration and energy policies.The announcement spooked high strung currency traders who are already on edge from the abundance of political headline noise in the US.
Euro toppled some 50 pips before finding traction while the USDJPY showed tentative signs of getting into the swing of things as dealers contemplate hedging against a possible EU equity market wobble.
Keep in mind; liquidity is exceptionally thin and could exaggerate moves. But this knee-jerk reaction does look a bit overdone as Merkle can still establish a minority government with either the FDP or Green Party.
Given traders have been positioning long EURO for a shift in ECB policy on the back of robust EU data, the EURO has remained well supported on the dip so far.
The Broader Market Narrative
While the market remains focused on US tax reform, news that that special prosecutor Mueller had subpoenaed documents from more than a dozen Trump campaign officials several weeks ago didn't go unnoticed. So given the market's preoccupation with political headlines traders virtually ignored the robust US economic data.
In a market starved for direction with traders continually falling prey to price action bringing a high level of bewilderment to most trading desks. Amid limited Thanksgiving week liquidity conditions, and zero chance of any additional Tax Reform transparency from the Senate ahead of the holiday, the market will continue to roil on political uncertainty.
The US dollar is trading with a negative bias against the euro, sterling, and yen, but is firmer against the Antipodean currencies. And with little news expected on the Tax reform front early in the week, this current muddled USD trend should continue. However, the markets will remain prone to positioning driven RISK eruptions in price action even more so given what is little more than holiday thinned-trading conditions in early APAC trade.
For the market puritans, the yield curve is the primary focus which continues to flatten as trader buy long and sell short-dated yields speculating that the that the Federal Reserve would raise rates more aggressively Even with absentee inflation, investors are buying into the Full employment strong US economy narrative will ultimately force the Feds hand.
The Australian Dollar
AUD remains one of the weakest links in G-10 and conviction continues to fall by the week. Very tepid economic data last week highlighted by a miss on wage growth expectation.Weak data on the back of an overtly dovish RBA policy statement is just too hard to ignore Traders do not tend to be particularly good at bottom fishing nor have any suggestions for safely catching a falling knife
While the market focus shifts to this week's speech by RBA Governor Lowe and RBA Minutes, I suspect dealers will continue to look for opportunities to sell as the markets subtly shift back into RBA rate cut mode again.
The Japanese Yen
USDJPY Remains caught between a favourable medium-term outlook and a market looking to sell on anything resembling a risk-off move. Again liquidity is paper thin this week so tread lightly.
EUR/USD Weekly Outlook
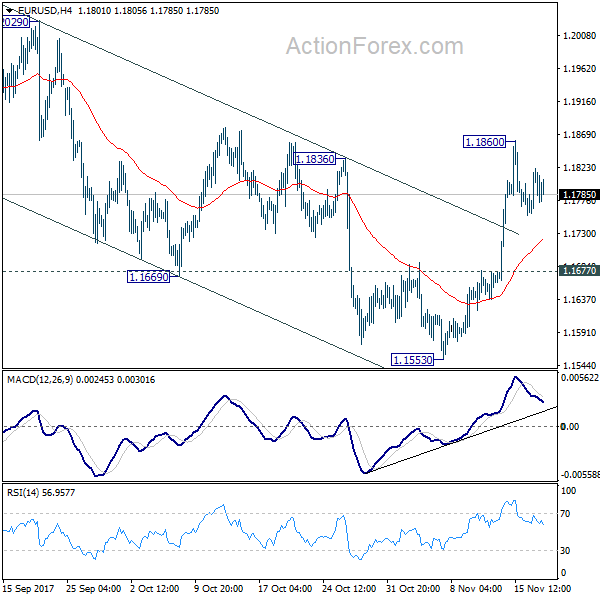
EUR/USD's strong rally last week suggests that corrective fall from 1.2091 has completed at 1.1553 already, ahead of 38.2% retracement of 1.0569 to 1.2091 at 1.1510. With a temporary top formed at 1.1860, initial bias is neutral this week first. Downside of retreat should be contained above 1.1677 minor support to bring another rally. Break of 1.1860 will turn bias to the upside for retesting 1.2091 high. However, break of 1.1677 will turn focus back to 1.1553 low instead.
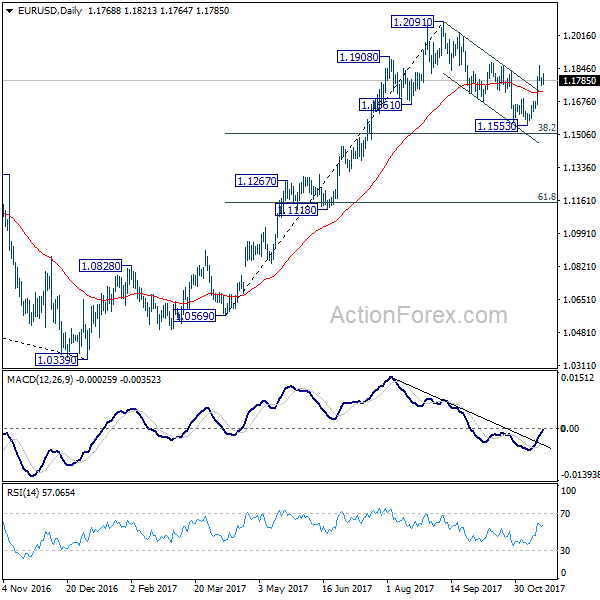
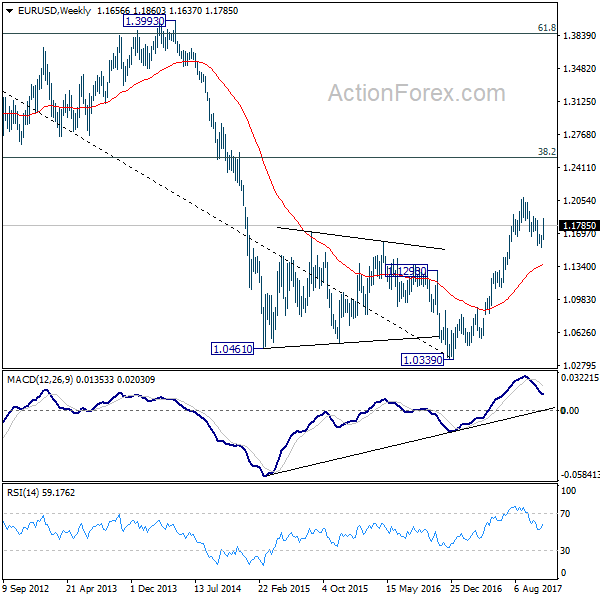
In the bigger picture, rise from 1.0339 medium term bottom is seen as a corrective move for the moment. Therefore, in case of another rally, we'd be cautious on 38.2% retracement of 1.6039 (2008 high) to 1.0339 (2017 low) at 1.2516 to limit upside and bring reversal. Meanwhile, sustained trading below 55 week EMA (now at 1.1373) will suggest that such medium term rebound is completed and could then bring retest of 1.0339 low.
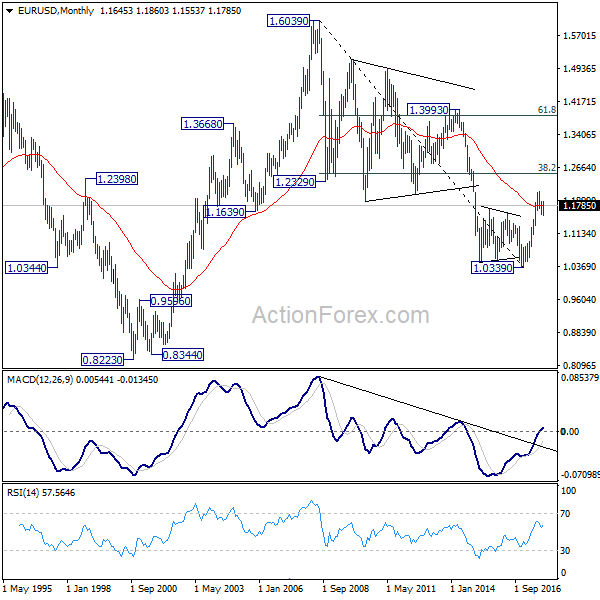
In the long term picture, 1.0339 is now seen as an important bottom as the down trend from 1.6039 (2008 high) could have completed. It's still early to decide whether price action form 1.0339 is developing into a corrective or impulsive move. On the upside, strong resistance could be seen from 38.2% retracement of 1.6039 to 1.0339 at 1.2516. On the downside, we're not anticipating a break of 1.0339 in near to medium term.
USD/JPY Weekly Outlook
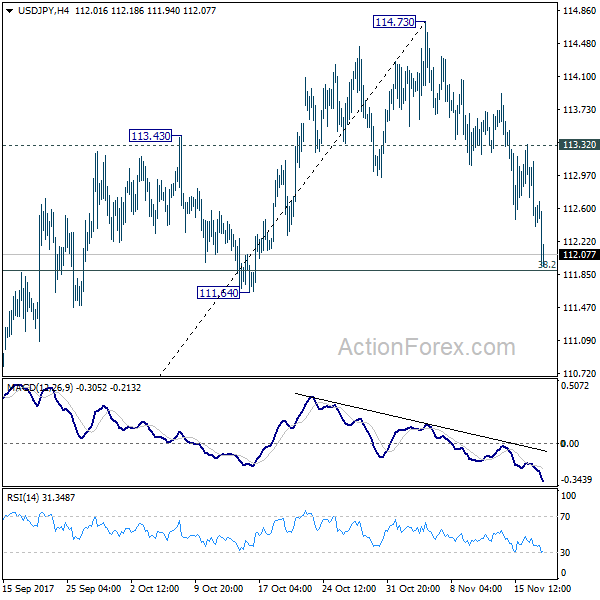
USD/JPY's steep fall last week indicates rejection from 114.49 resistance. Initial bas stays on the downside this week with focus on 111.64 support. Decisive break there will argue that whole rebound from 107.31 has completed. In that case, deeper fall would be seen to 61.8% retracement of 107.31 to 114.73 at 101.14 and below. On the upside, though, break of 113.32 minor resistance will indicate that the pull back is completed and turn bias back to the upside.
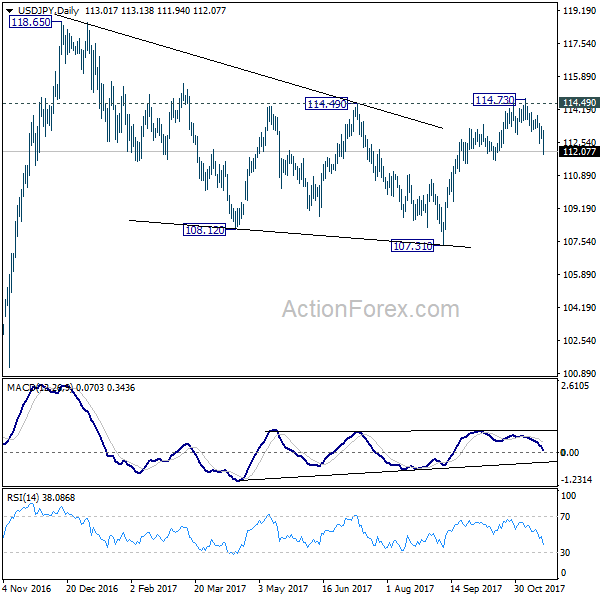
In the bigger picture, medium term rise from 98.97 (2016 low) is not completed yet. It should resume after corrective fall from 118.65 completes. Break of 114.49 resistance will likely resume the rise to 61.8% projection of 98.97 to 118.65 from 107.31 at 119.47 first. Firm break there will pave the way to 100% projection at 126.99. This will be the key level to decide whether long term up trend is resuming. However, firm break of 111.64 support will dampen this view and turn focus back to 107.31 instead.
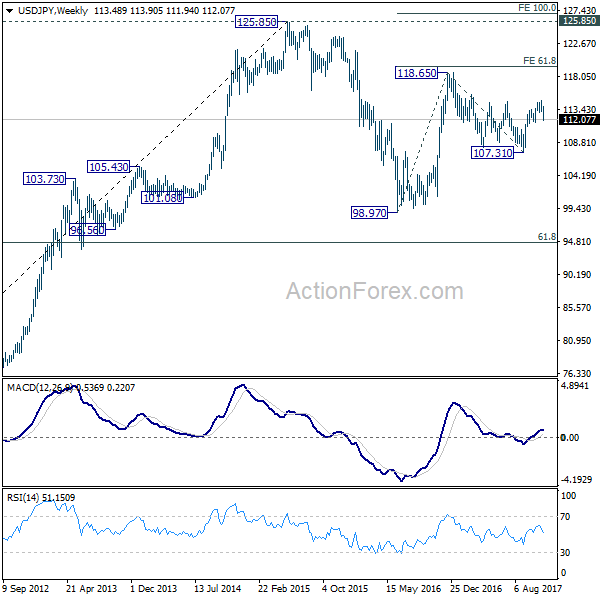
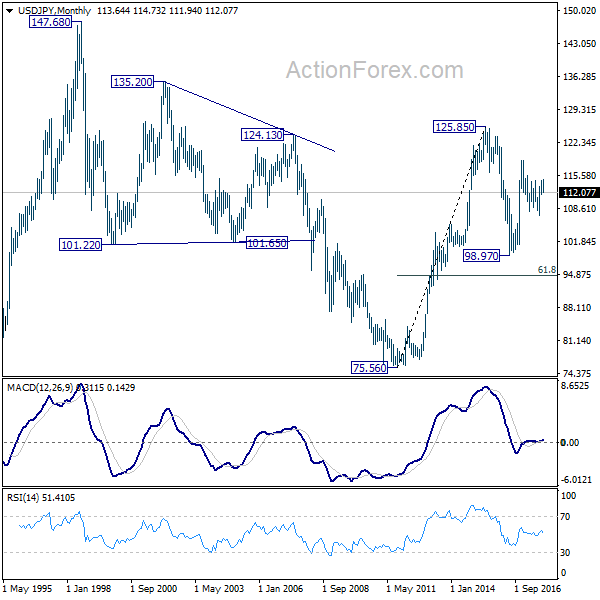
In the long term picture, the rise from 75.56 (2011 low) long term bottom to 125.85 top is viewed as an impulsive move, no change in this view. Price actions from 125.85 are seen as a corrective move which could still extend. In case of deeper fall, downside should be contained by 61.8% retracement of 75.56 to 125.85 at 94.77. Up trend from 75.56 is expected to resume at a later stage for above 135.20/147.68 resistance zone.
GBP/USD Weekly Outlook
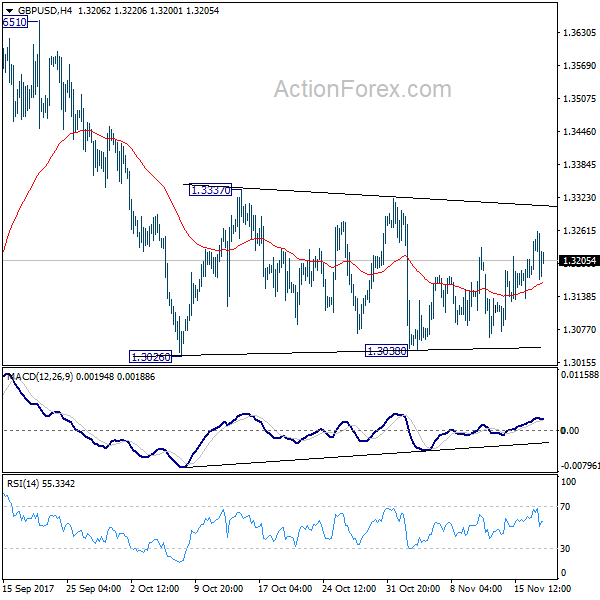
GBP/USD remained bounded in range of 1.3026/3337 last week and outlook is unchanged. Initial bias remains neutral this week. Upside of recovery should be limited below 1.3337 resistance to bring fall resumption. Break of 1.3038 will now resume decline from 1.3651 to 1.2773 key support level. However, decisive break of 1.3337 will indicate that pull back from 1.3651 is completed and medium term rise from 1.1946 is resuming.
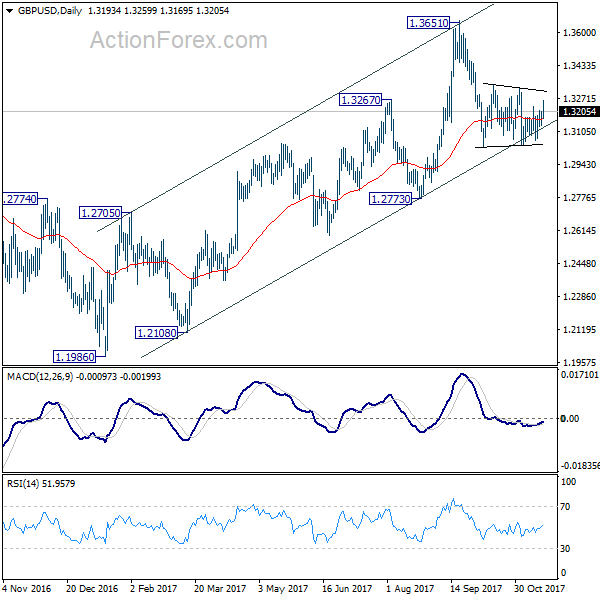
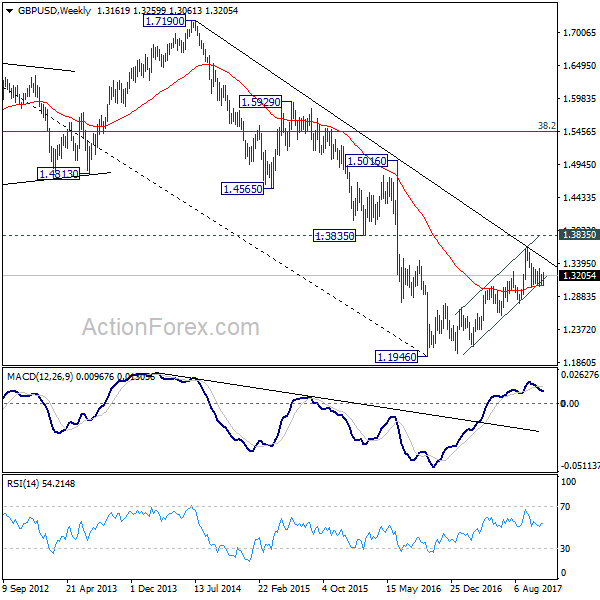
In the bigger picture, as noted before, GBP/USD hit strong resistance from the long term falling trend line. Current development is starting to favor that corrective rebound from 1.1946 low has completed at 1.3651. Decisive break of 1.2773 will confirm this bearish case and target a test on 1.1946 low next, with prospect of resuming the low term down trend. Nonetheless, break of 1.3320 resistance will restore the rise from 1.1946 for 38.2% retracement of 2.1161 (2007 high) to 1.1946 (2016 low) at 1.5466.
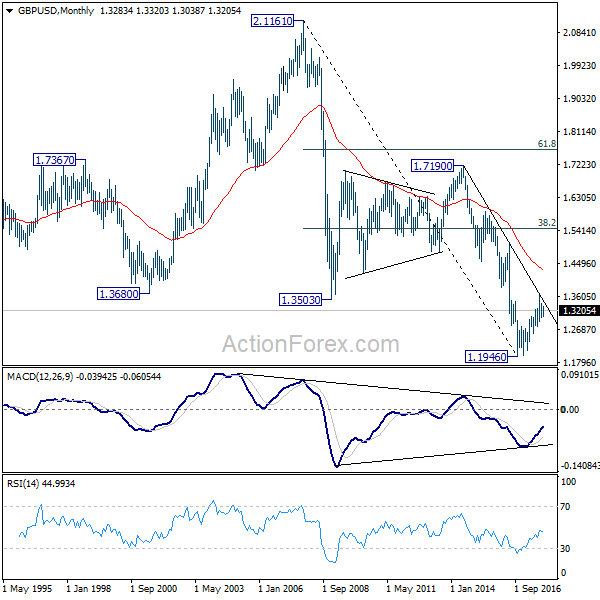
In the longer term picture, long the outlook is turned a bit mixed as GBP/USD failed to break through falling tend line resistance. We'll stay neutral first and assess the outlook again and price actions unfold.
USD/CHF Weekly Outlook
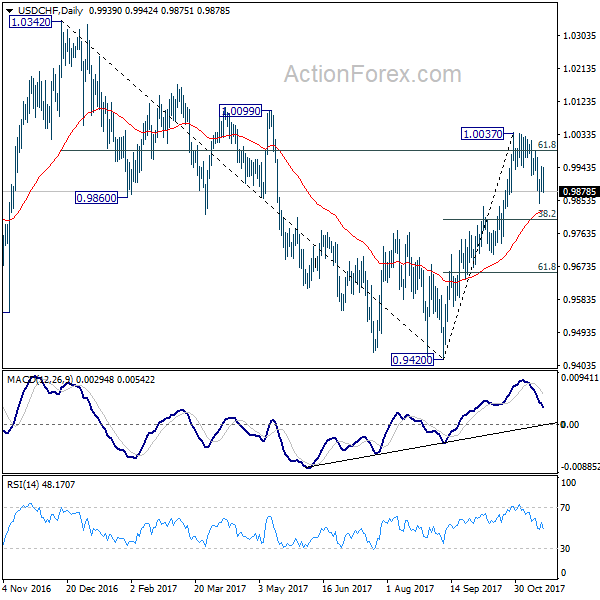
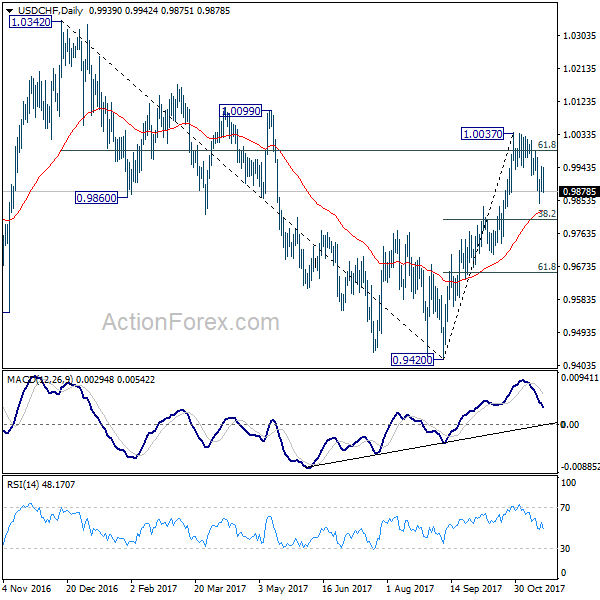
USD/CHF's choppy correction from 1.0037 extended lower last week but it is held above 0.9835 resistance turned support so far. Initial bias remains neutral this week first. On the upside, firm break of 1.0037 resistance will extend the rise from 0.9420 and target 1.0342 high. However, sustained break of 0.9835 will argue that whole rebound form 0.9420 is completed and turn outlook bearish. In that case, USD/CHF should target 61.8% retracement of 0.9420 to 1.0037 at 0.9565 and possibly below.
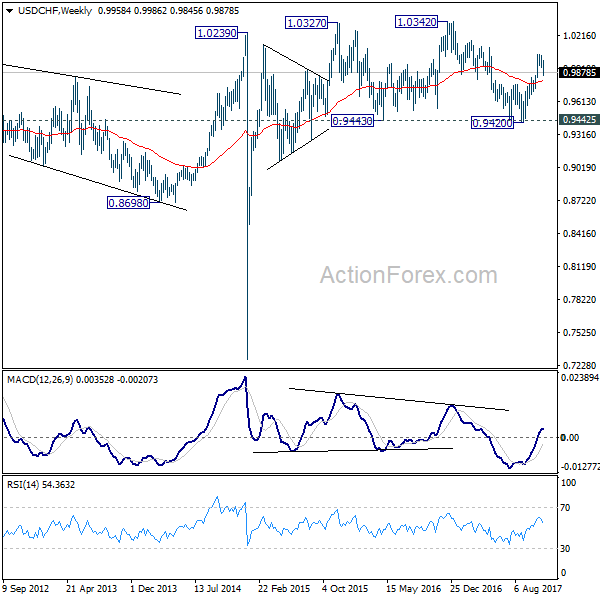
In the bigger picture, current development suggests that USD/CHF has defended 0.9443 (2016 low) key support level again. Rise from 0.9420 could be a medium term up move and should target a test on 1.0342 high. This represents the upper end of a long term range that started back in 2015. On the downside, break of 0.9736 support is now needed to indicate completion of the rise from 0.9420. Otherwise, further rally will remain in favor in medium term.
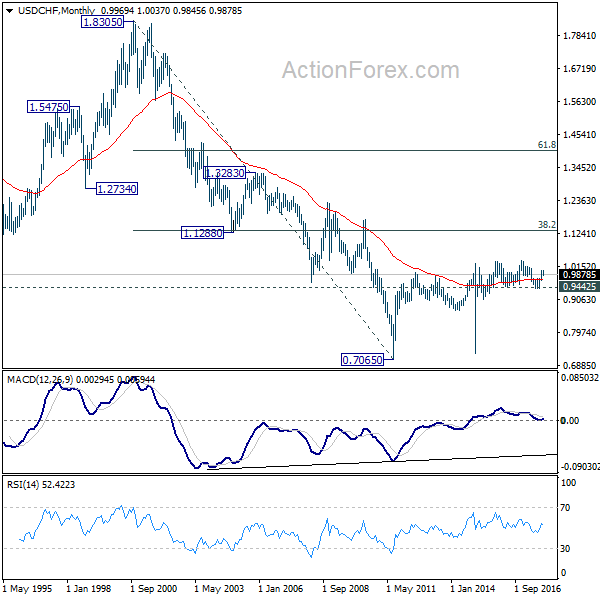
In the long term picture, while upside momentum is unconvincing, with 0.9443 key support intact, rise from 0.7065 (2011 low) is still expected to continue. Break of 1.0342 will target 38.2% retracement of 1.8305 (2000 high) to 0.7065 at 1.1359.
AUD/USD Weekly Outlook
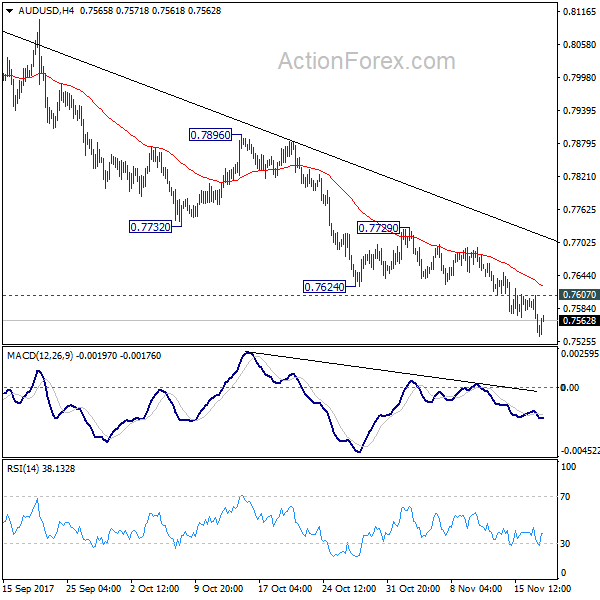
AUD/USD's fall from 0.8124 resumed last week and reached as low as 0.7535 so far. Initial bias stays on the downside this week. Current fall is expected to target next key cluster level at 0.7322/8. On the upside, above 0.7607 minor resistance will turn intraday bias neutral. But outlook will stay bearish as long as 0.7729 resistance holds.
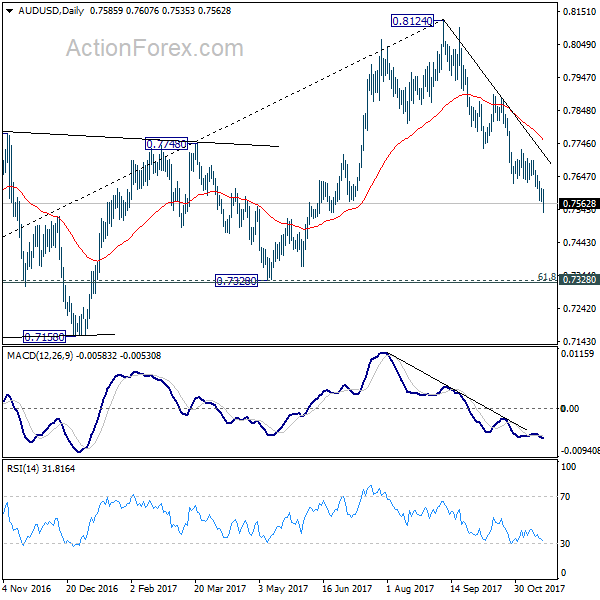
In the bigger picture, corrective rise from 0.6826 medium term bottom is likely completed at 0.8124, after hitting 55 month EMA (now at 0.8049). Decisive break of 0.7328 key cluster support (61.8% retracement 0.6826 to 0.8124 at 0.7322) will confirm. And in that case, long term down trend from 1.1079 (2011 high) will likely be resuming. Break of 0.6826 will target 61.8% projection of 1.1079 to 0.6826 from 0.8124 at 0.5496. This will now be the favored case as long as 0.7729 near term resistance holds.
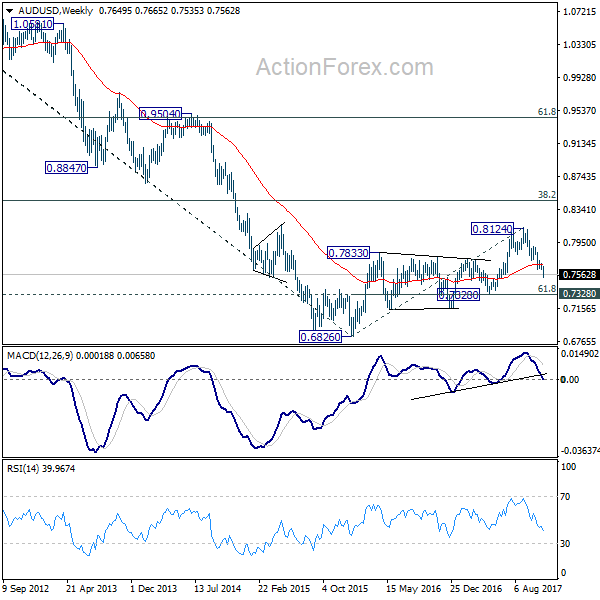
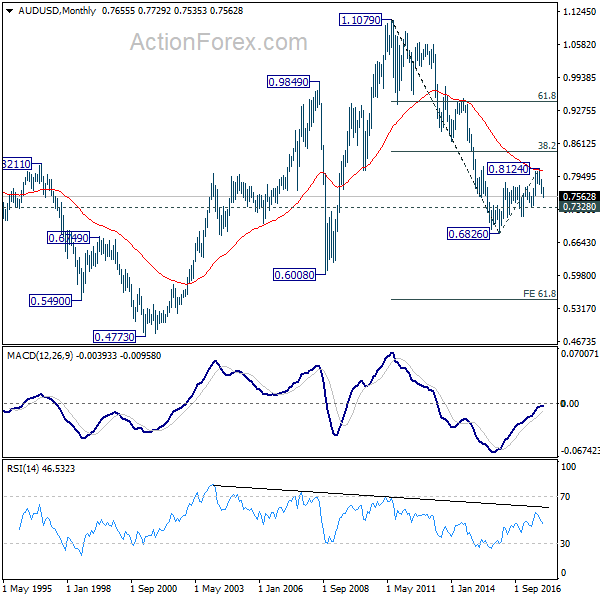
In the longer term picture, 0.6826 is seen as a long term bottom. Rise from there could either reverse the down trend from 1.1079, or just develop into a corrective pattern. At this point, we're favoring the latter. And, as long as 38.2% retracement of 1.1079 to 0.6826 at 0.8451 holds, we'd anticipate another decline through 0.6826 at a later stage. But strong support should be seen between 0.4773 (2001 low) and 0.6008 (2008 low).
USD/CAD Weekly Outlook
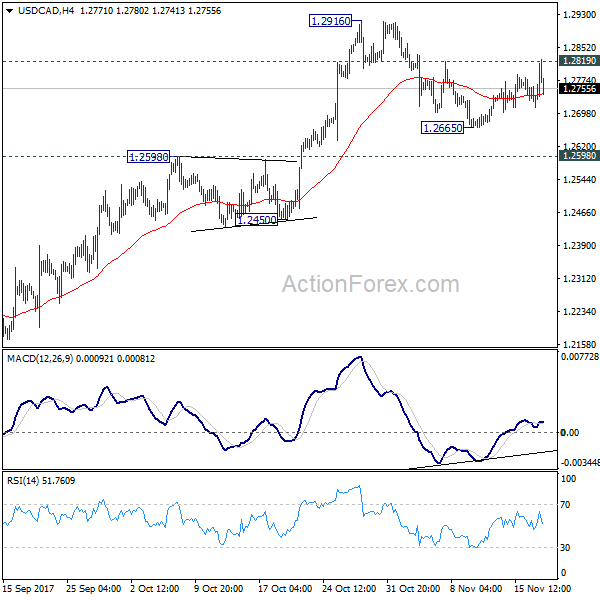
USD/CAD recovered last week but failed to sustain above 1.2819 so far. Initial bias remains neutral this week first. Price actions from 1.2916 are seen as a corrective pattern. In case of another fall, we'd expect downside to be contained by 1.2598 resistance turned support and bring rebound. Above 1.2819 will turn bias to the upside for 1.2916 first. Break there will resume whole rally from 1.2061 to 38.2% retracement of 1.4689 to 1.2061 at 1.3065. However, sustained break of 1.2598 will argue that rebound from 1.2061 has completed after hitting 55 week EMA (now at 1.2916). Near term outlook will be turned bearish in this case.
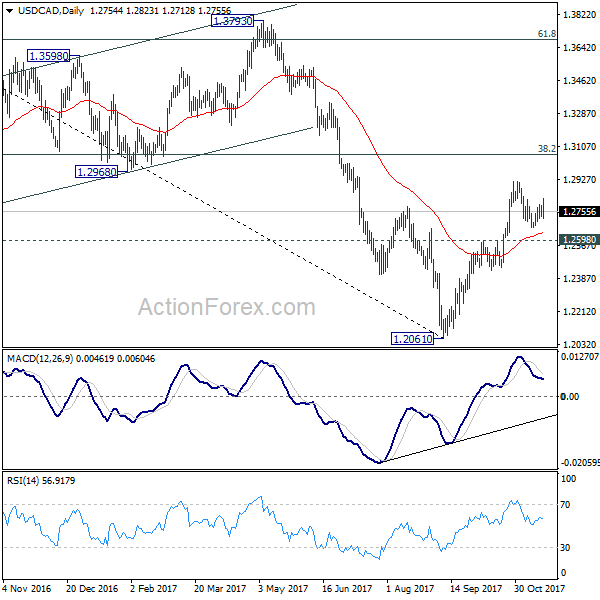
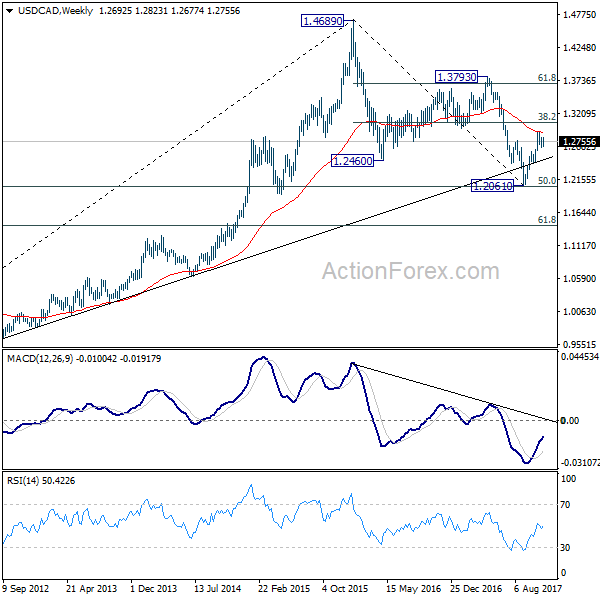
In the bigger picture, USD/CAD should have defended 50% retracement of 0.9406 (2011 low) to 1.4689 (2016 high) at 1.2048. And with 1.2048 intact, we'd favor the case that fall from 1.4689 is a correction. Rise from 1.2061 medium term bottom should now target 38.2% retracement of 1.4689 to 1.2061 at 1.3065. Firm break there will target 1.3793 key resistance next (61.8% retracement at 1.3685). We'll now hold on to this bullish view as long as 1.2450 support holds.
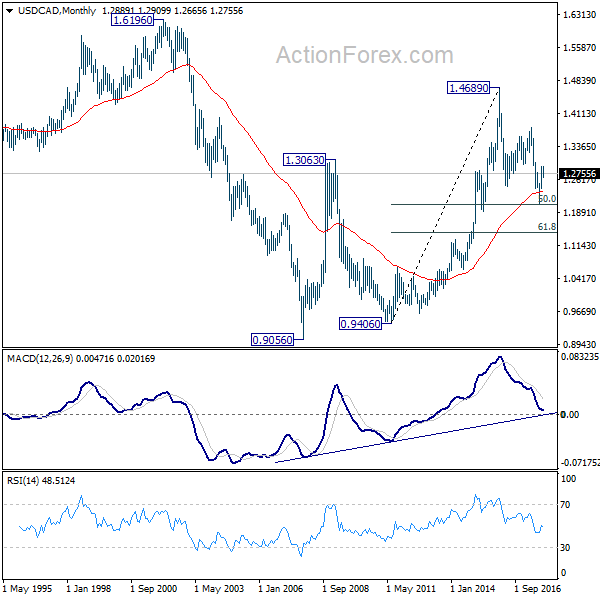
In the longer term picture, current development argues that correction from 1.4689 has completed with three waves down to 1.2061 already. And larger up trend from 0.9056 (2007 low) is still in progress. Firm break of 1.3794 resistance should now indicate up trend resumption through 1.4689 high.
GBP/JPY Weekly Outlook
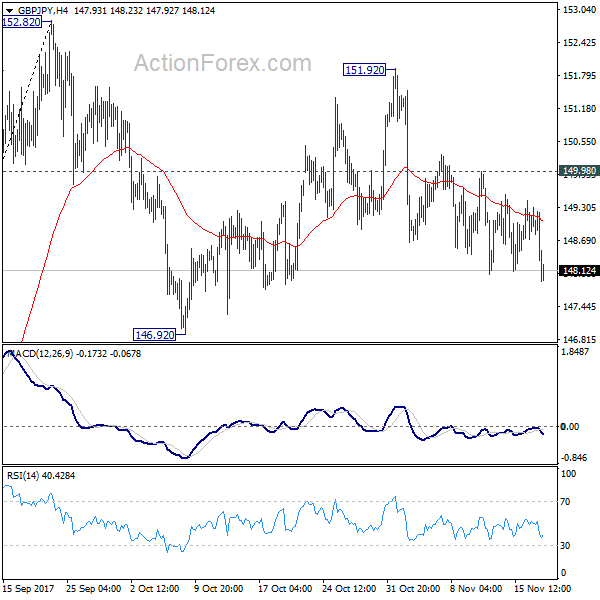
GBP/JPY gyrated lower last week with very weak momentum. Overall near term outlook is unchanged though. That is, price actions from 152.82 are developing to a corrective pattern. Deeper fall is expected this week for 146.92 support and below. We'd expect strong support from 61.8% retracement of 139.29 to 152.82 at 144.45 to contain downside and bring rebound. On the upside, break of 149.98 resistance will turn bias back to the upside for 151.92/152.82 resistance zone instead.
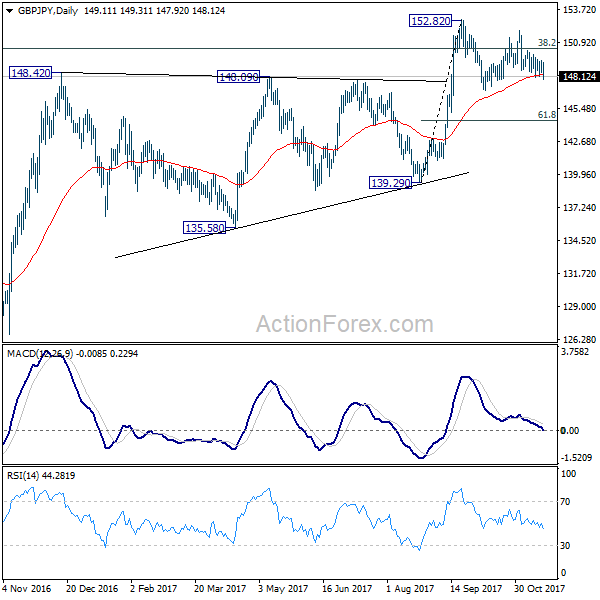
In the bigger picture, medium term rebound from 122.36 is still expected to resume after corrective pull back from 152.82 completes. Firm break of 38.2% retracement of 196.85 to 122.36 at 150.43 will carry long term bullish implications. In that case, GBP/JPY could target 61.8% retracement at 167.78. However, break of 139.29 will indicate rejection from 150.43 key fibonacci level. And the three wave corrective structure of rebound from 122.36 will argue that larger down trend is resuming for a new low below 122.26.
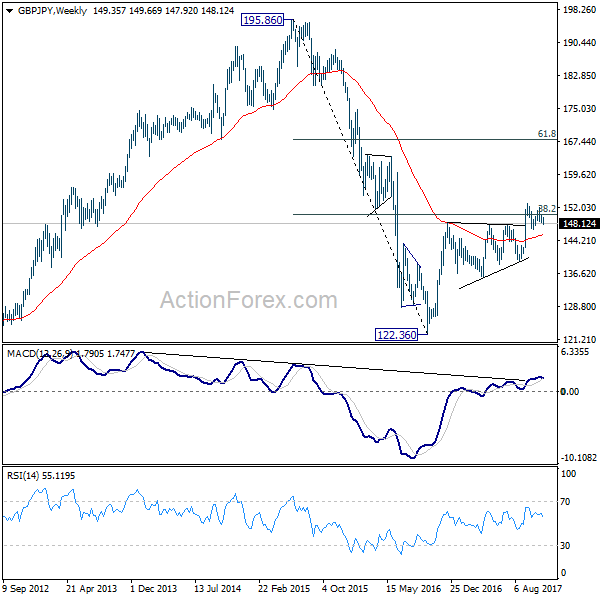
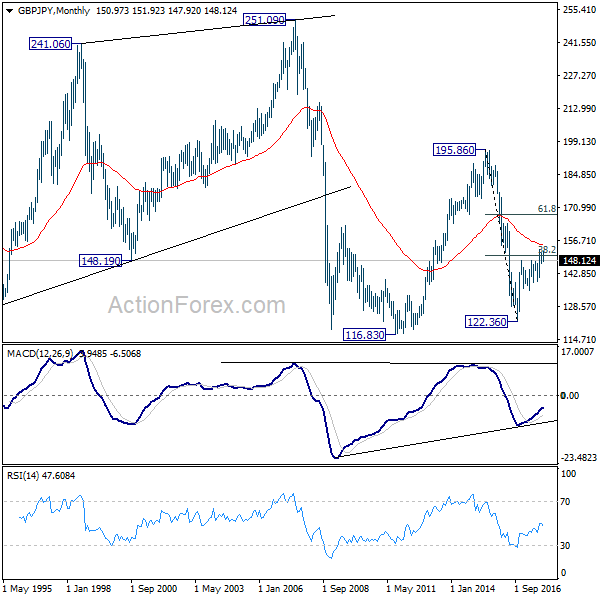
In the longer term picture, current rebound argues that the down trend from 195.86 (2015 high) has already completed at 122.36. Focus is now on 55 month EMA (now at 154.78). Firm break there will suggest that rise form 122.36 is developing into a long term move that target 195.86 again. And, price actions from 116.83 (2011 low) is indeed a sideway pattern that could last more than a decade. However, firm break of 139.29 will suggests that the long term down trend is still in progress and could break 116.83 low ahead.
EUR/JPY Weekly Outlook
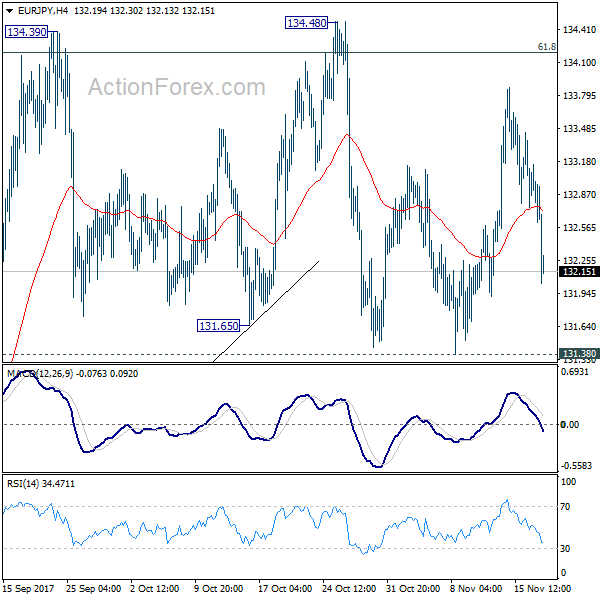
EUR/JPY stayed in sideway trading last week and outlook is unchanged. Initial bias remains neutral this week first. On the upside, decisive break of 134.39/48 resistance zone will confirm medium term up trend resumption. In that case, 141.04 resistance will be the next target. On the downside, though, decisive break of 131.38 support will confirm rejection from 134.20 fibonacci level and confirm near term reversal. And, in such case, intraday bias will be turned to the downside for 127.55 key support level.
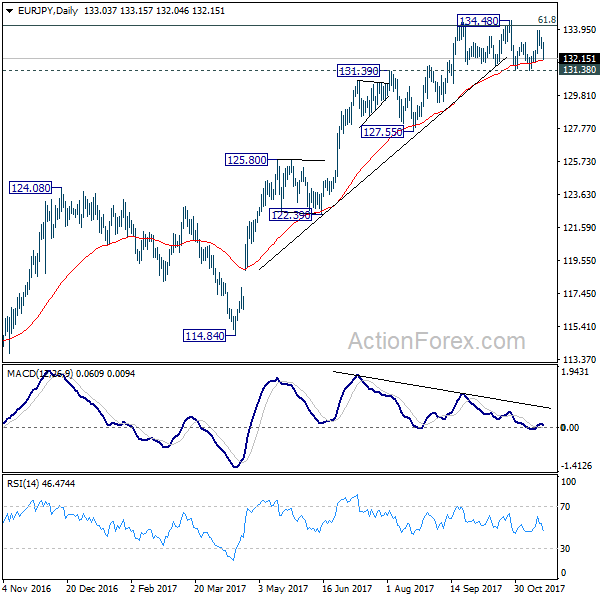
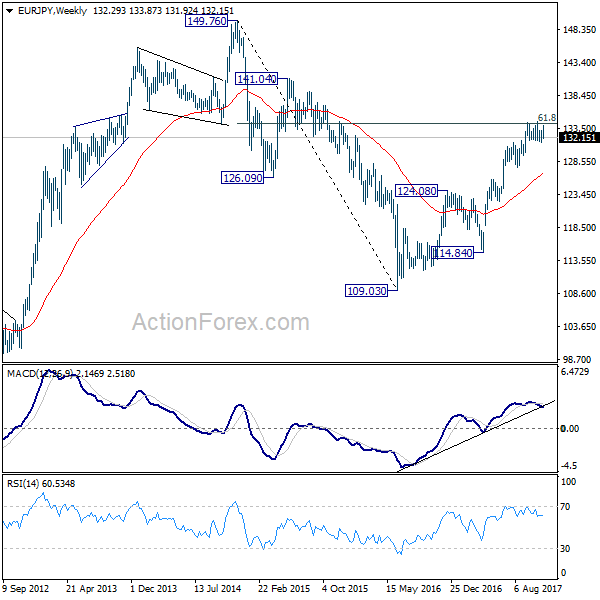
In the bigger picture, medium term rise from 109.03 (2016 low) is seen as at the same degree as the down trend from 149.76 (2014 high) to 109.03 (2016 low). 61.8% retracement of 149.76 to 109.03 at 134.20 is already met. Sustained break there will pave the way to key long term resistance zone at 141.04/149.76. However, break of 127.55 support will argue that the medium term trend has reversed and will turn outlook bearish for deeper fall back to 114.84/124.08 support zone at least.
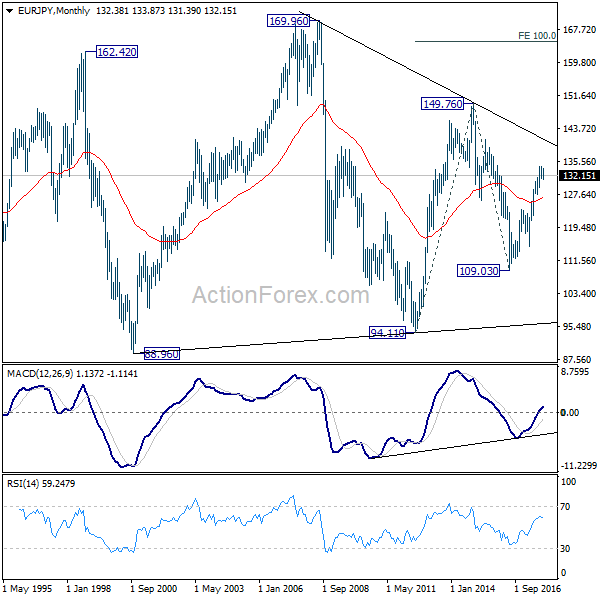
In the long term picture, at this point, there is no clear indication that rise from 109.03 is resuming that from 94.11. Hence, we'd be cautious on topping below 149.76 to extend range trading. Nonetheless, firm break of 149.76 will indicates strong underlying buying. In such case, EUR/JPY will target 100% projection of 94.11 to 149.76 from 109.03 at 164.68.
EUR/GBP Weekly Outlook
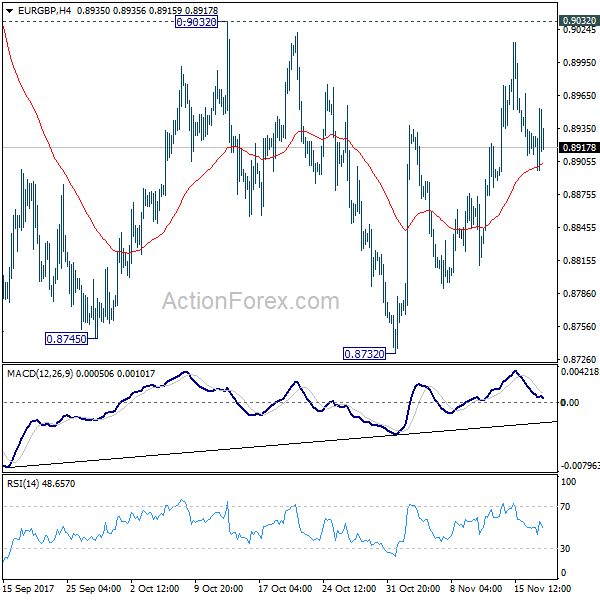
EUR/GBP rebounded last week but failed to break through 0.9032 resistance. Initial bias remains neutral this week. With 0.9032 resistance intact, deeper decline is mildly in favor in the cross. Break of 0.8732 will resume the fall from 0.9305 and target 0.8303 key support level. However, on the upside, decisive break of 0.9032 will confirm completion of the decline from 0.9305. In such case, intraday bias will be turned back to the upside for retesting 0.9305 key resistance.
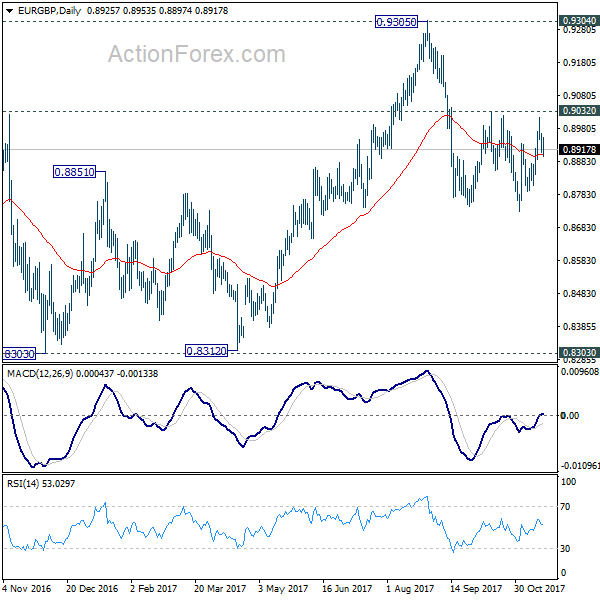
In the bigger picture, there are various ways to interpret price actions from 0.9304 high. But after all, firm break of 0.9304/5 is needed to confirm up trend resumption. Otherwise, range trading will continue with risk of deeper fall. And in that case, EUR/GBP could have a retest on 0.8303. But we'd expect strong support from 0.8116 cluster support (50% retracement of 0.6935 to 0.9304 at 0.8120) to contain downside.
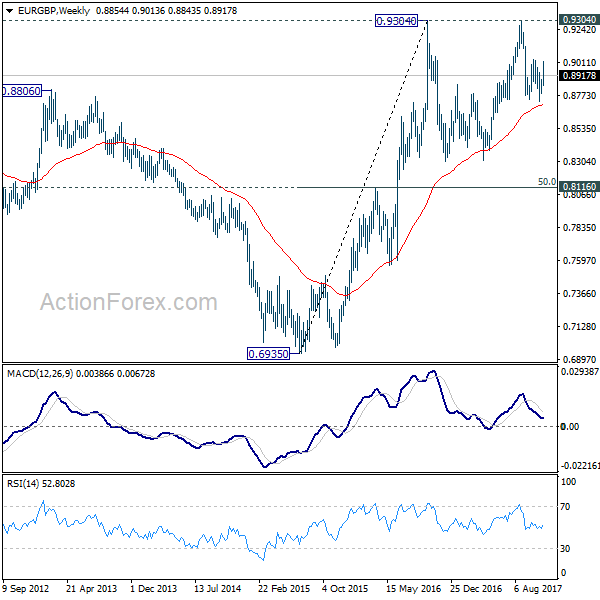
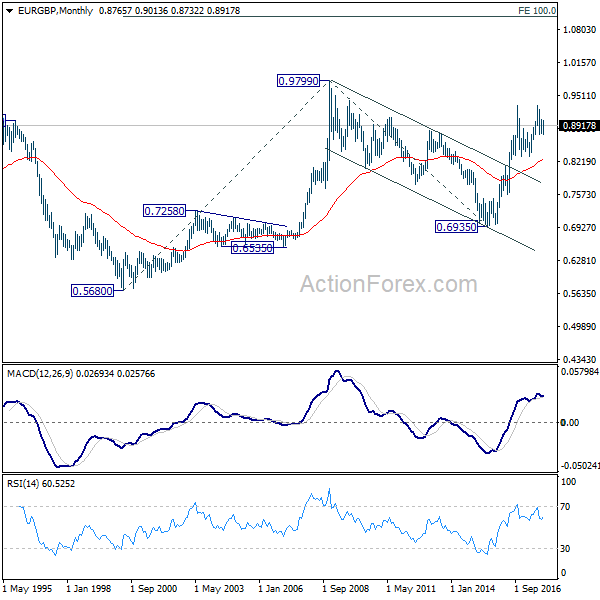
In the long term picture, firstly, price action from 0.9799 (2008 high) is seen as a long term corrective pattern and should have completed at 0.6935 (2015 low). Secondly, rise from 0.6935 is likely resuming up trend from 0.5680 (2000 low). Thirdly, this is supported by the impulsive structure of the rise from 0.6935 to 0.9304. Hence, after the correction from 0.9304 completes, we'd expect another medium term up trend through 0.9799 to 100% projection of 0.5680 to 0.9799 from 0.6935 at 1.1054.