Sample Category Title
USDCAD – Loonies Falls after Canada CPI Data Disappointed Traders on Release along with Forecast
The pair surged above 1.2800 barrier and hit new over one-week high at 1.2815 on Friday after Canada's Oct inflation numbers came along with expectations (0.1% vs 0.1 f/c; Core 0.3% vs 0.3% f/c) disappointing many traders who expected higher figures.
Fresh bullish acceleration eventually broke above rising 20SMA (1.2763) after hovering around it in past few sessions and probed through psychological 1.2800 barrier, which limited upside attempts on Wed/Thu.
Rally approached next pivot at 1.2819 (Fibo 61.8% of 1.2914/1.2665 pullback) and close above here would generate bullish signal for fresh upside and possible full retracement of 1.2914/1.2655 corrective phase.
Fresh acceleration higher brings daily techs back into full bullish setup, however, bulls may consolidate before resuming higher as slow stochastic is entering overbought territory. Broken 20SMA is expected to keep the downside protected.
Res: 1.2819; 1.2835; 1.2855; 1.2914
Sup: 1.2789; 1.2763; 1.2734; 1.2713
Trade Idea Wrap-up: GBP/USD – Hold long entered at 1.3180
GBP/USD - 1.3192
Most recent candlesticks pattern : N/A
Trend : Near term up
Tenkan-Sen level : 1.3215
Kijun-Sen level : 1.3215
Ichimoku cloud top : 1.3168
Ichimoku cloud bottom : 1.3145
Original strategy :
Bought at 1.3180, Target: 1.3280, Stop: 1.3145
Position : - Long at 1.3180
Target : - 1.3280
Stop : - 1.3145
New strategy :
Hold long entered at 1.3180, Target: 1.3280, Stop: 1.3145
Position : - Long at 1.3180
Target : - 1.3280
Stop : - 1.3145
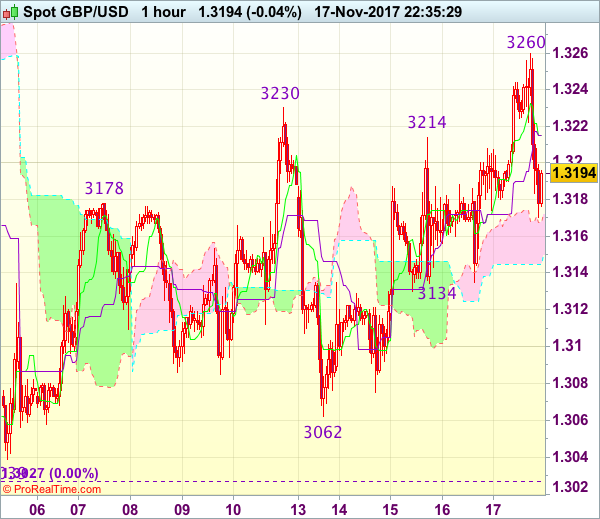
As the British pound has retreated after rising 1.3260, suggesting consolidation below this level would be seen, however, reckon 1.3150-60 would contain downside and bring another rise later, above said resistance at 1.3260 would add credence to our view that the erratic rise from 1.3039 is still in progress for headway to 1.3280-90, however, as broad outlook remains consolidative, reckon upside would be limited and another previous resistance at 1.3321 should remain intact, bring retreat later.
In view of this, we are holding on to our long position entered at 1.3180. Below 1.3170-75 would risk correction to 1.3150 but only break of said support at 1.3134 would abort and signal top is formed instead, bring weakness to 1.3100, then towards support at 1.3062.
Trade Idea Wrap-up: EUR/USD – Hold long entered at 1.1790
EUR/USD - 1.1799
Most recent candlesticks pattern : N/A
Trend : Near term up
Tenkan-Sen level : 1.1795
Kijun-Sen level : 1.1791
Ichimoku cloud top : 1.1794
Ichimoku cloud bottom : 1.1782
Original strategy :
Bought at 1.1790, Target: 1.1890, Stop: 1.1755
Position : - Long at 1.1790
Target : - 1.1890
Stop : - 1.1755
New strategy :
Hold long entered at 1.1790, Target: 1.1890, Stop: 1.1755
Position : - Long at 1.1790
Target : - 1.1890
Stop : - 1.1755
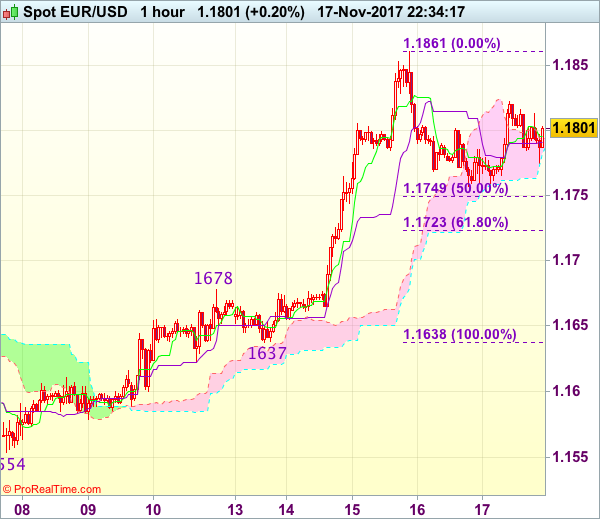
As the single currency has rebounded after continued finding support just above yesterday’s low at 1.1757, suggesting the pullback from 1.1861 (this week’s high) has ended there and consolidation with upside bias is seen for a retest of this level, however, break there is needed to confirm recent upmove from 1.1554 low has resumed and extend gain to previous resistance at 1.1880, then 1.1900-10.
In view of this, we are holding on to our long position entered 1.1790. Only below said support at 1.1757 would abort and signal a temporary top has been formed, bring retracement of recent rise to 1.1720-25 (61.8% Fibonacci retracement of 1.1638-1.1861) but reckon 1.1700 would limit downside and previous resistance at 1.1678 (now support) should remain intact.
Nothing to Get Excited about in Canada’s October Inflation Numbers
Highlights:
- The year-over-year increase in all items CPI slipped back to 1.4% in October after rising to 1.6% in September.
- Energy prices were responsible for the slowing as gasoline prices retraced much of the previous month's hurricane-related increase.
- Year-over-year inflation excluding food and energy rose to 1.4% from a three-year low of 1.2% in September.
- The average of the Bank of Canada's three preferred core measures was unchanged at 1.6% in October. Those measures have trended gradually higher from a multi-year low of 1.3% in May.
Our Take:
Today's inflation numbers were as expected - stable core inflation and an energy-related dip in the headline reading. It remains the case that underlying inflation is stuck below 2% despite the Canadian economy's strong performance over the last year and no shortage of consumer demand. The Bank of Canada continues to expect that, with the economy running up against longer-run capacity limits, inflation will return to their 2% target on a sustained basis. But at the same time, they have expressed uncertainty regarding how much room the economy has to run before inflationary pressures pick up. And while their research indicates global factors and technology haven't been weighing significantly on inflation, they aren't fully dismissed those factors. Given these concerns, we think the Bank of Canada will want to see more evidence (and there wasn't much in October) that underlying inflation is returning to target before adding to the two rate increases announced this summer. We think waiting until next April to resume tightening will not only allow the central bank to see how inflation evolves, but also get more information on other sources of uncertainty - particularly progress on Nafta talks and how households respond to higher rates and further regulatory changes in the housing market.
Trade Idea Wrap-up: USD/JPY – Stand aside
USD/JPY - 112.45
Most recent candlesticks pattern : N/A
Trend : Near term down
Tenkan-Sen level : 112.51
Kijun-Sen level : 112.76
Ichimoku cloud top : 113.19
Ichimoku cloud bottom : 113.01
New strategy :
Stand aside
Position : -
Target : -
Stop : -
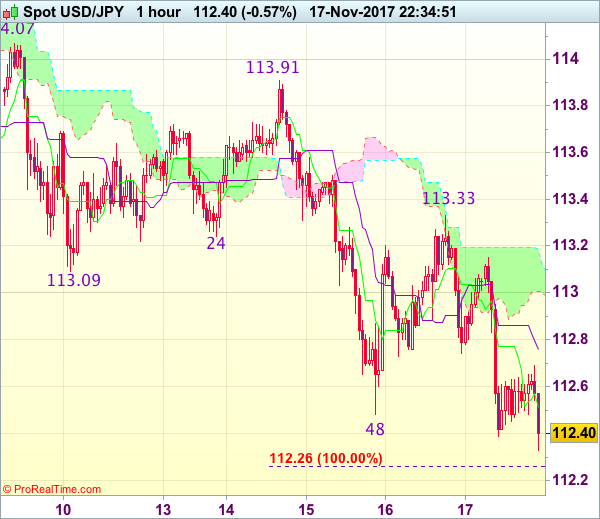
Despite this week’s anticipated rebound to 113.33, as the greenback met renewed selling interest there and has dropped quite sharply today, dampening our near term bullishness and downside risk remains for the fall from 114.74 top to extend weakness to 112.26-30 (100% projection of 114.74-113.09 measuring from 113.91 and previous support) but loss of momentum should prevent sharp fall below 112.00-05, price should stay above 111.70, bring rebound later.
In view of this, would not chase this fall here and would be prudent to stand aside in the meantime. Above the Kijun-Sen (now at 112.86) would bring recovery to 113.00-10 but only break of said resistance at 113.33 would suggest low is formed instead, bring a stronger rebound to 113.60, however, price should falter well below resistance at 113.91.
Trade Idea: USD/CAD – Stand aside
USD/CAD - 1.2807
Trend: Near term up
Original strategy :
Exit short entered at 1.2770
Position: -
Target: -
Stop: -
New strategy :
Stand aside
Position: -
Target: -
Stop:-
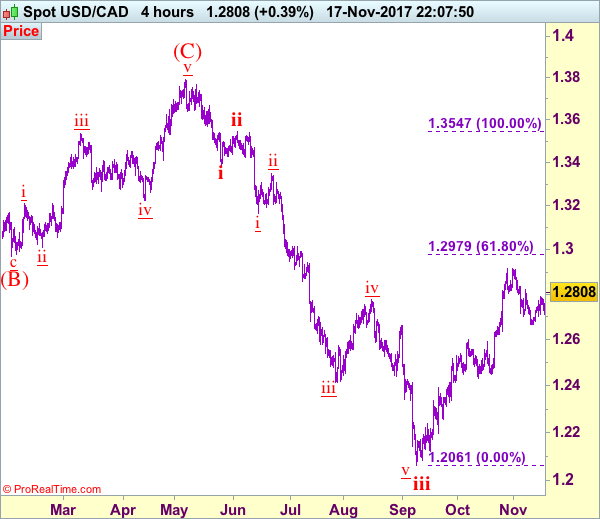
Current rebound suggests near term upside risk remains for gain to 1.2820 and possibly 1.2850-60, however, a firm break above this level is needed to signal the correction from 1.2917 has ended, bring further gain to 1.2880, then towards this level which is likely to hold from here.
In view of this, would not chase this move here and would be prudent to stand aside in the meantime. Below 1.2740 would prolong consolidation, risk weakness to 1.2710-15, only break of 1.2700 would revive bearishness and signal the rebound from 1.2665 has ended, bring another test o this level, break there would extend the fall from 1.2917 top for retracement of recent rise to support at 1.2636 but a drop below this level is needed to signal recent rise has ended at 1.2917, bring further fall to 1.2600 and later towards 1.2550-60.
To recap, wave B from 1.3066 is unfolding as an a-b-c and is sub-divided as a: 1.2192, b: 1.2716 and wave c is a 5-waver with i: 1.1983, ii: 1.2506, extended wave iii with minor iii at 1.0206, wave iv ended at 1.0781 and wave v as well as wave iii has ended at 0.9931, hence the subsequent choppy trading is the wave iv which is unfolding as (a)-(b)-(c) with (a) leg of iv ended at 1.0854, followed by (b) leg at 1.0108 and (c) leg as well as the wave iv ended at 1.0674. The wave v is sub-divided by minor wave (i): 0.9980, (ii): 1.0374, (iii): 0.9446, (iv): 0.9913 and (v) as well as v has possibly ended at 0.9407, therefore, consolidation with upside bias is seen for major correction, indicated target at 1.3700 and 1.4000 had been met and further gain to 1.4700 would be seen later.
Inflation Cools in Canada in October Alongside Prices at the Pumps
Consumer price inflation dropped back to 1.4% year-on-year in October (from 1.6% in September), on par with expectations. Month-on-month seasonally-adjusted prices rose 0.2%.
A deceleration in gasoline prices, following hurricane-related run-ups in September and August, was the main factor softening inflation. Gasoline prices were up 6.5% (y/y) in October, down from the 14.1% advance in September. Excluding gasoline, inflation rose to 1.3% (from 1.1% in September).
Food and beverage prices fell 0.2% month-on-month in October (seasonally adjusted) and decelerated to 1.3% year-on-year (from 1.4%).
Core prices were mixed according to the Bank of Canada's preferred measures. CPI-median ticked down to 1.7% (y/y) from 1.8% previously, while CPI-common ticked up to 1.6%. CPI-trim was unchanged at 1.5%. Excluding food and energy, inflation rose to 1.4% (from 1.2%).
Key Implications
Energy price volatility aside, there isn't much to report on the inflation front. As in the U.S., there appears to be some idiosyncratic factors, such as lower cell phone plans, weighing on overall price growth.
The past run-up in the Canadian dollar through the summer months to a peak of 82 cents U.S. in early September has also contributed to the recent softness. Its reversal in the weeks since means this slowdown should prove fleeting.
Indeed, there is good reason to think inflation will soon turn a corner. Wage growth has accelerated notably in recent months and job growth has been concentrated in full-time positions. Alongside a lower Canadian dollar and more stable energy prices, this should set the stage for inflation to move toward 2% over the next year.
Bitcoin Flexes While Dollar Weakens
I find it remarkable and somewhat frightening how, no matter how much Bitcoin is pummeled by sellers, it simply bounces back even stronger.
The most talked about cryptocurrency marched to a record high above $8000 on Friday, just five days after it sharply tumbled 29%. Bulls are always hungry for an opportunity to make a move, and this was delivered in the form of renewed ambiguity around the SegWit2X fork. With Bitcoin appreciating over 700% year-to-date (YTD), and the cryptocurrency frequently hitting record highs, bulls are clearly in control. The price action is extremely bullish, especially when considering how the $8000 resistance has already been breached. Will Bitcoin hit $10000 before year end? This is the question every investor is asking.
Dollar slips on renewed political jitters
The Dollar sulked into Friday's trading session under pressure following reports that U.S. Special Counsel Robert Mueller had subpoenaed Donald Trump's election campaign for more documents relating to Russia. Investor jitters over the report have clearly overshadowed the passing of yesterday's tax bill through Congress, and this has been reflected in the Dollar's bearish price action. With renewed political uncertainty likely to weigh on the Dollar, further downside may be on the cards. Taking a look at the technical picture, the Dollar Index is turning bearish on the daily charts. A breakdown below 93.50 may encourage a further decline towards 93.00.
Currency spotlight - EURUSD
This has been a positive trading week for the Euro as it found ample support from stronger than expected German and Italian Q3 GDP data.
The EURUSD sprinted towards 1.1850 on the back of rising optimism over the European economy, while a vulnerable Dollar complimented the upside. Although the Euro has roared back to life this week, the technical picture on the daily charts remains somewhat bearish below 1.1850. While prices have breached the 1.1730 level, bulls need to secure a solid weekly close above 1.1850 to pressure the daily bearish setup. Sustained weakness below 1.1850 may encourage a further decline back towards 1.1730 and 1.1680. Alternatively, a breakout above this level should open a path higher towards 1.1920.
Commodity spotlight - Gold
Gold modestly appreciated during Friday's trading session thanks to a depressed US Dollar.
This has been a volatile trading week for the yellow metal as bulls and bears continue to battle for dominance. Prices sharply appreciated to a three-week high at $1289 mid-week, before sliding into losses after positive US economic data fortified expectations of a Fed rate hike in December. While investor caution and geopolitical tensions may support Gold bulls, bears remain inspired by the mounting expectations of higher US interest rates. It is becoming increasingly clear that a catalyst is needed for the next major move. Technical traders will continue to pay attention to how prices react around the pivotal $1280 level. A weekly close above $1280 may encourage a further incline back towards $1289 and $1300, respectively. A failure to stay above$1280 may open a path back towards $1267.
EUR/USD Mid-Day Outlook
Daily Pivots: (S1) 1.1749; (P) 1.1774 (R1) 1.1793; More...
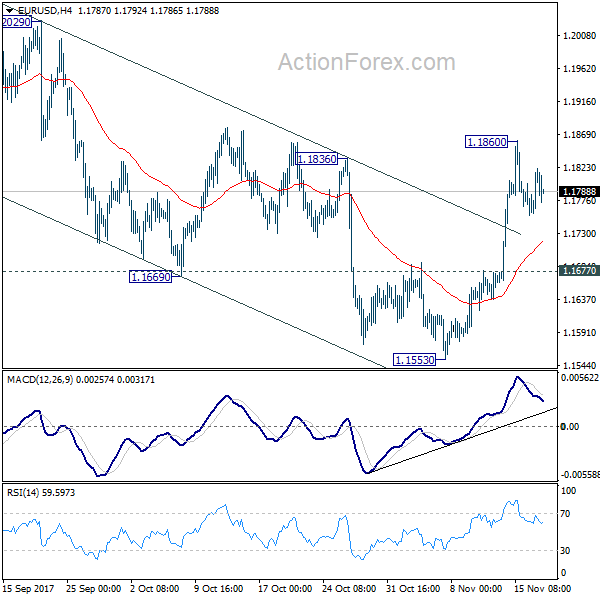
Intraday bias in EUR/USD remains neutral for consolidation below 1.1860 temporary top. Outlook is unchanged that correction from 1.2091 has completed at 1.1553 already. Further rise is expected. Above 1.1860 will target 1.2091 high. However, break of 1.1677 support will turn focus back to 1.1553 low instead.
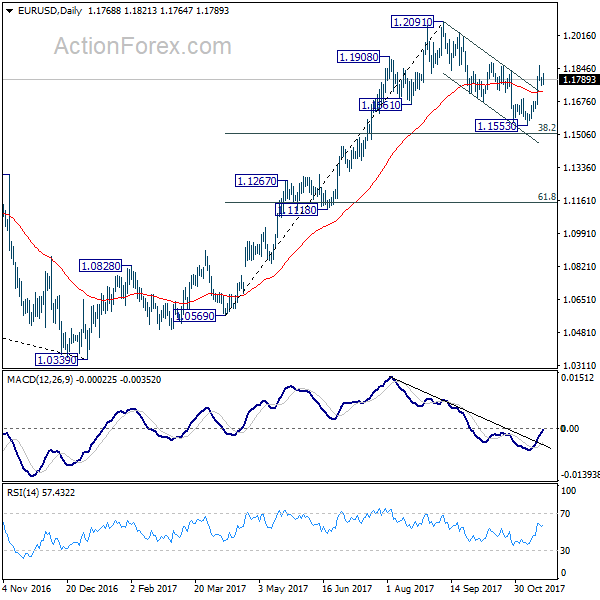
In the bigger picture, rise from 1.0339 medium term bottom is seen as a corrective move for the moment. Therefore, in case of another rally, we'd be cautious on 38.2% retracement of 1.6039 (2008 high) to 1.0339 (2017 low) at 1.2516 to limit upside and bring reversal. Meanwhile, sustained trading below 55 week EMA (now at 1.1346) will suggest that such medium term rebound is completed and could then bring retest of 1.0339 low.
GBP/USD Mid-Day Outlook
Daily Pivots: (S1) 1.3148; (P) 1.3178; (R1) 1.3221; More....
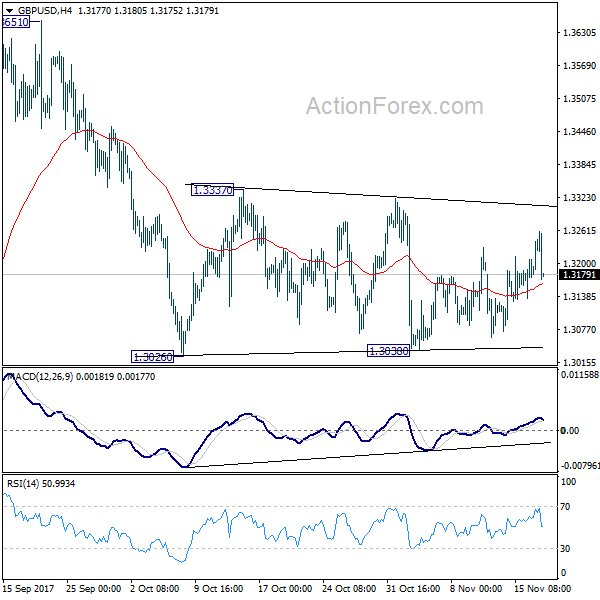
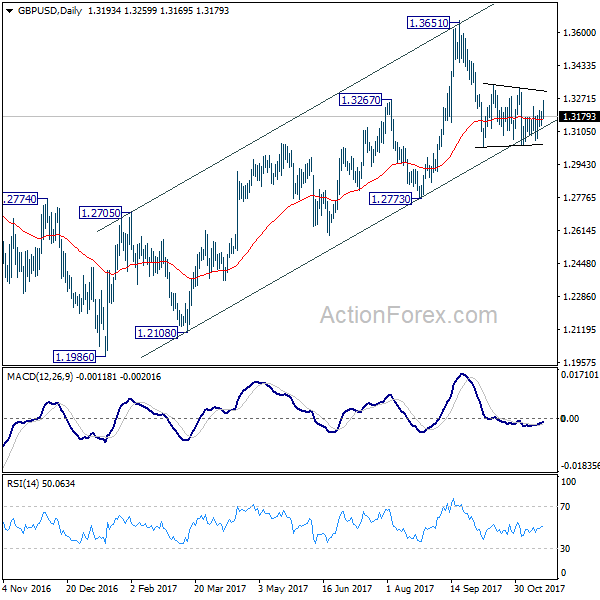
GBP/USD is still bounded in range of 1.3038/3337 and intraday bias stays neutral at this point. In case of further rise, upside should be limited below 1.3337 resistance to bring fall resumption. Break of 1.3038 will now resume decline from 1.3651 to 1.2773 key support level. However, decisive break of 1.3337 will indicate that pull back from 1.3651 is completed and medium term rise from 1.1946 is resuming.
In the bigger picture, as noted before, GBP/USD hit strong resistance from the long term falling trend line. Current development is starting to favor that corrective rebound from 1.1946 low has completed at 1.3651. Decisive break of 1.2773 will confirm this bearish case and target a test on 1.1946 low next, with prospect of resuming the low term down trend. Nonetheless, break of 1.3320 resistance will restore the rise from 1.1946 for 38.2% retracement of 2.1161 (2007 high) to 1.1946 (2016 low) at 1.5466.