
Sample Category Title
Trade Idea Wrap-up: USD/JPY – Hold long entered at 112.60
USD/JPY - 113.01
Most recent candlesticks pattern : N/A
Trend : Near term down
Tenkan-Sen level : 112.94
Kijun-Sen level : 112.86
Ichimoku cloud top : 113.47
Ichimoku cloud bottom : 113.37
Original strategy :
Bought at 112.60, Target: 113.60, Stop: 112.60
Position : - Long at 112.60
Target : - 113.60
Stop : - 112.60
New strategy :
Hold long entered at 112.60, Target: 113.60, Stop: 112.60
Position : - Long at 112.60
Target : - 113.60
Stop : - 112.60
Although the greenback extended recent decline to as low as 112.48, the subsequent rebound has retained our near term bullishness and consolidation with mild upside bias is seen for recovery to 113.40, then 113.60, however, as top has been formed at 114.74 earlier this month, reckon upside would be limited and price should falter well below resistance at 113.91, bring another decline later.
In view of this, we are holding on to our long position entered at 112.60. Below said support at 112.48 would risk weakness to 112.26-30 (100% projection of 114.74-113.09 measuring from 113.91 and previous support) but loss of momentum should prevent sharp fall below 112.00-05.

Sterling and Dollar Rebound, With No Conviction
Direction in the forex markets is rather unclear today. Euro pares back some gains after this week's strong rally. Sterling makes use of EUR/GBP's rejection of 0.9032 resistance and strengthens broadly. The pound is additionally supported by better than expected retail sales data. But momentum in Sterling is unconvincing. Similarly, Dollar also tries to rebound today but lacks conviction. House's expected passage of its own version of the tax bill might give the greenback a temporary lift. But the determining factor of the success of the tax bill will lie in how united the Senate Republicans are. And that's remain a big question.
Released from US, initial jobless claims rose to 249k in the week ended November 11, exceeding expectation of 234k. The four week moving average rose 6.5k to 237.75k. Meanwhile, continuing claims dropped -44k to 1.86m, hitting the lowest level since December 1973. Philly Fed manufacturing index dropped to 18.9, below expectation of 24.1. Import price index rose 0.2% mom in October. Industrial production rose 0.9% in October while capacity utilization rose to 77.0%. From Canada, manufacturing sales rose 0.5% mom in September. International securities transactions rose to CAD 16.81b in September.
House to vote on tax bill
The House would vote on the highly anticipated tax plan today. So far only around 10 House Republicans had declared to vote no. And the Republicans could still spare 22 votes without support from the Democrats. Hence, there shouldn't be any problem in passing the bill today. However, many see the House version as dead on arrival as it doesn't comply with Senate budge rules that prevent adding to federal deficit after 10 years. Much efforts are still needed to reconcile the two versions before effecting the final by year end. And that will also very much depend on how much drama will there be in the Senate. Ron Johnson has already voiced out his opposition to the current Senate proposal. Susan Collins also sounded alarm with the idea to include Obamacare individual mandate's repeal.
Yield curve flattening to continue
Flattening of yield curve is recently a hot topic. Spread between the 10-year and 2-year US yields fell to 64 bps, the lowest level since November 2007, today. Meanwhile, the spread between 30-year and 5-year yields also dropped below 75 bps, the lowest in about 2 week. Flattening yield curve has raised concerns as this is probably also a reason of diminished risk appetite this week, apart from disappointing global macro data.
Textbook knowledge suggests a normal yield curve is upward-sloping as yields for longer-dated investments are higher than shorter-dated ones. An inverted yield curve (short-dated yields exceed those of long-dated) is usually a signal of upcoming economic recession. A flat yield curve is the transitory period from a normal to an inverted curve. However, this interpretation does not necessarily hold true. For instance, US' economic growth managed to avoid recession, despite a series of global economic crisis from 1995-2000, years after the sharp yield curve flattening from 1994 to 1995.
More in Flattening Of US Yield Curve Likely Continues As Fed's Tightening Has Just Started
May reported to double Brexit divorce bill offer
It is reported that UK Prime Minister Theresa May is close to offering a deal to EU to settle the Brexit divorce bill. This is the total opposite of what Brexit Secretary David Davis said. That is, Davis warned EU that no number nor formula on the bill would be provided before moving on to trade talks. Moreover, it's reported that May would double the offer to GBP 40b, that is, raises it by GBP 20b. However, the news was denied by May's spokesman, who said that "we want to make progress as quickly as possible and we want to move onto talks about the future relationship as quickly as possible." Also, the spokesman noted that the reported GBP 20b is "yet more speculation".
Released from UK, retail sales rose 0.3% mom in October, above expectation of 0.2% mom.
ECB Mersch: Don't expect to further increase asset purchase
ECB Executive Board member Yves Mersch said today that market wouldn't be right to expect a "further increase in our asset purchases at the end of our program". He added that "as the situation improves, there will be a gradual normalization out of unconventional monetary policy instruments...but this gradual path is not there to disrupt the market." Also, he sounded optimistic on the outlook and said "no-one would be overly surprised if we would again slightly revise upwards our projections for growth." Also, the projected slowdown inflation at the turn of 2017/18 would be "less pronounced" as earlier feared.
ECB Governing Council member Bostjan Jazbec said that "inflation rates are moving in line with the expectations and projections of the European Central Bank." Meanwhile, the changes in oil price "do not have a major influence unless there is a long-term movement of prices." And, oil price is "just one of the factors that are being used by the ECB in forecasts and projections,"
ECB Chief Economist Peter Praet said today in Brussels that "the recalibration of our asset purchases (last month) reflects growing confidence in the gradual convergence of inflation rates towards our inflation aim." Yesterday, Praet laid out the path that the central bank is moving from unconventional measures to conventional measures in policy setting. He noted that "as we progress towards a sustained adjustment in the path of inflation and approach the time when net purchases will gradually come to an end, the residual monetary support needed to assist the economy in its transition to a new normal will increasingly come from forward guidance on our policy rates." Then, "policy rates will eventually regain their status as the main instrument of policy, and our forward guidance will revert to a singular approach."
Released from Eurozone, CPI was finalized at 1.4% yoy in October, CPI core at 0.9% yoy.
AU job growth missed, unemployment rate at 4.5 year low
Australian Dollar recovers mildly today after job data, but stays near term bearish. Employment market grew 3.7k in October, slowed from prior month's 26.6k and missed expectation of 18.9k. Nonetheless, full time jobs grew 24.3k while part time jobs dropped -20.7k. Also, Unemployment rate, dropped to 5.4%, down from 5.5%. That's also the lowest reading since February 2013. Also from Australia, consumer inflation expectation rose 3.7% in November.
RBA Assistance Governor Luci Ellis said yesterday that there more growth engines in the country other than mining. She pointed out that infrastructure spending, tourism and services as some examples. Also, the economy would be supported by relatively fast population growth and pickup in participation. In addition, there will be "indirect effects" from better infrastructure that boost productivity.
GBP/USD Mid-Day Outlook
Daily Pivots: (S1) 1.3127; (P) 1.3171; (R1) 1.3212; More....
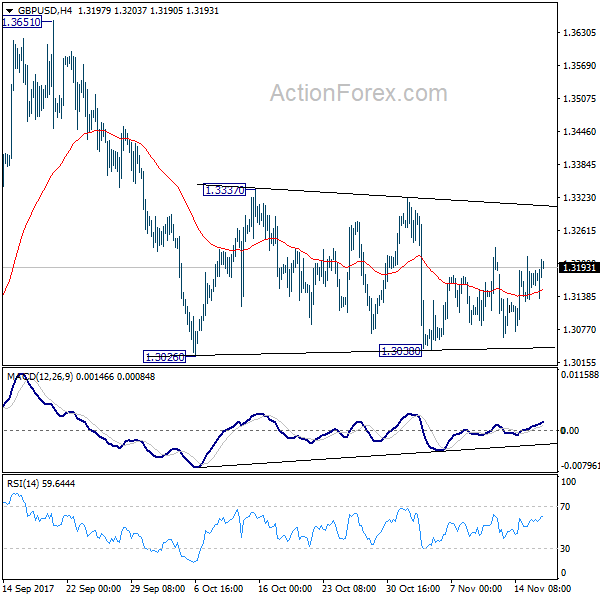
GBP/USD recovers today but stays at around middle of range of 1.3038/3337. Intraday bias remains neutral for the moment. In case of further rise, upside should be limited below 1.3337 resistance to bring fall resumption. Break of 1.3038 will now resume decline from 1.3651 to 1.2773 key support level. However, decisive break of 1.3337 will indicate that pull back from 1.3651 is completed and medium term rise from 1.1946 is resuming.
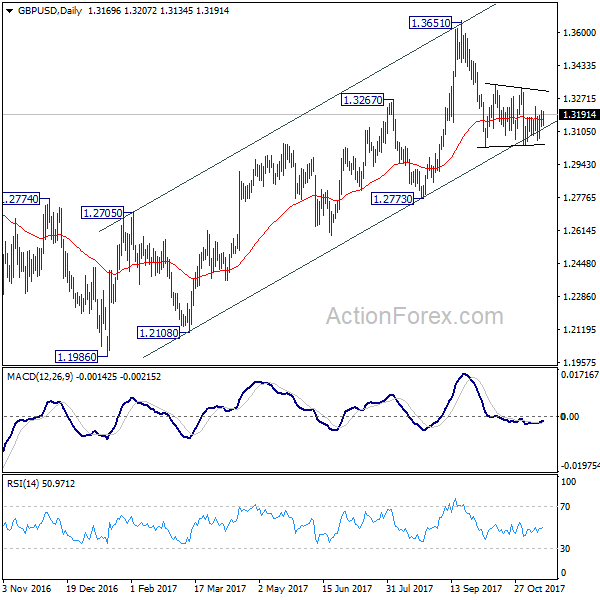
In the bigger picture, as noted before, GBP/USD hit strong resistance from the long term falling trend line. Current development is starting to favor that corrective rebound from 1.1946 low has completed at 1.3651. Decisive break of 1.2773 will confirm this bearish case and target a test on 1.1946 low next, with prospect of resuming the low term down trend. Nonetheless, break of 1.3320 resistance will restore the rise from 1.1946 for 38.2% retracement of 2.1161 (2007 high) to 1.1946 (2016 low) at 1.5466.
Economic Indicators Update
| GMT | Ccy | Events | Actual | Forecast | Previous | Revised |
|---|---|---|---|---|---|---|
| 00:00 | AUD | Consumer Inflation Expectation Nov | 3.70% | 4.30% | ||
| 00:30 | AUD | Employment Change Oct | 3.7K | 18.9K | 19.8K | 26.6K |
| 00:30 | AUD | Unemployment Rate Oct | 5.40% | 5.50% | 5.50% | |
| 09:30 | GBP | Retail Sales M/M Oct | 0.30% | 0.20% | -0.80% | |
| 10:00 | EUR | Eurozone CPI M/M Oct | 0.10% | 0.10% | 0.40% | |
| 10:00 | EUR | Eurozone CPI Y/Y Oct F | 1.40% | 1.40% | 1.50% | |
| 10:00 | EUR | Eurozone CPI Core Y/Y Oct F | 0.90% | 0.90% | 0.90% | |
| 13:30 | CAD | Manufacturing Sales M/M Sep | 0.50% | -0.20% | 1.60% | 1.40% |
| 13:30 | CAD | International Securities Transactions (CAD) Sep | 16.81B | 10.68B | 9.85B | 9.77B |
| 13:30 | USD | Initial Jobless Claims (NOV 11) | 249K | 234k | 239k | |
| 13:30 | USD | Philly Fed Manufacturing Index Nov | 18.9 | 24.1 | 27.9 | |
| 13:30 | USD | Import Price Index M/M Oct | 0.20% | 0.40% | 0.70% | |
| 14:15 | USD | Industrial Production M/M Oct | 0.90% | 0.50% | 0.30% | 0.40% |
| 14:15 | USD | Capacity Utilization Oct | 77.00% | 76.30% | 76.00% | 76.40% |
| 15:00 | USD | NAHB Housing Market Index Nov | 67 | 68 | ||
| 15:30 | USD | Natural Gas Storage | 15B |
Sterling, WTI, and Gold in Focus
Sterling modestly appreciated on Thursday morning, after UK retail sales rose by 0.3% MoM in October - a figure above market expectations. However, retail sales declined by -0.3% when compared to a year ago which was the first annual fall since 2013. With the report potentially fanning concerns over the health of the UK consumer and sustainability of Britain's consumer driven economic growth, Sterling's upside may be limited. The bearish sentiment towards the British Pound remains intact, as the growing uncertainty over Brexit talks and political risk at home, weigh heavily on the currency.
Sterling edged higher following the retail sales report, with prices trading around 1.3190 as of writing. From a technical perspective, it is all about the 1.3150 level which could act as support or resistance. Sustained weakness below 1.3150 may encourage a decline towards 1.3050 and 1.3000. Alternatively, an intraday breakout above 1.3230 may open a path back towards 1.3300.
Are Oil bulls losing steam?
WTI Crude prices were shaky and somewhat vulnerable on Thursday, despite investor expectations of OPEC extending production cuts to stabilize markets.
The damage created from the IEA downbeat outlook for oil demand, can still be seen in the commodity's price action while Wednesday's EIA report has market players pondering over how OPEC deals with rising production of US Shale. Much attention will be directed towards the OPEC meeting on 30 November which could play a role in where the commodity concludes this year. While an extension to the OPEC production cut deal may support oil markets, the question is for how long? With OPEC already forecasting slower growth in demand for its crude and predicting that US Shale output will grow faster than expected in the next four years, "extraordinary measures" may be truly needed to rebalance markets.
Taking a look at the technical picture, the sharp depreciation witnessed on Wednesday, has brought WTI bears back into the game. Sustained weakness below the $55 level may encourage a further decline towards $54.10.
Commodity spotlight - Gold
Gold found itself on a rollercoaster ride this week as the fierce battle between bulls and bears raged on.
The yellow metal jumped to a three-week high at $1289 during Wednesday's trading session, before tumbling lower after upbeat US data reinforced expectations of a US rate hike in December. While a touch of investor caution and ongoing concerns over delays in US tax reforms continues to inspire Gold bulls, bears have been fueled by rising expectations of higher US interest rates. Price action suggests that the metal is stuck in a sticky range, with a catalyst needed for the next big move. Looking at the technical picture, $1280 continues to act as a pivotal level. Sustained weakness below $1280, may encourage a further decline towards $1267. Alternatively, a daily close above $1280 is likely to inspire bulls to challenge $1289 and $1300 respectively.
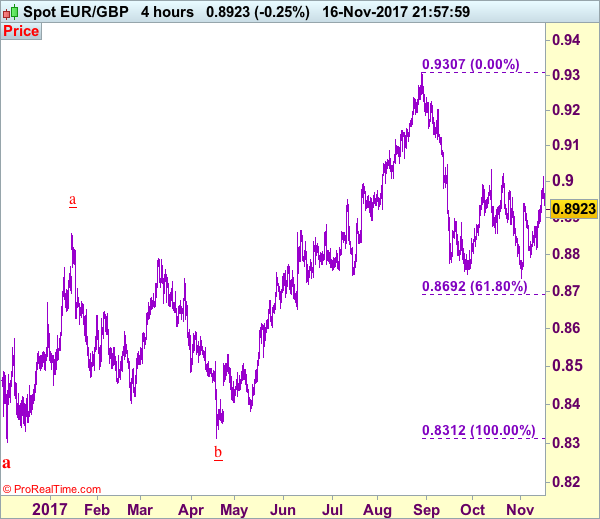
Trade Idea: EUR/GBP – Sell at 0.8975
EUR/GBP - 0.8927
New strategy :
Sell at 0.8975, Target: 0.8850, Stop: 0.9015
Position : -
Target : -
Stop : -
Although the single currency rose to 0.9015 yesterday, the subsequent retreat suggests consolidation below said resistance would be seen and weakness to 0.8870-75 is likely, below there would extend weakness to 0.8850, however, break of support at 0.8812 is needed to signal the rebound from 0.8733 has ended at 0.9015, bring subsequent fall towards 0.8791 support which is likely to hold from here.
In view of this, we are looking to sell euro on recovery as 0.8975-80 should limit upside and bring another decline. Above said resistance at 0.9015 would risk test of previous resistance at 0.9033 but only a breach of this level would signal an upside break of recent established broad range has occurred, then subsequent rise to 0.9070-75 would follow.
Our preferred count is that, after forming a major top at 0.9805 (wave V), (A)-(B)-(C) correction is unfolding with (A) leg ended at 0.8400 (A: 0.8637, B: 0.9491 and 5-waver C ended at 0.8400. Wave (B) has ended at 0.9413 and impulsive wave (C) has either ended at 0.8067 or may extend one more fall to 0.8000 before prospect of another rally. Current breach of indicated resistance at 0.9043 confirms our view that the (C) leg has ended and bring stronger rebound towards 0.9150/54, then towards 0.9240/50.
EURUSD Caps Bull Pressure, Weakens On Pullback
EURUSD: With the pair backing off higher prices ton close flat on rejection candle on Wednesday, further decline is envisaged. Resistance comes in at 1.1800 level with a cut through here opening the door for more upside towards the 1.1850 level. Further up, resistance lies at the 1.1900 level where a break will expose the 1.1950 level. Its daily RSI is bullish and pointing higher suggesting further strength. Conversely, support lies at the 1.1700 level where a violation will aim at the 1.1650 level. A break of here will aim at the 1.1600 level. Below here will open the door for more weakness towards the 1.1550. All in all, EURUSD faces further corrective weakness threats
EURAUD Pauses Strong Rally; Bullish But Overbought
EURAUD has posted a strong rally over the week, flying from 1.5081 to a five-month high of 1.5605 (+3.50%) on early Wednesday. However, the pair paused its steep uptrend soon after as the market became overbought, retracing the 23.6% Fibonacci level of the aforementioned upleg at 1.5480.
The short-term bias in the four-hour chart remains bullish given that EURAUD is currently trading above the 20 and the 50-simple moving average lines which have been positively sloping after they recorded a bullish cross on November 10. Moreover, the fact that the pair is far above the Ichimoku cloud gives another positive signal to the market. Yet, according to the technical picture, risk is tilted to the downside as the RSI is still located in overbought area above 70 and the MACD has slowed down below its signal line (both indicators are marginally below their neutral zones in the one-hour chart).
Should the pair extend its losses, the pair might head down towards the 38.2% Fibonacci at 1.5404 after it successfully breaches the 23.6% Fibonacci at 1.5480. Then from here, a violation of the 50% Fibonacci at 1.5343 would turn the bias neutral from bullish and shift the focus to the bottom of the uptrend to 1.5081.
Alternatively, if market actions drive the pair up, an immediate resistance is likely to emerge at the five-month high of 1.5605 before the 1.5700 and 1.5800 psychological levels come into view.
Canadian Dollar Quiet, Key Manufacturing Report Next
The Canadian dollar is unchanged in the Thursday session. Currently, USD/CAD is trading at 1.2761, down 0.02% on the day. On the release front, Canada releases Manufacturing Production, with the markets braced for a decline of 0.4%. In the US, unemployment claims is expected to drop to 235 thousand, and the Philly Fed Market Index is forecast to slow to 24.5 points. On Friday, Canada releases a host of inflation numbers, led by CPI. In the US, the focus will be on housing data, with the release of Building Permits and Housing Starts.
The Bank of Canada plans to proceed with caution, according to Senior Deputy Governor Carolyn Wilkins. On Wednesday, Wilkins said that less stimulus will be needed over time, and she expected wages to rise as the economy improved. Wilkins acknowledged that there was uncertainty over the future of NAFTA, and this was affecting business investment.
The US released key consumer spending and inflation data on Wednesday, and there were no surprises. CPI and Core CPI matched the forecasts, with gains of 0.1% and 0.2%, respectively. Consumer spending reports were a mix – retail sales gained 0.1%, shy of the estimate of 0.2%. Core Retail Sales came in at 0.2%, beating the forecast of 0.0%. The Federal Reserve would certainly like to see higher inflation numbers, which remain well below the Fed inflation target of 2.0%. Still, the markets are very bullish on additional rate hikes, as the odds of upcoming rate hikes continues to move higher. Currently, the likelihood of a rate hike in December stands at 96%, and a January raise is priced in at 94%.
Central banks do their best to avoid causing market volatility, which requires clear communication with the public and the markets. However, with bank policymakers making public statements on a daily basis, differences in opinion on future monetary policy or quantitative easing are bound to come up, and this can lead to market movement. Early in the week, Fed Chair Janet Yellen and ECB Mario Draghi participated at an ECB event which focused on communication with the markets. Yellen acknowledged that the FOMC committee of 19 members posed problems, as members did not always speak with a unified voice. Yellen admitted that this problem would not be solved anytime soon, saying it was "a work in progress".
CAC Rebounds as Automakers Shares Move Higher
The CAC has posted strong gains in the Thursday session. Currently, the CAC is at 5,336.50, up 0.66% since the Wednesday close. On the release front, Final CPI gained 1.4% and Core Final CPI gained 0.9%, as both readings matched the forecasts. On Friday, ECB President Mario Draghi and German Buba President Jens Weidmann speaks at Frankfurt European Banking Congress.
It's been a rough November for the CAC, but there was some good news on Thursday, with the index moving higher. Car makers are leading the way, as Peugeot and Renault are up 1.38% and 1.05%, respectively. Cyclical stocks have been moving higher in the French and German stock markets on Thursday, after under-performing in recent weeks. There was a bright spot on Wednesday from Airbus Group, which announced that it had signed an order to sell 430 aircraft to Indigo Partners, for a price of $49.5 billion. This marks the company's biggest deal in its history, and Airbus shares are up 2.53% on the day.
Janet Yellen and Mario Draghi attended at ECB event this week, with the focus on effective communication with the markets. Central bankers strive to remain on the sidelines and not trigger market volatility, but this can be a difficult task at times. Bank policymakers make public statements on an almost daily basis, and differences in opinion on future monetary policy or quantitative easing are bound to come up and can lead to market movement. Yellen was candid that the Fed is affected by this problem, but didn't offer solution. She acknowledged that the FOMC committee of 19 members meant that members did not always present a unified message. Yellen admitted that this problem would not be solved anytime soon, saying it was "a work in progress". To be fair, this is also an issue for the ECB, as the markets have on occasion reacted to comments from individual ECB policymakers concerning future policy.
COPPER – Recovery Rally is Underway but Concerns about China’s Slowdown Weigh
Copper was up nearly 1% on Thursday on recovery acceleration from 2.0324. Bear-leg from 3.2580 (16 Oct peak) found footstep at 3.0324 (Fibo 61.8% of 2.8930/3.2580 ascend) above which Morning Doji Star reversal pattern is forming.
Recovery cracked important barrier at $3.0693 (broken 55SMA) but close above here is needed to complete reversal pattern and signal further upside.
Near-term techs are regaining traction and could support for further recovery which also needs lift above thick hourly cloud top ($3.0840), however daily studies remain weak and may limit recovery along with increasing concerns about a slowdown in China's economy. China is the world's top consumer of the metal and weaker economy could result in lower demand which could push copper price lower.
Failure to clear 55SMA would be initial negative signal while sustained break below $3.0324 pivot would open way for further easing towards supports at $3.0110 (09 Oct trough) and psychological $3.0000 support.
Res: 3.0693; 3.0775; 3.0910; 3.1207
Sup: 3.0430; 3.0324; 3.0110; 3.0000
EURUSD Further Bearish Below 1.1767 Level
The euro continues to correct lower against the U.S dollar, after numerous technical rejections from the 1.1800 level during the European trading session, and subdued Eurozone inflation numbers. Official data showed eurozone CORE CPI decreasing 0.1 percent in October, adding to the already negative trading sentiment surrounding the EURUSD today. The EURUSD pair currently trades around the 1.1765 level, as investors await a raft of U.S economic data and U.S political risks during the upcoming U.S trading session.
The EURUSD remains strongly bearish while price-action continues to decline below the 1.1767 level. Intraday sellers will likely try to push the pair towards the key 1.1710 level.
Should price-action trade above the 1.1767 level, buyers will likely start to re-test the 1.1800 level. Extended intraday resistance remains at the 1.1860 and 1.1910 levels.
