Sample Category Title
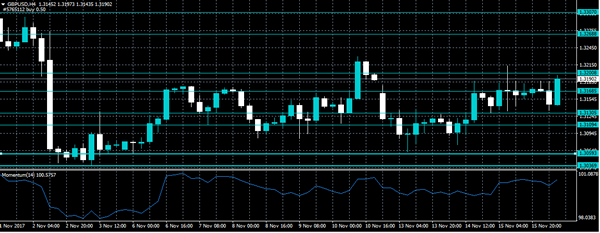
GBPUSD Intraday Bullish Above 1.3168 Level
The British pound has pressed higher against the U.S dollar, following the release of better than expected UK Retail Sales data, for the month of October. The GBPUSD pair currently trades close to the 1.3200 level, as the pound's intraday sentiment remains strong after UK Retail Sales increased 0.3 percent month-on-month. Traders now await a raft of FED speakers and industrial production data figures from the U.S economy. Financial markets are likely to remain tense, until the outcome of today's vote on the proposed tax reforms in U.S Senate.
The GBPUSD pair remains intraday bullish while trading above the 1.3168 level. Further bullish advancement towards the 1.3268 and 1.3307 levels seem increasingly likely.
Should price-action decline below the 1.3168 level, sellers will likely start to target the 1.3130 and 1.3109 technical support regions.
Flattening Of US Yield Curve Likely Continues As Fed’s Tightening Has Just Started
The talk of the day is undoubtedly the flattening of US yield curve with the spread between the 10-year and 2-year yields fell to 64 bps, the lowest level since November 2007 on Thursday. Meanwhile, the spread between 30-year and 5-year yields also dropped below 75 bps, the lowest in about 2 week. Flattening yield curve has raised concerns as this is probably also a reason of diminished risk appetite this week, apart from disappointing global macro dat. Textbook knowledge suggests a normal yield curve is upward-sloping as yields for longer-dated investments are higher than shorter-dated ones. An inverted yield curve (short-dated yields exceed those of long-dated) is usually a signal of upcoming economic recession. A flat yield curve is the transitory period from a normal to an inverted curve. However, this interpretation does not necessarily hold true. For instance, US' economic growth managed to avoid recession, despite a series of global economic crisis from 1995-2000, years after the sharp yield curve flattening from 1994 to 1995 (Second Chart).
Coincidence with Fed Tightening
Meanwhile, we notice that US yield curve flattens as the Fed is in the tightening cycle. The chart below shows that US 10-year and 2-year yield spread narrow significantly during the 5 Fed funds rate hike cycle since the 1980s. For instance, in the previous tightening cycle from June-2004 to June-2006 when the Fed increased the policy rate by +425 bps, the 10-year and 2-year yield spread plunged -157 bps. Yet, the extent of flattening, indicated by the narrowing of yield spread, does not necessarily increase with the number of rate hikes. The current rate hike cycle began in December 2015 as the Fed raised the policy rate for the first time since the global financial crisis. While missing its own guidance with only one rate hike in 2016, the Fed is on track to raise the policy rate for three times this year, followed more hikes in 2019. The tightening cycle, as possibly the yield curve flattening, has just begun.
Bear Flattening
The recent flattening is characterized as 'bear flattening', as the flattening of the yield curve is more driven by the rise in short-dated yields (e.g. 2-year yield), compared with 'bull flattening' which is driven by the fall in long-dated yields (e.g. 10-year yields). This phenomenon also happened in the previous three rate hike cycles (1994-95, 1999-00 and 2004-06). The chart below shows that the last yield curve steepness peaked in December 2016 and has flattened 70 bps since then (as of November 15). During the period, 2-year yield rose +49 bps while 10-year yields slipped -22 bps. The recent rally in 2-year yields to the highest in 7 years has clearly been driven by December rate hike expectations. CME's Fed funds futures have fully priced in a rate hike next month over the past two days, compared with 98.2% chance last week and 88% last month. The latest inflation report has reinforced, if not intensified, such hope. While headline CPI in moderated to +2% y/y in October from +2.2% a month ago, this had been widely anticipated. Surprisingly, core inflation climbed +0.1 percentage point higher to +1.8%, marking the first increase since January.
Yield Curve and Inflation Expectations
Yield curve flattening also reflects the low inflation expectations in the US. Persistently subdued inflation has put the Fed in a dilemma in its rate hike decision. For many months, the Fed has admitted that inflation has stayed low. Yet, the members have decided to look through the weaknesses which are resulted from transitory factors. At the November FOMC meeting, the members indicated that 'inflation for items other than food and energy [core inflation] remained soft'. They also noted that CPI measures 'have declined this year and are running below +2%'. On net, the Fed continued to characterize the near-term risks to the economic outlook as 'roughly balanced', and it would continue 'monitoring inflation developments closely'. We certainly do not expect the Fed to change the tone in December merely because of October's upside surprise. Yet, the stronger-than-expected core CPI would inevitably justify the rate hike decision. A 'bear flattening' this time evidences that the market has been convinced by the Fed that its normalization policy would continue despite soft inflation.
DAX Moves Higher As Cyclicals Rebound
The DAX index has posted gains in the Thursday session. Currently, the DAX is at 13,047.00, up 0.46% since the end of Wednesday trade. On the release front, Final CPI gained 1.4% and Core Final CPI gained 0.9%, as both readings matched the forecasts. On Friday, ECB President Mario Draghi and German Buba President Jens Weidmann speaks at Frankfurt European Banking Congress.
The DAX has rebounded on Thursday, after suffering strong losses over the past week. Cyclical stocks are in green territory. Financial stocks have moved higher, led by Commerzbank and Deutschebank, with gains of 1.90% and 2.13%, respectively. Auto and technology stocks are also higher on Thursday. The stronger euro and profit-taking has weighed on the European markets, and it remains to be seen whether the DAX has turned a corner and the upward direction will continue.
Central banks do their best to avoid causing market volatility, which requires clear communication with the public and the markets. However, with bank policymakers making public statements on a daily basis, differences in opinion on future monetary policy or quantitative easing are bound to come up, and this can lead to market movement. Early in the week, Fed Chair Janet Yellen and ECB Mario Draghi participated at an ECB event which focused on communication with the markets. Yellen acknowledged that the FOMC committee of 19 members posed problems, as members did not always speak with a unified voice. Yellen admitted that this problem would not be solved anytime soon, saying it was “a work in progress”. To be fair, this is also an issue for the ECB, as the markets have on occasion reacted to comments from individual policymakers.
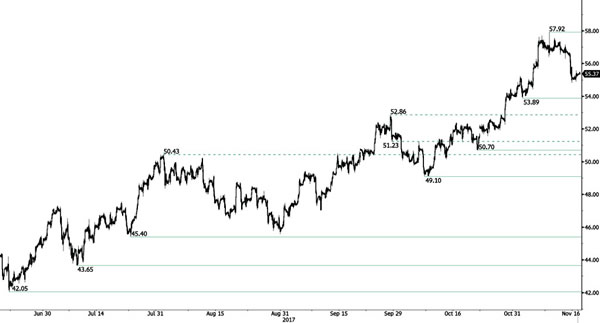
CRUDE OIL Consolidating Within Positive Technical Structure
Crude Oil is consolidating after the commodity set up resistance at 57.92 (08/11/2017 high). The commodity is trading at 1-year high. Expected to show further shot-term bearish consolidation. Indeed the technical structure has a history of decent consolidation phase.
In the long-term, crude oil has recovered after its sharp decline last year. However, we consider that further weakness are very likely. For the time being the pair lies in an upside momentum. Strong support lies at 35.24 (05/04/2016) while resistance can now be found at 55.24 (03/01/2017 high).
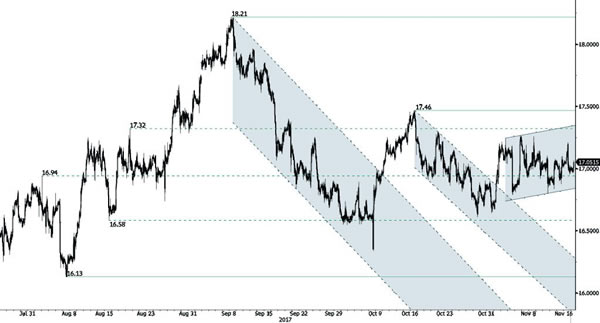
SILVER Increasing Slightly
Silver is heading higher. Hourly support can be found at 16.60 (27/10/2017 low). Hourly resistance is given at 17.46 (13/10/2017 high). Additional support can be found at 16.13 (06/10/2017 low).
In the long-term, the trend is rater negative. Further downsides are very likely. Resistance is located at 25.11 (28/08/2013 high). Strong support can be found at 11.75 (20/04/2009).
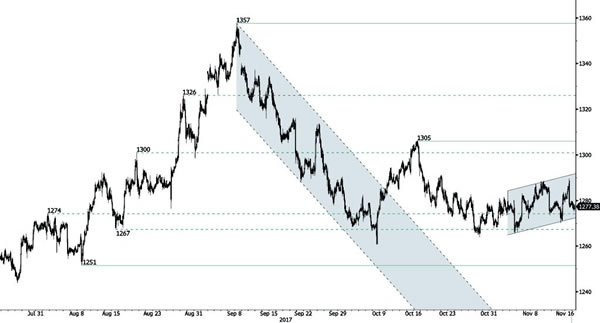
GOLD Riding Short-Term Uptrend Channel
Gold is pushing higher. The technical structure confirms the end of the consolidation phase. Support lies at a distance at 1251 (08/08/2017 high). Resistance is now located at 1288 (20/10/2017).
In the long-term, the technical structure suggests that there is a growing upside momentum. A break of 1392 (17/03/2014) is necessary ton confirm it, A major support can be found at 1045 (05/02/2010 low).
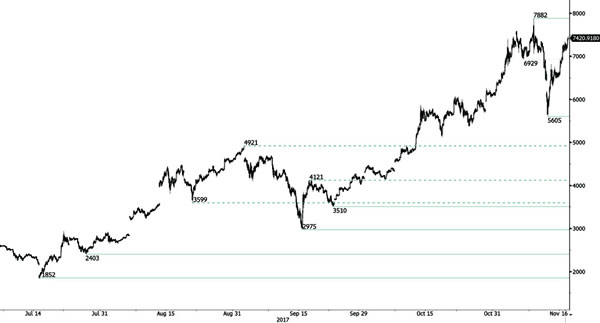
BITCOIN $8000 Before End Of The Week?
Bitcoin is back to recent its highest levels after a profit-taking period. The technical structure shows a tremendous positive short-term momentum. Hourly support is located at 5605 (13/11/2017 low). Strong support stands very far at 2975 (22/08/2017 low). In the short-term, the digital currency should continue rising.
In the long-term, the digital currency has had an exponential growth. There are decent likelihood that the asset will reach $10'000.
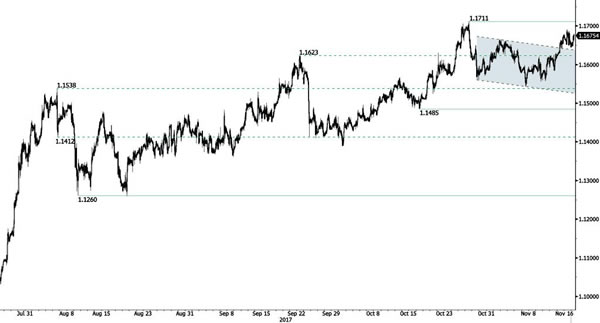
EUR/CHF Stalling Below Resistance At 1.17
EUR/CHF has broken uptrend channel. Support is given at 1.1610 (27/10/2017 low). Expected further consolidation.
In the longer term, the technical structure has reversed. Strong resistance is given at 1.20 (level before the unpeg). Yet, the ECB's QE programme is likely to cause persistent selling pressures on the euro, which should weigh on EUR/CHF. Supports can be found at 1.0184 (28/01/2015 low) and 1.0082 (27/01/2015 low).
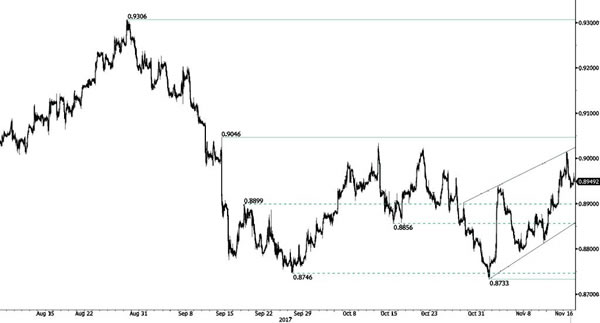
EUR/GBP Strong Upside Risks
EUR/GBP's bullish pressures are string. The pair is heading towards resistance at 0.9046 (05/09/2017 high). Hourly support is given at a distance at 0.8733 (01/11/2017 low). Expected to show positive momentum.
In the long-term, the pair has largely recovered from recent lows in 2015. The technical structure suggests a growing upside momentum. The pair is trading above from its 200 DMA. Strong resistance can be found at 0.9500 (psychological level).
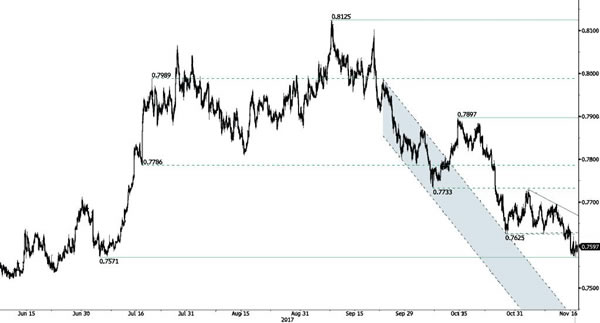
AUD/USD Monitoring Support Area Below 0.76
AUD/USD is ready to go even lower showing that downside pressures are still lively. Hourly resistance is given at a distance at 0.7897 (13/10/2017 high). Expected to show renewed pressures towards key support at 0.7571 (05/07/2017 low).
In the long-term, the trend is turning positive. Key supports stands at 0.6009 (31/10/2008 low) . A break of the key resistance at 0.8164 (14/05/2015 high) is needed to invalidate our long-term bearish view.