Sample Category Title
GBP/USD: UK Average Earnings Index
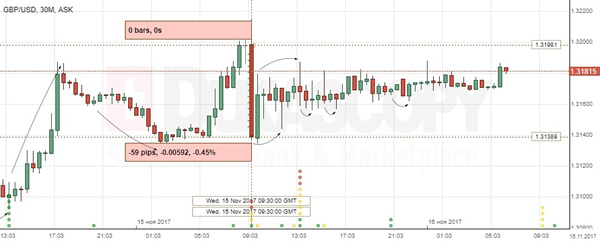
The British Pound fell strongly against the US Dollar on the mostly upbeat UK job market report. The GBP/USD dropped 59 base points or 0.45% to the 1.1318 mark, to recover modestly back to the 1.3170 area.
The Office for National Statistics said that Britons' total earnings, including bonuses, marked a 2.2% yearly growth pace in the three months period to September. Meanwhile, the UK unemployment rate held at 4.3% in the reported month, the lowest level in four decades, but failed to push wages. Majority of the Bank of England's policymakers anticipate low unemployment rate to fuel pay growth soon. However, consumer price inflation remaining at 3.0% continued to squeeze households' spending power.
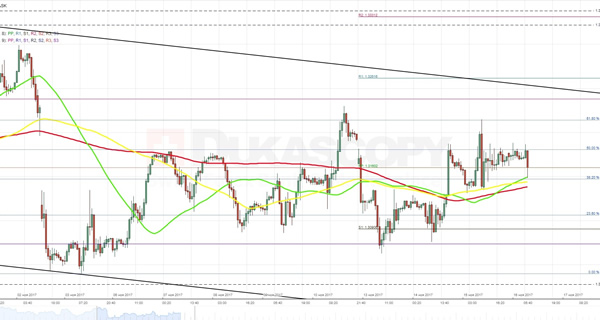
EURUSD Analysis: Halts Surge Amid US Inflation Data
Initially, the Euro continued to rapidly advance against the Dollar and practically reached the 1.1850 mark. However, the subsequent release of the American inflation and retail sales data that matched with analysts’ expectations returned the pair back to the 55-hour SMA near the 1.1780 level. As this moving average is additionally backed up by a combination of the 38.2% Fibonacci retracement level and the weekly R2, there is a little chance that the pair will manage to break to the bottom without proper impulse. The same applies for opposite direction, which is secured by the 50% retracement level and the monthly R1. So, this trading session the pair is likely to spend moving horizontally between these barriers unless the US manufacturing and jobs data will cause some notable price movements.
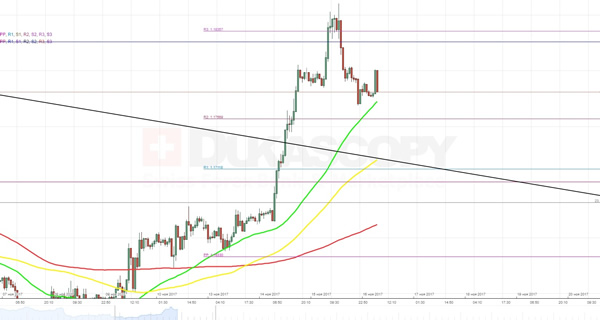
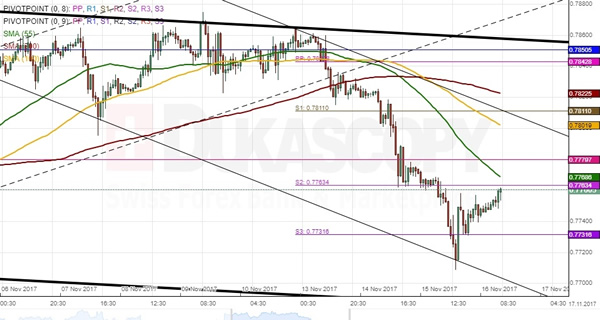
GBPUSD Analysis: Ready For Another Attempt To Jump To 1.3230
As release of British employment data, generally, was perceived positively, the Pound expectedly climbed to the 1.3200 level. Nevertheless, a subsequent release of the American retail sales and inflation data neutralized this achievement by returning the pair back to combined support area formed by the 55-, 100- and 200-hour SMAs near the 1.3135 mark. After making a rebound the cable resumed the surge. Second day in a row bulls are hoping to use macroeconomic data release to push the rate to the pre-fall 1.3230 level. Whether they succeed or not will mainly depend on the UK retail sales growth rate. There just a need to take into account that the pair is unlikely to climb above a combination of the monthly PP and upper edge of dominant channel from the north and the above MAs from the south.
USDJPY Analysis: Moves To South As Expected
As it was expected, the currency exchange managed to break below both the psychological 113.00 level as well as the weekly S1 located at 112.86. A release of better than expected American retail sales and inflation data did not ruin this achievement. In contrast, it simply accelerated a rebound from the bottom trend-line of the currently active descending channel. Generally, the exchange rate is expected to resume the movement upwards. However, there is a little chance that it will manage to climb above new combined resistance set up by the monthly PP and the falling 55- and 100-hour SMAs. To put it differently, the pair is expected to make another rebound and continue heading to the south. The main factor that might alter this assumption will be the upcoming US release of manufacturing data.
XAUUSD Analysis: Trades Below Moving Averages
Using support provided by the 55-, 100- and 200-hour SMAs together with the monthly PP, the rate managed to climb to the weekly R1. In other words, the pair has practically managed to form the third reaction high of a long ascending channel. However, a release of widely expected American data created a momentum that enabled bears to return the rate back to the weekly PP at 1,277.10. Hence, all four abovementioned support levels turned into resistance. As they are all concentrated around the 1,279.00 mark, it is unlikely that bulls will manage to push the pair through them without new strong upside momentum. There is a need to notice that the similar situation has already happened in beginning of the week when the gold failed to climb upstairs after a solid strengthening of the buck
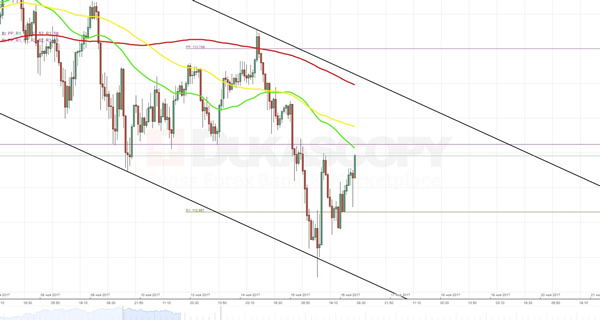
CAD/CHF 1H Chart: Pair Faces Strong Resistance
CAD/CHF is trading in two channels. The senior one has confined the rate since early September, while the junior one was initiated on Monday when the rate bounced off the 0.7870 mark. If looking at the pair's current movement, the Aussie reversed from the junior channel mid-Wednesday and initiated a slight recovery. However, the rate has shown lack of volatility during this session, as the weekly S2 and the 55-hour SMA near 0.7760 is putting downward pressure on it. This could result in the Australian Dollar entering a consolidation phase but nevertheless moving towards the upper boundary of the junior channel. By and large, the base scenario favours the rate edging lower during the following two weeks just to approach the bottom boundary of the senior channel.
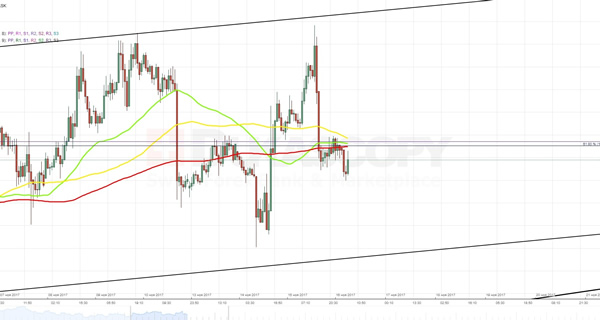
AUD/CAD 1H Chart: Aussie At Crossroads
During the past two weeks, the Australian Dollar has weakened against its Canadian counterpart. This movement downwards was confined in a falling wedge. Along the way, the Aussie likewise breached a medium-term channel early on Wednesday when sluggish Australian wage data initiated a selling spree for the pair. The pair has since returned at an intersection of both patterns circa 0.97. It should be noted that these patterns signal to opposite directions, as falling wedge is generally a bullish pattern, while a breakout of the channel should mean a subsequent decrease in value. Taking into account technical indicators and the seniority of the channel, it is more likely that the bearish sentiment prevails and sends the rate for a plunge. A possible stopping point could be the monthly S2 at 0.9562. Conversely, a strong resistance cluster is formed by the 200-hour SMA, the weekly PP and the monthly S2 in the 0.9740/50 territory.
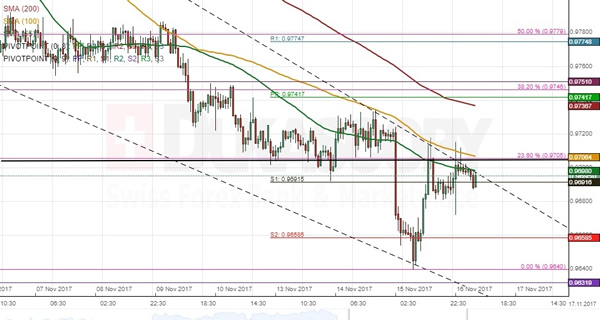
USD/CHF Elliott Wave Analysis
USD/CHF – 0.9986
The greenback retreated after faltering below resistance at 1.0039, retaining our view that further consolidation below this level would be seen, however, still reckon downside would be limited to 0.9830-40 and bring another rise later, above said resistance at 1.0039 would add credence to our view that low has been formed at 0.9421 and the upmove from there may extend further gain towards previous resistance at 1.0100 but overbought condition should prevent sharp move beyond 1.0150 and reckon 1.0200-10, risk from there is seen for a retreat to take place later.
Our preferred count on the daily chart is that early selloff to 0.9630 is an end of the larger degree wave III and major correction is unfolding from there with a leg ended at 1.2298 (Nov 2008 with (a): 1.0625, (b):1.0011 and (c):1.2298), wave b ended at 0.9910 with (a): 1.0370, (b): 1.1967, (c): 0.9910. The rise from there to 1.1730 is the wave c which also marked the end of wave IV and wave V has possibly ended at 0.7068.
On the downside, expect pullback to be limited to 0.9875-80 and 0.9840-50 should hold, bring another rise later. Below previous resistance at 0.9837 (now support) would defer and risk correction to 0.9795-00 but downside should be limited to 0.9755-60 and support at 0.9737 should remain intact, bring another rise. Only a drop below 0.9737 would signal top is formed instead, bring test of key support at 0.9705 which is likely to hold from here.
Recommendation: Hold long entered at 0.9875 for 1.0075 with stop below 0.9775.
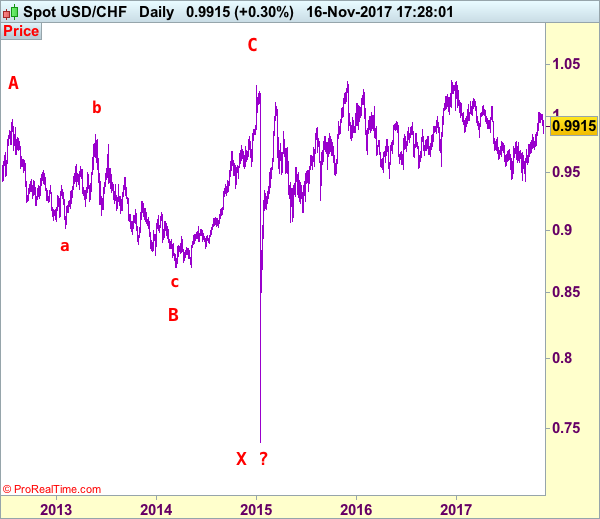
Dollar's long-term downtrend started from 2.9343 (Feb 1995) and it was unfolding as a (A)-(B)-(C) with (A): 1.1100, (B): 1.8310 (26 Oct 2000), then followed by another impulsive wave (C) with wave III ended at 0.9630 (Mar 2008). Under this count, correction in wave IV has possibly ended at 1.1730 and wave V already broke below support at 0.9630 and met indicated downside target at 0.7500 and 0.7400. The reversal from 0.7068 suggests the wave V has possibly ended and the breach of resistance at 0.9595 add credence to this view and indicated upside target at 1.0000 had been met, however, the sharp retreat from 1.0296 to 0.7401 suggests choppy trading would be seen but price should stay above said record low at 0.7068.

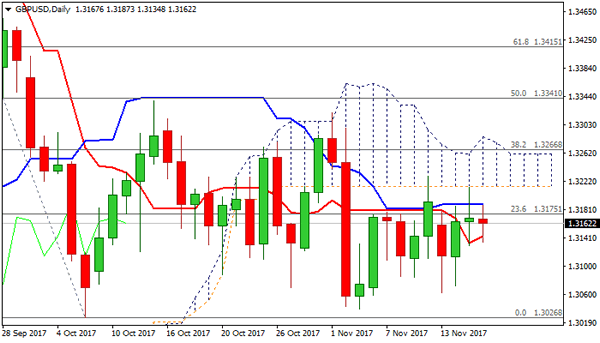
Technical Outlook: GBPUSD – Directionless Ahead Of UK Data
Cable is treading water in early Thursday after previous day’s action ended in Doji candle, showing indecision at key 1.3214 barrier (daily cloud base).
Repeated rejections at cloud base and close below converged 20/30SMA’s (1.3170 zone) suggest upside attempts might be running out of steam.
Mixed studies on daily chart do not provide clear direction signal.
Rising 10SMA (1.3146) offers immediate support, guarding lower pivot at 1.3116 (100SMA) loss of which would expose the base of broader range (1.3026/1.3337).
Conversely, penetration of daily cloud and eventual break above would generate bullish signal and open range tops for test.
UK retail sales data are in focus today with positive forecasts (Oct 0.1% vs Sep -0.8% / Core 0.1% vs -0.7%) expected to boost pound on release at / above forecasted numbers.
Res: 1.3187, 1.3214, 1.3285, 1.3298
Sup: 1.3146, 1.3116, 1.3072, 1.3061
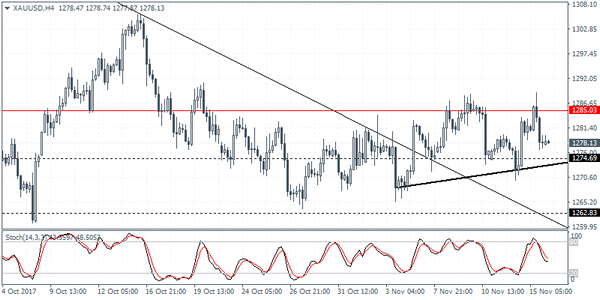
XAUUSD Intraday Analysis
XAUUSD (1278.13): Gold prices remain range bound as price action continues to consolidate within the resistance level of 1285 and support near 1274.70. This sideways range could see a short term breakout in either direction which could set the next leg in the short-term trend. Below 1274.70, gold prices are at risk of declining back to 1262.83 where the previous support level exists. While to the upside, a convincing close above 1285 is requiredin order forprice to set the stage for a rally towards the 1320 region. We currently notice a potential ascending triangle pattern that is taking shape which puts the bias to the upside.