Sample Category Title
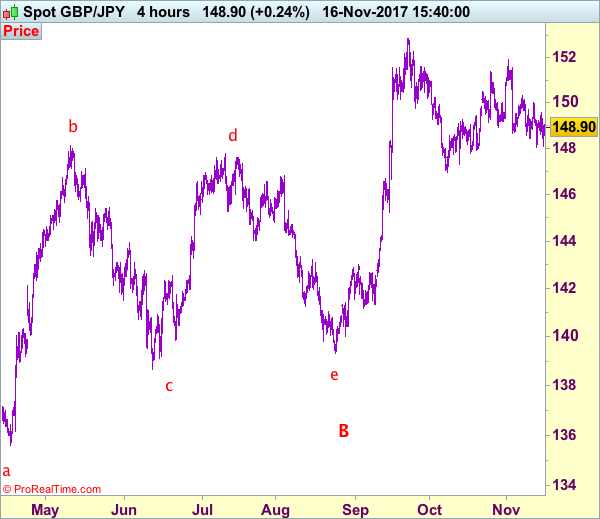
Trade Idea: GBP/JPY – Stand aside
GBP/JPY - 148.85
New strategy :
Stand aside
Position: -
Target: -
Stop:-
Although sterling slipped again yesterday to as low as 148.10, as the pound has rebounded again after holding above support at 148.05, retaining our view that further consolidation would take place and another bounce to 149.50-55 cannot be ruled out, however, reckon resistance at 150.00 would hold and bring another decline later.
On the downside, below said support at 148.05 would signal the erratic fall from 151.90 top is still in progress for weakness to previous support at 147.80 but oversold condition should limit downside and support at 147.30 should remain intact.
Our preferred count is that larger degree wave V with circle is unfolding from 251.12 with wave (I) 219.34, (II): 241.38 and wave (III) is subdivided into 1: 192.60, 2: 215.89 (23 Jul 2008) and wave 3 ended at 118.87 earlier in 2009. The correction from there to 162.60 is wave 4 which itself is a double three and is labeled as first a-b-c ended at 151.53, followed by wave x at 139.03, 2nd a ended at 162.60, 2nd b at 146.75 and 2nd c leg of wave 4 ended at 163.00. Therefore, the decline from 163.00 to 116.85 is now treated as wave 5 which also marked the end of larger degree wave (III), hence wave (IV) major correction has commenced for retracement of the wave (III) from 241.38 and upside target at 183.95-00 (50% Fibonacci retracement of the wave (II) from 241.38) had been met, a drop below 160.00 would suggest wave (IV) has ended at 195.85, bring decline in wave (V) for initial weakness to 130 (already met) and 120.
Forex: Positive US Data Negated By Tax Plan Opposition
The US Labor Department released data on Wednesday showing the consumer price index edged up by 0.1% in October after climbing by 0.5% in September. The modest increase in consumer prices was in line with market expectations. CPI excluding food and energy prices climbed by 0.2% in October after inching up by 0.1% in the previous month – as expected by the markets. The US Commerce Department released data showing that US retail sales rose by 0.2% in October after spiking by an upwardly revised 1.9% in September. This slight increase beat market expectations and gives more justification for the Fed to hike rates in December as the markets are >90% expecting. Such data should have boosted USD but that was countered on news that the Senate Republican tax plan received opposition from two Republican lawmakers, a possible warning sign for the plan. This is more damning as the Republican party can’t lose more than 2 votes from their ranks for the reform proposal to pass.
Data, on Wednesday, from the UK Office of National Statistics (ONS) showed UK unemployment holding at 4.3%, unchanged in the last 3 months and at its lowest rate for 42 years. The ONS also released average earnings data that, year-on-year, climbed to 2.2%. Whilst average earnings are rising, the gap to UK inflation is concerning for monetary policymakers. Currently, UK inflation is running at an annualized rate of 3% which means that real average earnings, adjusted for inflation, have dropped 0.4% from a year ago. The Bank of England Monetary Policy committee will need to digest the current, and future data, before making any change in monetary policy.
The Japanese Ministry of Economy, Trade and Industry released data showing Japan’s industrial production declined less than forecast in September. Industrial production dropped to a seasonally adjusted monthly 1% in September, beating the 1.1% decrease reported earlier. This was followed by a 2% rise in August.
EURUSD is 0.1% lower in early Thursday trading at around 1.1778.
USDJPY is 0.2% higher in early session trading at around 113.10.
GBPUSD is little changed in early trading at around 1.3172.
Gold in unchanged overnight, currently trading around $1,277.
WTI is 0.15% higher in early trading at around $55.56.
Major data releases for today:
At 09:30 GMT, UK National Statistics will release Retail Sales (MoM & YoY) for October. Month on Month data is forecast to come in at 0.1%, an improvement on the previous release of -0.8%. Year on Year data is forecast at -0.6% a significant drop from the previous release of 1.2%. The markets will likely see GBP volatility on the data release.
At 10:00 GMT, Eurostat will release CPI and CPI Core (YoY) data for October. CPI is expected unchanged at 1.4% with Core CPI forecast at 0.9%, lower than the previous release of 1.1%. Expect EUR volatility if the actual release is significantly different from the forecast.
At 13:30 GMT, the US Department of Labor will release Initial Jobless Claims for the week ending November 10th along with Continuing Claims for the week ending November 3rd. Continuing claims are expected lower at 1.895M compared to the previous release of 1.901M. Initial Jobless Claims are forecast to come in at 253K, a slight reduction from the previous release of 239K. If the data is significantly different from expectations the markets will experience USD volatility.
At 14:00 GMT, Bank of England Governor Mark Carney is scheduled to speak at the Future Forum at St. George’s Hall, Liverpool, England.
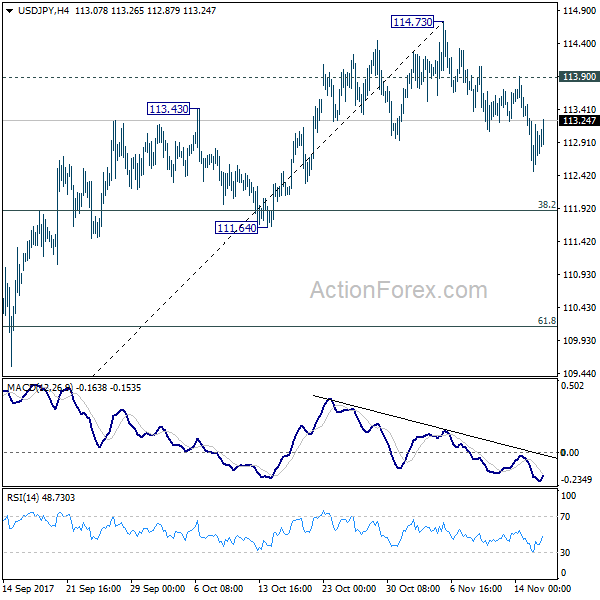
USD/JPY Daily Outlook
Daily Pivots: (S1) 112.40; (P) 112.94; (R1) 113.42; More...
With 113.90 minor resistance intact, deeper fall could be seen to 38.2% retracement of 107.31 to 114.73 at 111.89 first. Sustained break of 111.64 support will now argue that rise from 107.31 has completed. In that case, USD/JPY should target 61.8% retracement at 101.14. On the upside, break of 113.90 resistance is needed to confirm completion of the fall. Otherwise, near term outlook will now stay cautiously bearish.
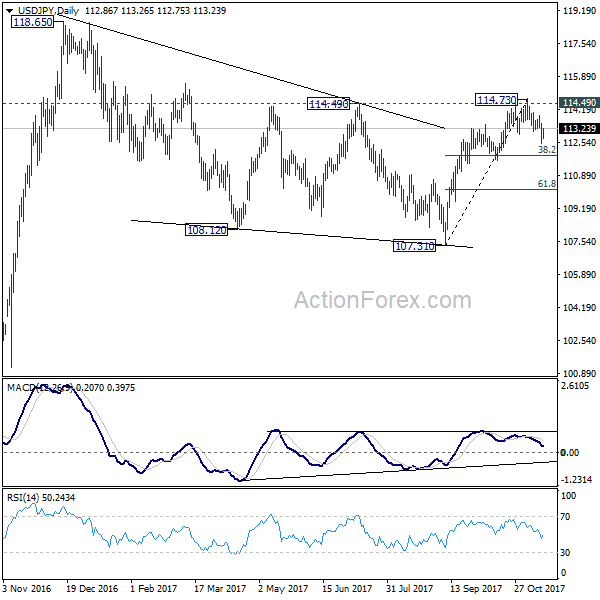
In the bigger picture, medium term rise from 98.97 (2016 low) is not completed yet. It should resume after corrective fall from 118.65 completes. Break of 114.49 resistance will likely resume the rise to 61.8% projection of 98.97 to 118.65 from 107.31 at 119.47 first. Firm break there will pave the way to 100% projection at 126.99. This will be the key level to decide whether long term up trend is resuming. However, firm break of 111.64 support will dampen this view and turn focus back to 107.31 instead.
Forex Technical Analysis: EUR/USD, USD/JPY, GBP/USD
EUR/USD
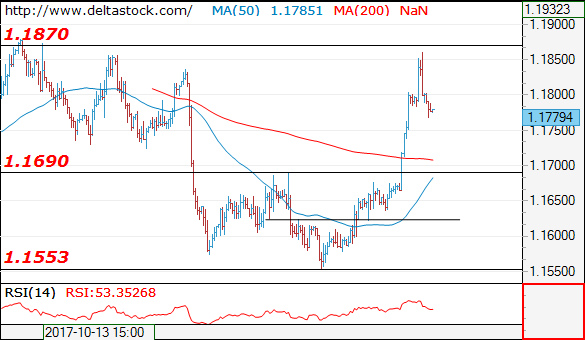
Current level - 1.1779
Yesterday's rise tested precisely the resistance at 1.1870 and the reversal below that zone will aim to correct the whole upmove since 1.1550 low. The intraday bias is bearish below 1.1820, for a slide to 1.1730.
| Resistance | Support | ||
| intraday | intraweek | intraday | intraweek |
|
1.1820 |
1.1870 |
1.1730 |
1.1690 |
|
1.1870 |
1.2090 |
1.1690 |
1.1550 |
USD/JPY
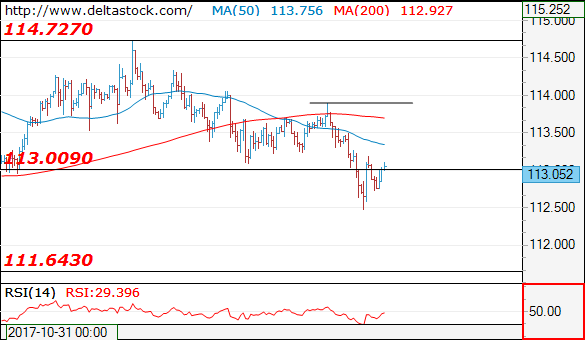
Current level - 113.05
My outlook here is bearish, for a break through 112.50 low, towards 111.60. Initial resistance lies at 113.25 and crucial on the upside is 113.90.
| Resistance | Support | ||
| intraday | intraweek | intraday | intraweek |
|
113.25 |
115.50 |
112.50 |
111.60 |
|
113.90 |
116.80 |
111.60 |
107.30 |
GBP/USD
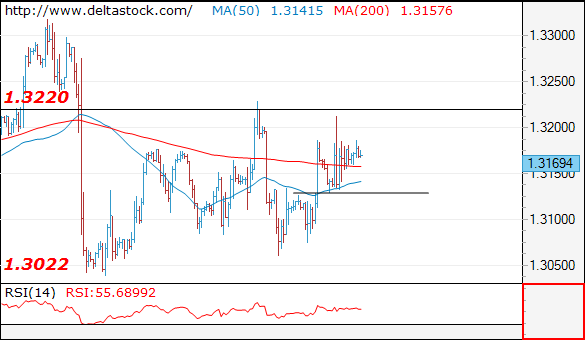
Current level - 1.3169
The recent test of 1.3220 failed, but the outlook remains positive above 1.3130, for a climb towards 1.3340 resistance zone.
| Resistance | Support | ||
| intraday | intraweek | intraday | intraweek |
|
1.3180 |
1.3220 |
1.3130 |
1.3020 |
|
1.3220 |
1.3340 |
1.3060 |
1.2760 |
USD/CAD Daily Outlook
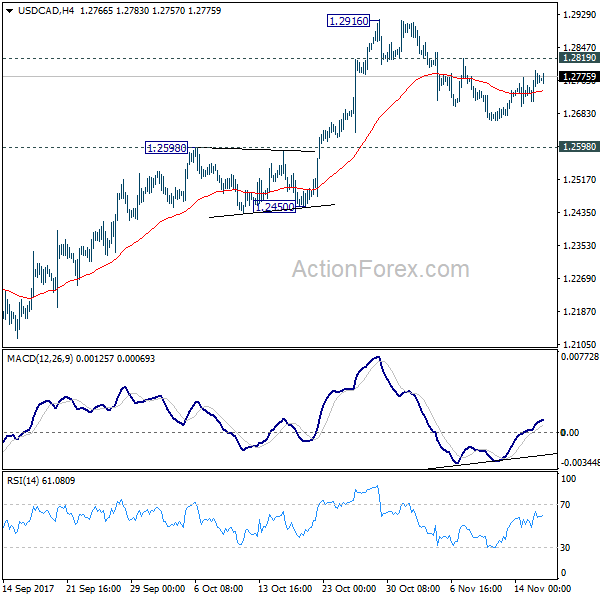
Daily Pivots: (S1) 1.2721; (P) 1.2755; (R1) 1.2797; More....
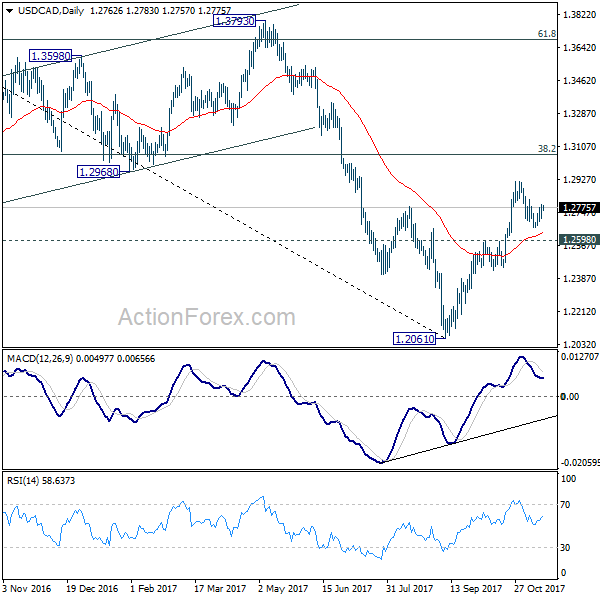
Intraday bias in USD/CAD remains neutral and near term outlook stays bullish as long as 1.2598 resistance turned support holds. On the upside, above 1.2819 minor resistance will turn bias back to the upside for 1.2916 high first. Break there will extend the rise from 1.2061 to 38.2% retracement of 1.4689 to 1.2061 at 1.3065. However, sustained break of 1.2598 will argue that rebound from 1.2061 has completed after hitting 55 week EMA (now at 1.2916). Near term outlook will be turned bearish in this case.
In the bigger picture, USD/CAD should have defended 50% retracement of 0.9406 (2011 low) to 1.4689 (2016 high) at 1.2048. And with 1.2048 intact, we'd favor the case that fall from 1.4689 is a correction. Rise from 1.2061 medium term bottom should now target 38.2% retracement of 1.4689 to 1.2061 at 1.3065. Firm break there will target 1.3793 key resistance next (61.8% retracement at 1.3685). We'll now hold on to this bullish view as long as 1.2450 support holds.
Buy The Dip Or Sell The Rally?
U.S. stocks logged their fourth drop in the past five trading days, falling to a three-week low with the S&P 500 closing 1.25% below its record high on Nov 7. The sell-off yesterday was driven by the energy and consumer non-cyclical sector which fell 1.1% and 1% respectively, while Telecoms and financials managed to end in green. Even steeper selloffs were experienced in 2017, when the S&P 500 marched towards a new high In March, June, and August. The index fell 3.3%, 1.9%, and 2.8% respectively and every selloff was seen as an opportunity to buy the dips. Does this one look similar?
Price action and volatility does not reflect a serious threat yet. Despite the 50% surge in CBOE’s volatility index (VIX,) it is still trading well below August and April highs. The last time stocks fell by more than 10% back in January 2016 the VIX traded above 30. Today we are still below 15. Implied volatility in currency markets is also low, despite the recent selloff in the US dollar, and when looking at economic data, there doesn’t seem to be any serious threat to global growth, yet, investors should be cautious.
Spreads between U.S. 10-year note yields and 2-year notes declined to a new decade low of 63 basis points yesterday. Similarly, the spread between U.S. 10-year and 5-year notes fell below 30 basis points for the first time since 2007. While part of the flattening yield curve may be explained by tighter monetary policy expectations, which are pushing the front end of the curve higher, it still doesn’t provide clarification as to why the back end is falling. The bond market has been providing different signals to equities for a couple of months now. High-yield bonds have fallen more than 1% so far in November, and they are on track pace for the worst performance since early 2016. If investors were not worried, they wouldn’t be demanding greater compensation to own junk debt.
Given that the selling pressure on junk bonds sent yields to an attractive level of nearly 6%, it remains to be seen whether investors are willing to jump in. If the selloff resumes for the next couple of days, it will provide a signal that the correction in equity markets will be steeper. So, whether to buy the dips or continue selling the rally, will likely depend on how treasuries and junk bonds perform in the short run.
GBP/USD Candlesticks and Ichimoku Analysis
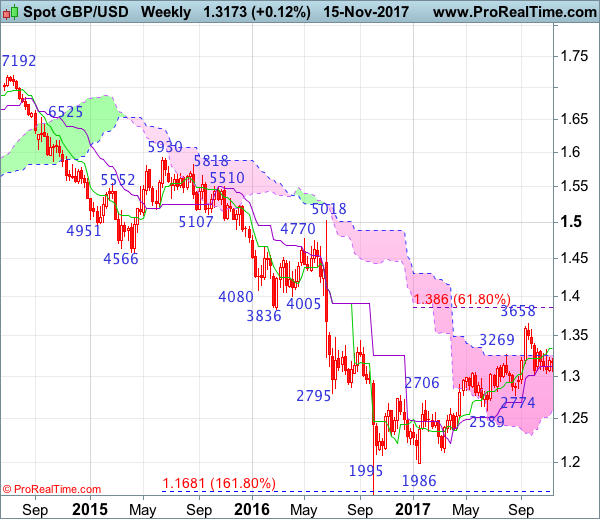
Weekly
• Last Candlesticks pattern: Shooting star
• Time of formation: 31 Jul 2017
• Trend bias: Down
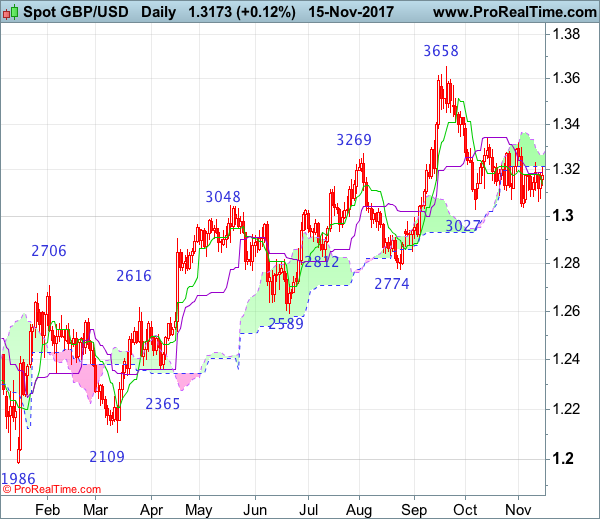
Daily
• Last Candlesticks pattern: Morning star
• Time of formation: 25 Aug 2017
• Trend bias: Near term up
GBP/USD – 1.3144
The British pound has remained confined within recent established range and further choppy trading is in store, although another corrective bounce to 1.3220-30 cannot be ruled out, outlook remains consolidative, reckon upside would be limited to 1.3285-90 and previous resistance at 1.3338 should hold from here, bring retreat later. Only a break of indicated previous resistance at 1.3338 would shift risk to the upside and signal another leg of rebound from 1.3027 is underway for gain to 1.3400, then test of previous resistance at 1.3455 which is likely to hold on first testing.
On the downside, whilst pullback to 1.3085-90 cannot be ruled out, reckon support at 1.3062 (this week’s low) would limit downside and indicated strong support area at 1.3027-39 should remain intact. In the event sterling is able to penetrate 1.3027-39 support area, this would shift risk back to downside and confirm the fall from 1.3658 top has resumed for further weakness to 1.3000, then towards 1.2940-50 later but minor support at 1.2852 would contain downside.
Recommendation: Stand aside for this week.
On the weekly chart, sterling continued trading inside familiar range in part due to cross-trading, hence further consolidation within 1.3062-1.3338 would take place and although recovery to 1.3230 cannot be ruled out, reckon said upper range would put a lid on cable and bring retreat later. A break above 1.3338 would suggest the retreat from 1.3658 has ended instead, bring a stronger rebound to 1.3400-05 and possibly towards 1.3490-00 but price should falter well below said resistance at 1.3658. In the event sterling breaks above 1.3571 resistance, this would bring a retest of this last month’s high at 1.3658, break there would extend recent erratic rise from 1.1986 low to 1.3750-60 and 1.3800 but overbought condition should prevent sharp move beyond 1.3860 (61.8% Fibonacci retracement of 1.5018-1.1986).
On the downside, expect pullback to be limited to 1.3075-85 and bring another rebound. Only a drop below indicated support area at 1.3027-39 would revive near term bearishness and signal a temporary top has been formed at 1.3658 earlier, bring retracement of recent rise to 1.3000, then towards support at 1.2909 but anticipated near term oversold condition should prevent sharp fall below previous chart support at 1.2774 and price should stay well above another previous chart support at 1.2589, bring rebound later.
Daily Technical Analysis: EURUSD, GBPUSD, USDJPY, USDCHF
EURUSD
The EURUSD attempted to push higher yesterday, slipped above the trend line resistance as you can see on my H1 chart below, topped at 1.1860 but whipsawed to the downside and closed lower at 1.1790 and hit 1.1768 earlier today in Asian session which could create a false breakout scenario. On daily chart, price printed a bearish pin bar suggests a potential bearish condition. The bias is bearish in nearest term testing 1.1725 – 1.1670 support area. Immediate resistance is seen around 1.1815. A clear break above that area could lead price to neutral zone in nearest term retesting 1.1860 but as long as stay below 1.1900 the “head and shoulders” bearish reversal scenario on daily chart should remain valid.
GBPUSD
The GBPUSD was indecisive yesterday. The bias remains neutral in nearest term. Immediate resistance is seen around 1.3230. A clear break and daily close above that area would expose 1.3330 key resistance which need to be clearly broken to the upside to resume the major bullish trend. Immediate support is seen around 1.3130. A clear break below that area could trigger further bearish pressure testing 1.3085 but as long as stay above 1.3000 I remain bullish and any downside pullback should be seen as a good opportunity to buy.
USDJPY
The USDJPY had a significant bearish momentum yesterday, broke below 113.20 support area. The bias is bearish in nearest term testing 112.00 – 111.65 as a part of the bearish pin bar scenario as you can see on my daily chart below. Immediate resistance is seen around 113.20. A clear break above that area could lead price to neutral zone in nearest term testing 113.50 or higher but key resistance remains at 114.50 which remains a good place to sell with a tight stop loss. Overall I remain neutral.
USDCHF
The USDCHF was indecisive yesterday. Price attempted to push lower bottomed at 0.9846 but closed higher at 0.9883. The bias is neutral in nearest term. Immediate support is seen around 0.9835. A clear break below that area could trigger further bearish pressure testing the daily EMA 200 located around 0.9800. Immediate resistance is seen around 0.9940. A clear break and daily close above that area would keep the major bullish trend alive and kicking retesting 1.0037 key resistance.
USD Rebounds Ahead Of Another Batch Of Economic Reports
- BoE Rate Hike Questioned as UK Data Disappoints;
- Retail Sales Set For First Annual Decline Since Early 2013;
- USD Rebounds Ahead of Another Batch of Economic Reports.
- European equity markets are expected to bounce back at the open on Thursday following a similar move in Asia overnight as traders eye more data from the UK and the US.
While the most important event impacting the pound over the last couple of days has arguably been taking place in parliament where MPs have been voting on hundreds of proposed changes to the Brexit bill, there has also been a lot of UK economic numbers being released and retail sales data for October will complete the hatrick this morning.
The data has become all the more important by the Bank of England’s decision to raise interest rates despite the economy slowing and facing significant headwinds over the coming years, a decision that has been criticised by many. As yet this week, the inflation and jobs data we’ve seen haven’t been particularly supportive of the decision, instead indicating the central bank may have been a little premature with the CPI numbers alone being below what the BOE anticipated.
Retail sales have been on a very clear downtrend since last year’s Brexit vote and today’s numbers are not expected to suggest this trend is changing. This creates further challenges for an economy that is extremely reliant on the consumer but at the same time is entirely unsurprising given the squeeze on real incomes as a result of the Brexit vote and the impact this typically has. A 0.6% year on year decline is expected which would be the first annual drop in spending in four and a half years, at which point the country was flirting with recession.
We’ll get plenty more economic data from the US again today, which follows Wednesday’s surprisingly upbeat inflation and retail sales figures, both of which supported the case for another rate hike in December. While this has rarely been in doubt and at this point is more than 90% priced in, there has long been concerns that the data is not improving as the Fed had hoped putting future rate increases at risk.
However, the recent bounce in spending and inflation – albeit not the Fed’s preferred measure – has helped and supported a stumbling dollar in the process. The greenback had been on a slippery slope the last week or so, potentially driven by the growing number of issues with the two tax reform bills now making their way through the House and the Senate, and yesterday’s data offered some decent reprieve.
With jobless claims, the Philly Fed manufacturing survey, industrial production and capacity utilisation data all being released today, the dollar will once again be in focus and another positive session may boost sentiment towards the otherwise stumbling greenback.
Trade Idea : USD/CHF – Sell at 0.9935
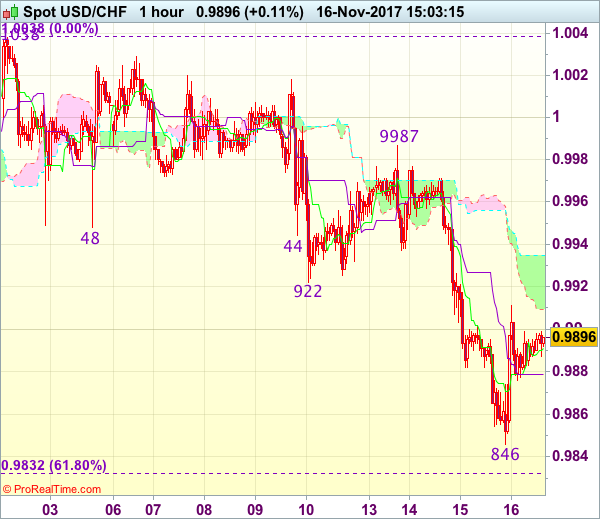
USD/CHF - 0.9903
Most recent candlesticks pattern : N/A
Trend : Near term down
Tenkan-Sen level : 0.9894
Kijun-Sen level : 0.9879
Ichimoku cloud top : 0.9935
Ichimoku cloud bottom : 0.9909
Original strategy :
Sell at 0.9920, Target: 0.9820, Stop: 0.9955
Position : -
Target : -
Stop : -
New strategy :
Sell at 0.9935, Target: 0.9835, Stop: 0.9970
Position : -
Target : -
Stop : -
As the greenback has rebounded after falling to 0.9846 yesterday, suggesting minor consolidation above this level would be seen and corrective bounce to previous support at 0.9922 (now resistance) cannot be ruled out, however, reckon the upper Kumo (now at 0.9935) would limit upside and bring another decline later, below said support at 0.9846 would signal the erratic decline from 1.0038 top is still in progress for at least a retracement of early upmove to previous resistance at 0.9837, break below there would encourage for subsequent decline towards 0.9795-00 which is likely to hold on first testing.
In view of this, we are looking to sell dollar on further subsequent recovery as 0.9922 (previous support) should limit upside. Above 0.9940-45 would defer and risk test of 0.9970-75 but price should alter below resistance at 0.9987, bring another decline later.