Sample Category Title
EUR/AUD Daily Outlook
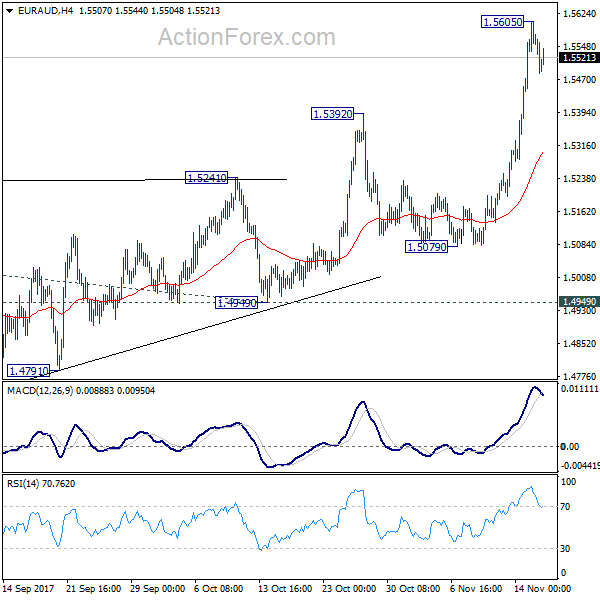
Daily Pivots: (S1) 1.5456; (P) 1.5530; (R1) 1.5611; More....
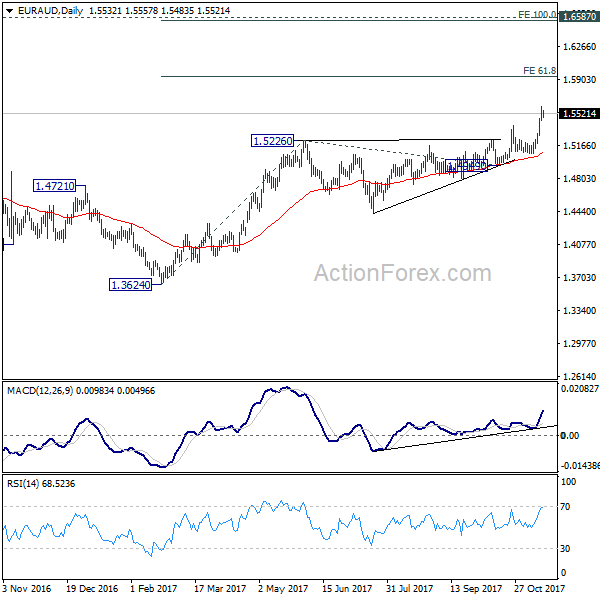
A temporary top is in place at 1.5605 and intraday bias in EUR/AUD is turned neutral first. Downside of retreat should be contained above 1.5226 resistance turned support to bring another rise. Medium term rally from 1.3624 is in progress. Above 1.5605 will target 61.8% projection of 1.3624 to 1.5226 from 1.4949 at 1.5939 first. Break will target 100% projection at 1.6551, which is close to 1.6587 key resistance.
In the bigger picture, we're holding on to the view that corrective decline from 1.6587 medium term top (2015 high) has completed at 1.3624. Rise from 1.3624 is expected to extend to retest 1.6587. We'll hold on to this bullish view as long as 1.5226 resistance turned support holds. Firm break of 1.6587 will resume long term rise from 1.1602 (2012 low).
Economic Data Hold Centre Stage
Economic data are back in the spotlight on Thursday, with reports from Europe and the United States scheduled to make headlines.
Action begins at 06:30 GMT with French unemployment data. France’s Q3 unemployment number is forecast to 9.7% in Q3 from 9.5% in the second quarter.
A few hours later, Italy will report its latest trade figures. Italy’s trade surplus is forecast to rise to €3.42 billion in September from €2.77 billion.
Shifting gears to the United Kingdom, retail sales will make headlines at 09:30 GMT. Receipts at retail stores are forecast to rise 0.1% in October following a 0.8% drop the previous month.
The European Commission will release the Eurozone CPI data at 10:00 GMT. The final print is expected to show a reading of 1.4% year-over-year.
In North America, the US Commerce Department will report on initial jobless claims for the week ended 10 November. The weekly report is expected to show a decline of 4,000 to a seasonally adjusted 235,000.
Earlier in the day, the Australian government reported a much smaller than expected gain in job creation last month. The Australian economy added just 3,700 jobs in October, well below forecasts calling for 17,500. However, the entirety of the gains came in full-time positions.
Government economists also reported a slight drop in unemployment as workforce participation fell to 65.1% from 65.2%.
Meanwhile, the Melbourne Institute said 12-month inflation expectations weakened to 3.7% from 4.3% previously.
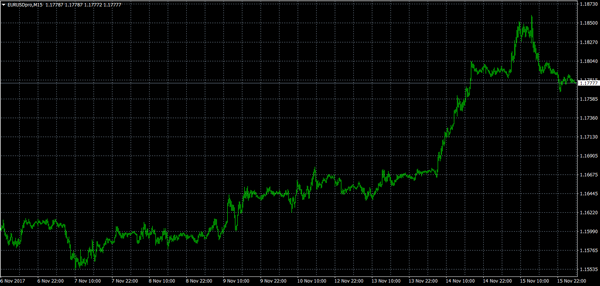
EUR/USD
The euro traded within a narrow range against the dollar on Thursday after failing to sustain upside north of 1.1800. The EUR/USD was last seen trading at 1.1779, having gained around 0.1%. The pair is eyeing immediate resistance at 1.1850. A rally above that level would lead to a re-test of the 1.1886 level. On the flipside, immediate support is located near the 1.1740 region.
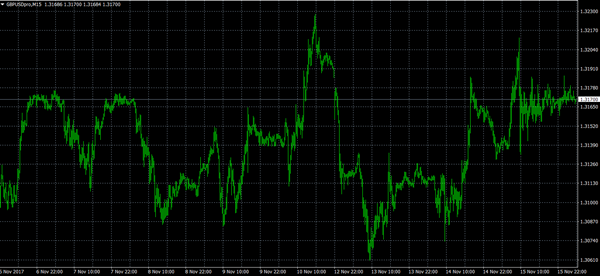
GBP/USD
Cable has shifted into higher gear this week, with prices fast approaching 1.3200. GBP/USD was last seen trading at 1.3170, where it was little changed compared to the previous close. The technical picture shows immediate resistance near 1.1385, followed by the psychological 1.3200 barrier. On the opposite side of the spectrum, support is likely to be found at 1.13115, followed by 1.3075.
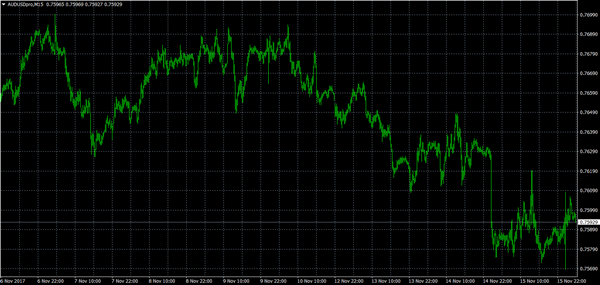
AUD/USD
The Australian dollar held its ground after Thursday’s early morning data releases. The AUD/USD exchange rate edged up 0.1% to 0.7597. When it comes to the short-term technical indicators, the Aussie faces immediate resistance at 0.7607, which corresponds with the 50-MA on the one-hour chart. A clean break above this level would expose the 0.760 region as the next target. On the opposite side of the ledger, immediate support is located at the session low of 0.7567.
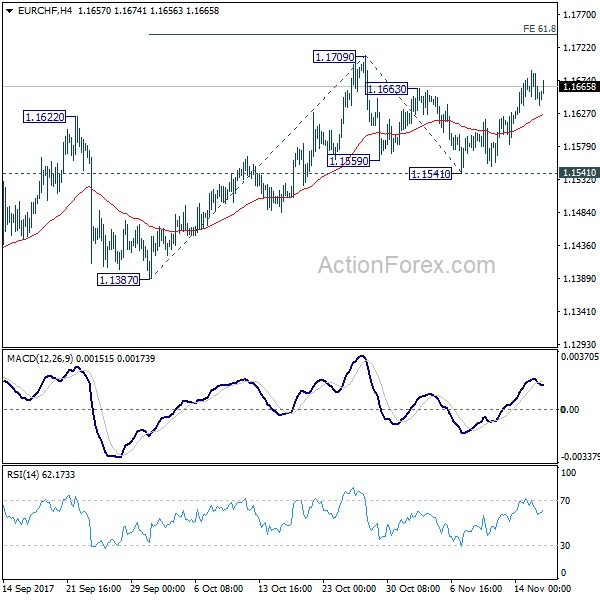
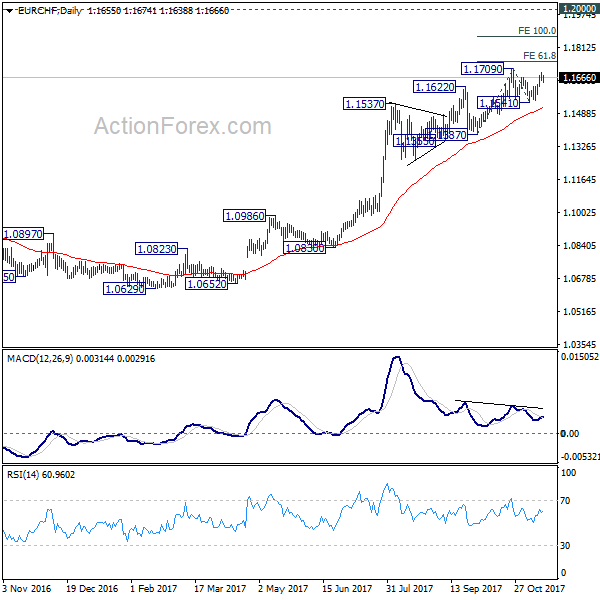
EUR/CHF Daily Outlook
Daily Pivots: (S1) 1.1638; (P) 1.1663; (R1) 1.1679; More...
Intraday bias in EUR/CHF remains on the upside for 1.1709 resistance. Break will resume medium term rally and target 61.8% projection of 1.1387 to 1.1709 from 1.1541 at 1.1740 first, and then 100% projection at 1.1863. For now, this will be the favored case as long as 1.1541 support holds.
In the bigger picture, long term rise from SNB spike low back in 2015 is still in progress. EUR/CHF should now be heading back to prior SNB imposed floor at 1.2000. For now, this will be the favored case as long as 1.1355 support holds. However, break of 1.1355 will indicate medium term topping. In that case, EUR/CHF should head back to 55 week EMA (now at 1.1105) and possibly below.
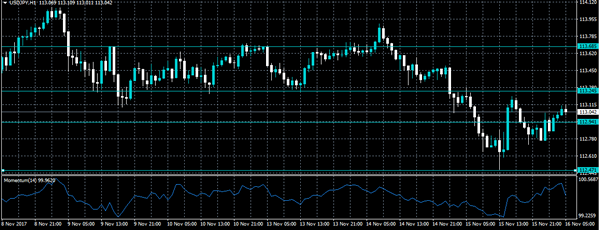
USDJPY Intraday Bullish Above 112.94 Level
The U.S dollar has recovered some of its steep early-week trading losses against the Japanese yen, after improved U.S macroeconomic data, and an overall shift in trading sentiment. The USDJPY pair has moved price-action back above the key 113 level, after finding support at the 112.47 level on Wednesday. Traders now look to global stock markets, and the U.S dollar index's reaction to today's crucial vote in the U.S Senate, which centers around the Trump administrations proposed U.S tax reforms.
The USDJPY pair remains intraday bullish while holding above the 112.94 technical level. Further upside towards the 113.24 and 113.68 appears likely.
Should price-action on the USDJPY pair decline below the 112.94 technical level, further losses towards the 112.47 and 111.90 levels seems possible.
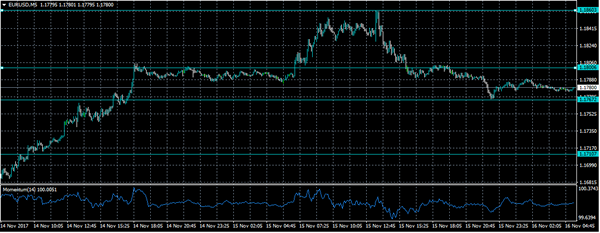
EURO Intraday Bearish Below 1.1800
The euro has declined against the U.S dollar, touching 1.1767, as global stocks and the U.S dollar index start to recover after better U.S data and political news. The EURUSD pair currently trades around the 1.1780 level, after previously trading as high as 1.1860 on Wednesday. Traders now look to key CPI inflation data from the eurozone economy, and the crucial U.S tax plan reform vote, which is being held in U.S Senate late on Thursday evening.
The EURUSD pair remains intraday bearish while trading below the 1.1800 technical level. Further declines towards the 1.1767 and 1.1710 appear likely while price-action trades below the 1.1800 level.
Should price-action move back above the 1.1800 level, further upside towards the 1.1860 and 1.1910 levels remains likely.
Trade Idea: GBP/USD – Stand aside
GBP/USD – 1.3150
Original strategy :
Sold at 1.3170, stopped at 1.3190
Position: - Short at 1.3170
Target: -
Stop: - 1.3190
New strategy :
Stand aside
Position: -
Target: -
Stop:-
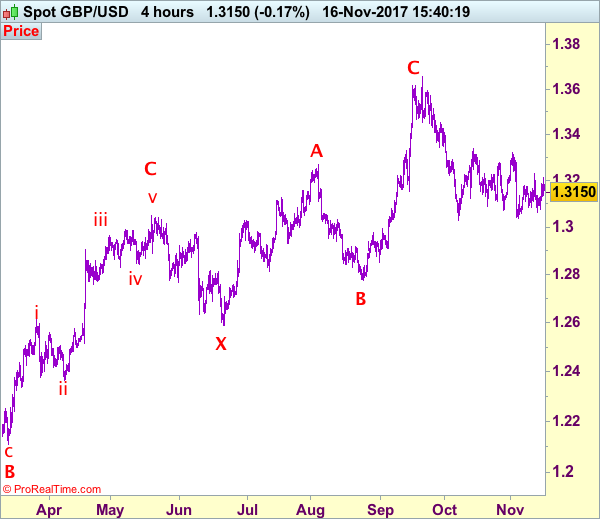
Although cable rebounded again yesterday to 1.3214, as price has retreated again after faltering below indicated resistance at 1.3230, retaining our view that further consolidation would be seen and weakness to 1.3100 cannot be ruled out, however, support at 1.3062 would hold and price should stay above previous support at 1.3039, bring another rebound later. A break of previous support at 1.3027 is needed to confirm the aforesaid decline from 1.3658 top has resumed for weakness to psychological support at 1.3000, break there would encourage for subsequent decline towards 1.2950-60.
On the upside, only above said resistance at 1.3230 would defer and prolong choppy consolidation, risk rebound to 1.3250-60 but resistance at 1.3299 should limit upside and price should falter below last week’s high at 1.3321, bring another retreat later. Our preferred count is that (pls see the attached chart) the wave IV is unfolding as a complex double three (ABC-X-ABC) correction with 2nd wave B ended at 1.2774, hence 2nd wave C could have ended at 1.3658.
Our preferred count on the daily chart is that cable's rebound from 1.3500 (wave (A) trough) is unfolding as a wave (B) with A ended at 1.7043, followed by triangle wave B and wave C as well as wave (B) has ended at 1.7192, the subsequent selloff is the larger degree wave (C) which is still unfolding with minor wave (III) of larger degree wave 3 ended at 1.1986, hence wave (IV) correction is in progress which could either be a triangle wave (IV) of a complex formation but upside should be limited to 1.3500 and price should falter well below 1.4000, bring another decline in wave (V) of 3 for weakness to 1.1500, then 1.1200.
Gold Price Signaling Bullish Continuation Above $1280 Vs US Dollar
Key Highlights
- Gold price started an upside correction from the $1265 swing low against the US Dollar.
- There is a crucial ascending channel forming with support near $1274 on the 4-hours chart of XAU/USD.
- The US Consumer Price Index in Oct 2017 increased 2% (YoY), similar to the market forecast.
- Today, the US Industrial Production for Oct 2017 will be released, which is forecasted to increase by 0.5% (MoM).
Gold Price Technical Analysis
Gold price has started a decent uptrend from the $1270 low against the US Dollar. It has to move above $1290 and $1300 level to gain further momentum.
Looking at the 4-hours chart of XAU/USD, there is a crucial ascending channel forming with support near $1274. The price is currently above the 100 simple moving average (red, 4-hour) and $1276, which is a positive sign.
A successful close above the channel resistance at $1290 would open the doors for more gains toward $1300 and $1310 in the near term.
On the downside, important support can be seen at $1280 and $1274. The 4-hour RSI is just below the 50 level and signaling a neutral bias in the short term for gold price as long as it stays above $1274.
US Consumer Price Index
Recently in the US, the Consumer Price Index for Oct 2017 was released by the US Bureau of Labor Statistics. The forecast was lined up for the CPI to increase by 2% compared with the same month a year ago.
The actual result in line with the forecast since Oct’s CPI was +2%. Looking at the monthly change, there was a rise of 0.1% in the CPI, similar to the forecast. On the other hand, the Consumer Price Index Ex Food & Energy in Oct 2017 rose 1.8% (YoY), more than the forecast of +1.7%.
The report added:
The shelter index increased 0.3 percent and was the main factor in the seasonally adjusted all items increase. The energy index fell, as a decline in the gasoline index outweighed increases in other energy component indexes. The food index was unchanged over the month.
Overall, the result was neutral, which increases the risk of more gains in gold price above $1290 in the near term.
Economic Releases to Watch Today
UK Retail Sales for Oct 2017 (YoY) – Forecast -0.6%, versus +1.2% previous.
UK Retail Sales for Oct 2017 (MoM) – Forecast +0.1%, versus -0.8% previous.
Euro Zone CPI for Oct 2017 (YoY) – Forecast +1.4%, versus +1.4% previous.
Euro Zone CPI for Oct 2017 (MoM) – Forecast +0.1%, versus +0.4% previous.
US Industrial Production Oct 2017 (MoM) – Forecast +0.5%, versus +0.3% previous.
US Capacity Utilization Oct 2017 – Forecast 76.3%, versus 76.0% previous.
EUR/USD Daily Outlook
Daily Pivots: (S1) 1.1763; (P) 1.1811 (R1) 1.1839; More...
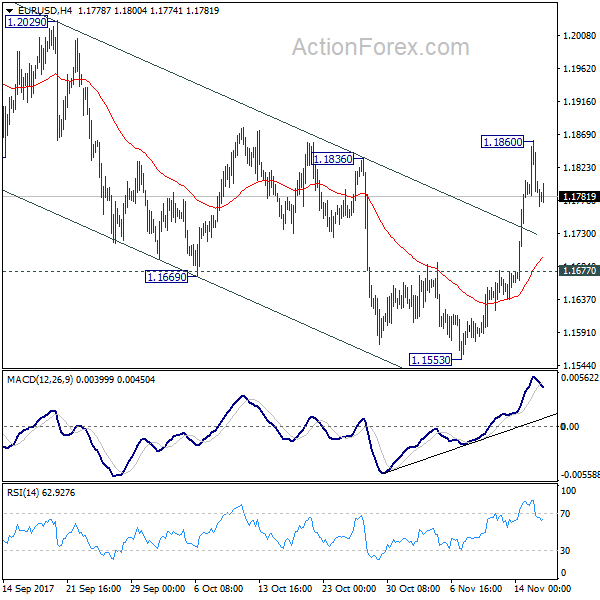
A temporary top is in place at 1.1860 in EUR/USD and intraday bias is turned neutral first. Outlook is unchanged that correction from 1.2091 has completed at 1.1553 already. Further rise is expected. Above 1.1860 will target 1.2091 high. However, break of 1.1677 support will turn focus back to 1.1553 low instead.
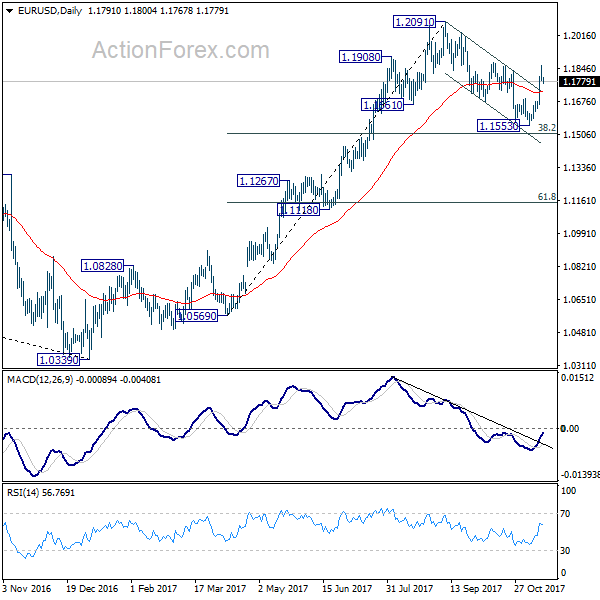
In the bigger picture, rise from 1.0339 medium term bottom is seen as a corrective move for the moment. Therefore, in case of another rally, we'd be cautious on 38.2% retracement of 1.6039 (2008 high) to 1.0339 (2017 low) at 1.2516 to limit upside and bring reversal. Meanwhile, sustained trading below 55 week EMA (now at 1.1346) will suggest that such medium term rebound is completed and could then bring retest of 1.0339 low.
GBP/USD Daily Outlook
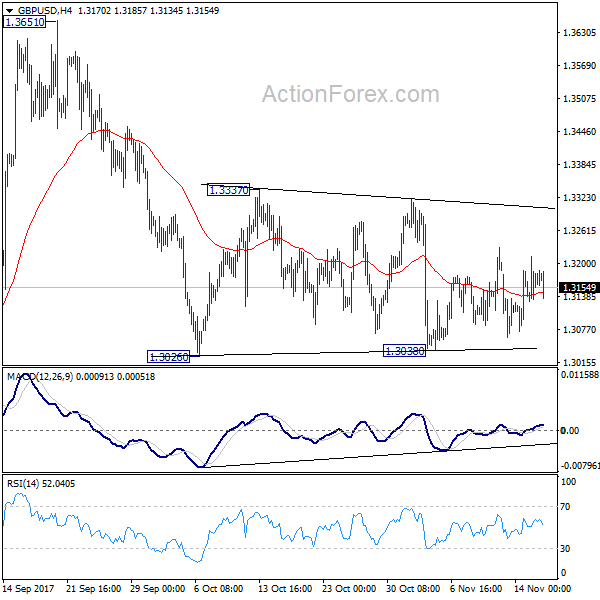
Daily Pivots: (S1) 1.3127; (P) 1.3171; (R1) 1.3212; More....
Intraday bias in GBP/USD remains neutral as it's still bounded in range of 1.3038/3337. In case of another recovery, upside should be limited below 1.3337 resistance to bring fall resumption. Break of 1.3038 will now resume decline from 1.3651 to 1.2773 key support level. However, decisive break of 1.3337 will indicate that pull back from 1.3651 is completed and medium term rise from 1.1946 is resuming.
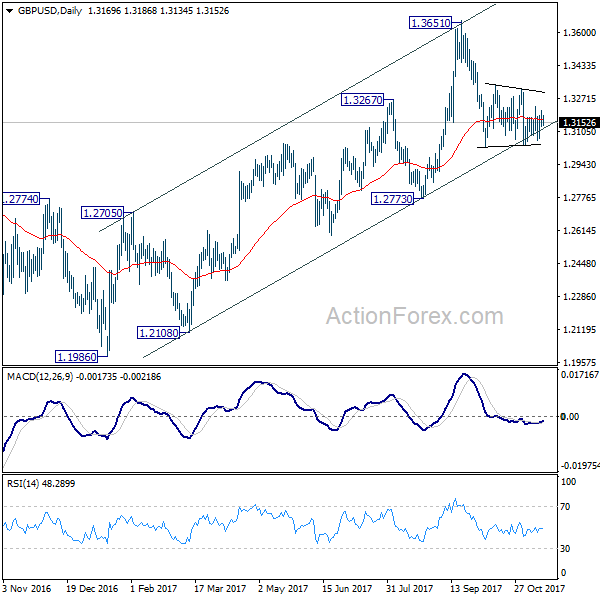
In the bigger picture, as noted before, GBP/USD hit strong resistance from the long term falling trend line. Current development is starting to favor that corrective rebound from 1.1946 low has completed at 1.3651. Decisive break of 1.2773 will confirm this bearish case and target a test on 1.1946 low next, with prospect of resuming the low term down trend. Nonetheless, break of 1.3320 resistance will restore the rise from 1.1946 for 38.2% retracement of 2.1161 (2007 high) to 1.1946 (2016 low) at 1.5466.
USD/CHF Daily Outlook
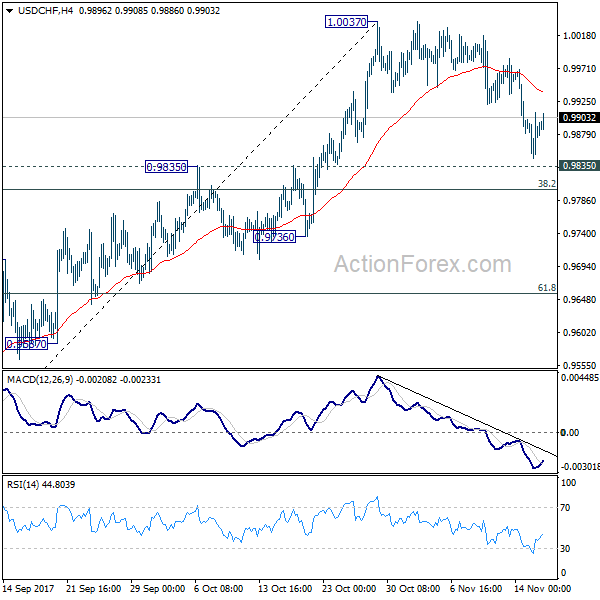
Daily Pivots: (S1) 0.9850; (P) 0.9881; (R1) 0.9915; More....
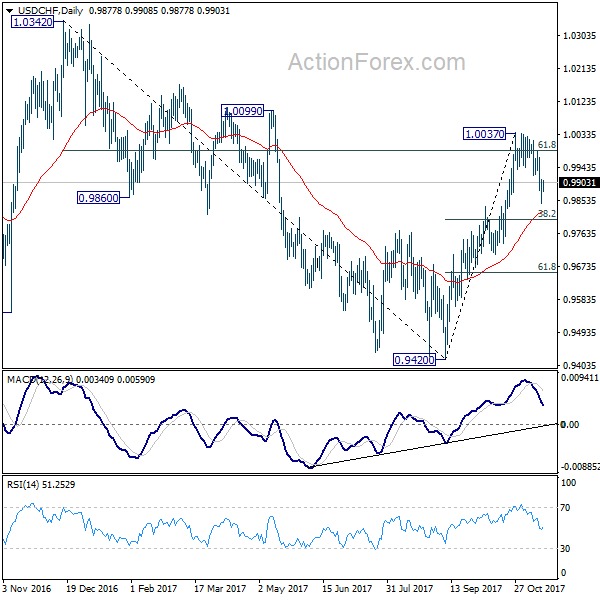
Focus remains on 0.9835 resistance turned support in USD/CHF. Decisive break there will argue that whole rebound form 0.9420 is completed and turn outlook bearish. In that case, USD/CHF should target 61.8% retracement of 0.9420 to 1.0037 at 0.9565 and possibly below. Nonetheless strong rebound from 0.9835 will retain near term bullishness. And, break of 1.0047 will extend the rise from 0.9420 and target 1.0342 high.
In the bigger picture, current development suggests that USD/CHF has defended 0.9443 (2016 low) key support level again. Rise from 0.9420 could is a medium term up move and should target a test on 1.0342 high. This represents the upper end of a long term range that started back in 2015. On the downside, break of 0.9736 support is now needed to indicate completion of the rise from 0.9420. Otherwise, further rally will remain in favor in medium term.