Sample Category Title
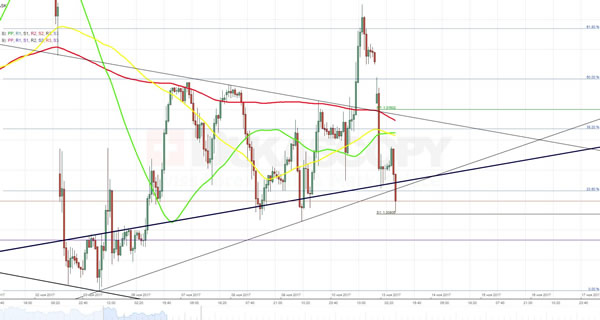
GBP/USD Analysis: Spikes To 1.3230 But Then Drops
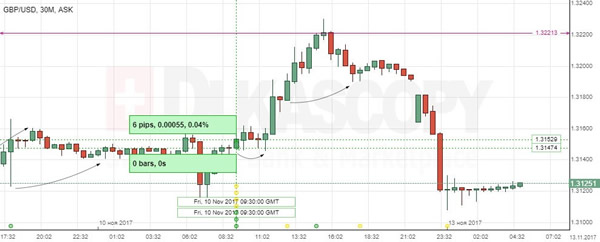
A release of better than expected growth rate of the UK Manufacturing Production created an upside momentum that enabled the pair to return back to the 1.3228 level. However, then fears of growing political risk in Britain and Trump’s participation in the ASEAN summit strengthen the buck and dragged the exchange rate to support area near the 1.3120 mark. On the one hand, the further road to the bottom is obstructed by the lower support line and the 23.6% Fibonacci retracement level. However, if the current bearish pressure continues this barrier may not sustain. In that case, the cable is going to test the next support zone lying around the weekly S1 at 1.3090. It should be noted that recovery of the Pound also looks unlikely, due to pressure from the falling 55-, 100- and 200-hour SMAs.
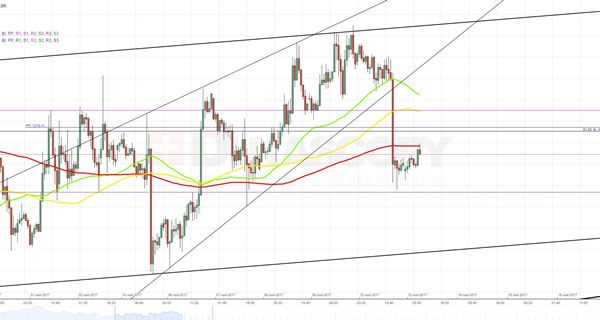
USD/JPY Analysis: Trades In Descending Channel
During previous trading session the currency exchange rate expectedly approached and made a rebound from the upper-boundary of the current descending channel. As a result, now the pair is expected to continue moving to the bottom. This direction is also supported by the fact that the 55- and 100-hour SMAs are located above the current market price. Nevertheless, deprecation of the Yen might be hampered if bears fail to push the pair through the monthly PP at 113.25. In addition to that, there is a need to take into account existence of a junior ascending channel that formed as a part of the larger pattern and might also obstruct the further plunge. Finally, some volatility in the markets might also be caused by a speech that will be delivered by BOJ Governor Kuroda at the University of Zurich.
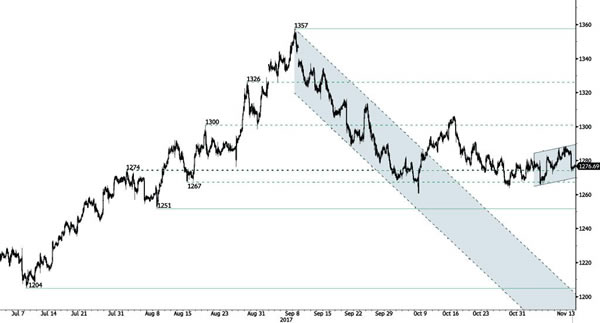
XAU/USD Analysis: Falls By 1.1%
The exchange rate dropped by almost 1.1% on Friday in result of 10 minutes trade that moved about 4 million ounces of the precious metal. Nevertheless, the drop was generally anticipated, as it illustrated a breakout from the rising wedge formation on daily chart. In any case, there are two main options for further movement of the pair. As majority of traders remain bullish on the pair, they might try to elevate it to the pre-fall 1,283.90 level. However, the fact road to the north is obstructed by the weekly PP and the 200-hour SMA as well as the 61.8% retracement level and the monthly PP, the pair is likely to form either a flag or pennant pattern and then resume the downfall. Such scenario would also be in line with trade pattern theory.
GBP/USD: UK Manufacturing Production M/M
The stronger-than-anticipated report on the UK manufacturing production resulted in a modest increase of the British Pound. The GBP/USD exchange rate added 6 base points and moved higher to be seen trading near the weekly high of 1.3221. However, the pair returned to the 1.320 area to reveal a narrow-range side move on early Monday.
The Office for National Statistics said that the UK manufacturing and industrial output both rose 0.7% over the course of September, where each sector revealed the fastest growth pace since last year’s December. However, a sharp decrease in construction and lingering squeeze on British households' incomes indicated that the UK economy would face difficulties as Brexit approaches.
Technical Outlook: Spot Gold Trims Losses On Monday, Eyes US Data Scheduled This Week
Spot Gold bounced on Monday after strong fall on Friday, rallying from dangerous territory at $1273 (Friday’s low / Fibo 61.8% of $1263/$1288 upleg.
The yellow metal is focusing on key events scheduled this week: US inflation and retail sales and speeches from top Fed officials which are expected to give more signals about US monetary policy ahead FOMC policy meeting in December.
Gold is sensitive on changes in US interest rates and looks more clues about the likely trajectory of the US monetary policy, as markets widely expect another rate hike by the end of the year.
Daily techs are bearishly aligned, but today’s recovery which attempts above converged 10 / 20 / 100SMA’s would ease prevailing downside risk on sustained break higher.
Lift above $1280 is needed to re-expose pivotal barriers at $1288/90 (Friday’s high / Fibo 61.8% of $1306/$1263 downleg).
On the other side, stronger bearish signal could be expected on repeated violation of $1273 pivot, loss of which will be bearish.
Res: 1280, 1284, 1290, 1296
Sup: 1277, 1273, 1266, 1263
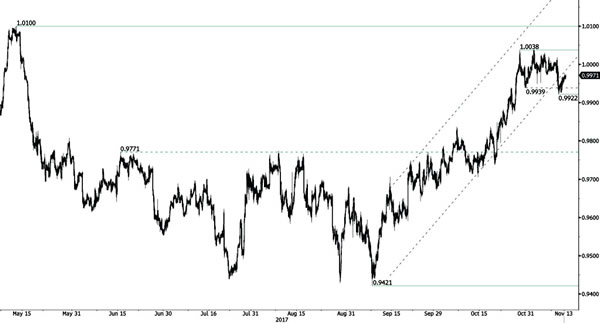
CRUDE OIL Continued Consolidation
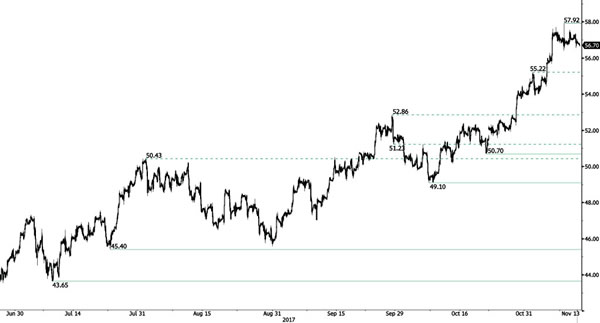
Crude Oil is consolidating after the commodity set up resistance at 57.92 (08/11/2017 high). The commodity is trading at 1-year high. Expected to show further shot-term bearish consolidation. Indeed the technical structure has a history of decent consolidation phase.
In the long-term, crude oil has recovered after its sharp decline last year. However, we consider that further weakness are very likely. For the time being the pair lies in an upside momentum. Strong support lies at 35.24 (05/04/2016) while resistance can now be found at 55.24 (03/01/2017 high).
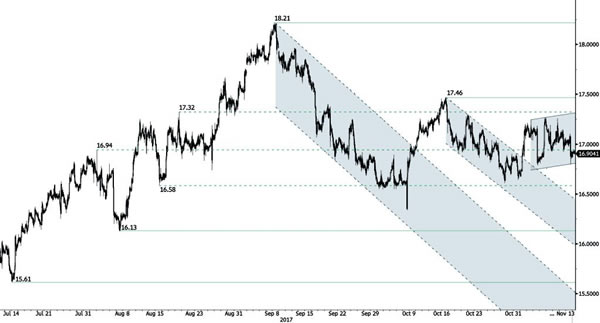
SILVER Edging Lower
Silver is heading lower. Hourly support can be found at 16.60 (27/10/2017 low). Hourly resistance is given at 17.46 (13/10/2017 high). Additional support can be found at 16.13 (06/10/2017 low).
In the long-term, the trend is rater negative. Further downsides are very likely. Resistance is located at 25.11 (28/08/2013 high). Strong support can be found at 11.75 (20/04/2009).
GOLD Bullish Pressures
Gold is pushing higher. The technical structure confirms the end of the consolidation phase. Support lies at a distance at 1251 (08/08/2017 high). Resistance is now located at 1288 (20/10/2017).
In the long-term, the technical structure suggests that there is a growing upside momentum. A break of 1392 (17/03/2014) is necessary ton confirm it, A major support can be found at 1045 (05/02/2010 low).
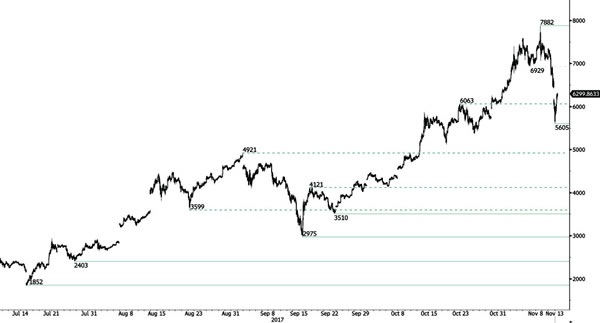
BITCOIN Collapsing
Bitcoin is now consolidating after recent surge. The technical structure shows a tremendous positive short-term momentum. Hourly support is now located at 5605 (13/11/2017 low). Strong support stands very far at 2975 (22/08/2017 low). In the short-term, the digital currency should continue rising.
In the long-term, the digital currency has had an exponential growth. There are decent likelihood that the asset will reach $10'000.
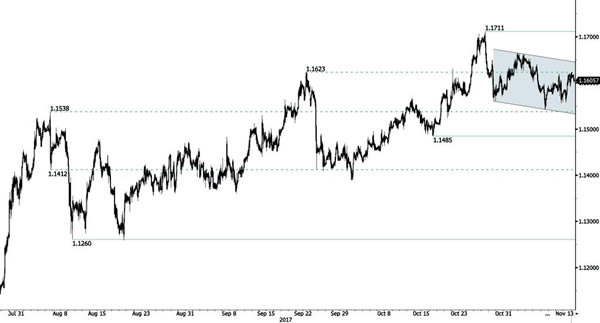
EUR/CHF Slight Weakness
EUR/CHF is riding downtrend channel. Support is given at 1.1610 (27/10/2017 low). Rising channel suggests further bullish momentum.
In the longer term, the technical structure has reversed. Strong resistance is given at 1.20 (level before the unpeg). Yet, the ECB's QE programme is likely to cause persistent selling pressures on the euro, which should weigh on EUR/CHF. Supports can be found at 1.0184 (28/01/2015 low) and 1.0082 (27/01/2015 low).