
Sample Category Title
Dollar Mixed Amid A Slow Trading Day
The US dollar was seen trading mixed earlier on Monday. Last week, investors grew wary of the proposed tax reforms plans which are expected to be delayed. On the economic front, the calendar was also quiet with only the UK's manufacturing, construction, and industrial output data.
Looking ahead, the economic calendar is quiet today with only BoJ's Kuroda expected to speak later in the evening. The German WPI data is due to come out earlier in the day with forecasts showing that wholesale price index rose 0.4% on the month, rising at a slower pace than the previous month.
EUR/USD Elliott Wave Analysis
EUR/USD – 1.1639
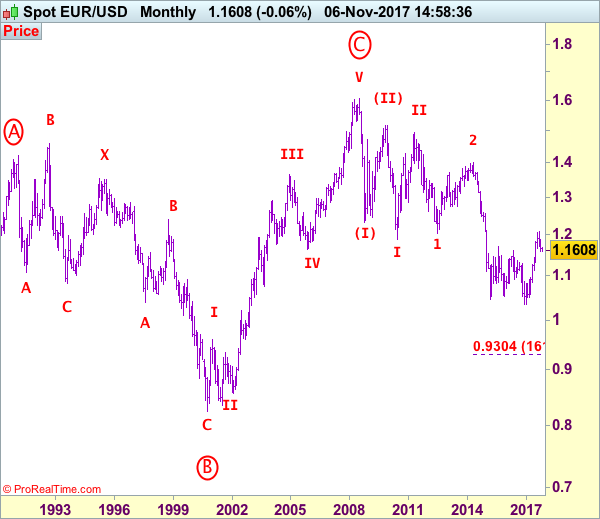
EUR/USD: Wave (c) of 2 ended at 1.3993 and wave 3 of III has commenced for weakness to 1.0411 (1.236 of wave 1), then 1.0000.
The single currency found support at 1.1554 early last week and has rebounded, suggesting consolidation above this level would be seen and corrective bounce to 1.1691 resistance cannot be ruled out, however, still reckon previous support at 1.1725 would cap upside and bring another decline later, below said support at 1.1554 would signal the fall from 1.2093 top is still in progress for retracement of recent upmove to 1.1510-15 (38.2% Fibonacci retracement of 1.0570-1.2093) but reckon downside would be limited to support at 1.1479 and 1.1330-35 (50% Fibonacci retracement) should remain intact, bring rebound later.
Our preferred count on the daily chart remains that a wave (II) from 1.2329 ended at 1.5145 with A-leg ended at 1.4720, followed by wave B at 1.2457, the wave C from there was also a 3 legged move and is labeled as (a): 1.3739, (b): 1.2885, the wave iii of the 5-waver (c) from 1.2885 has ended at 1.4339 and wave iv is a triangle ended at 1.3878 and wave v formed a top at 1.5145. The decline from there is a 5-waver (C) with minor wave (i) of I of (C) ended at 1.4218 with wave (ii) ended at 1.4580, wave (iii) ended at 1.3267 and wave (iv) ended at 1.3692 and wave (v) ended at 1.1876, this is also the low of wave I of (C) and wave II ended at 1.4940, hence wave III is now in progress with a diagonal wave 1 ended at 1.2042, the breach of previous support at 1.1876 (wave I trough) adds credence to our view that the wave 2 has ended at 1.3993, wave 3 has commenced for further weakness to 1.0411, then towards 1.0000.
On the upside, expect recovery to be limited to said resistance at 1.1691 and bring another decline. Only above previous support at 1.1725 would defer and suggest low is possibly formed instead, bring rebound to 1.1790-00 but break of said resistance at 1.1837 is needed to confirm and bring test of key resistance at 1.1880. Looking ahead, only break of 1.1880 resistance would suggest the pullback from 1.2093 has ended, bring further gain to 1.1950-60, then towards 1.2000-05. A break of resistance at 1.2034 would confirm and bring retest of 1.2093, break there would signal recent upmove from 1.0340 low has resumed for headway to 1.2150-55 (61.8% projection of 1.1119-1.1910 measuring from 1.1662), having said that, loss of upward momentum should prevent sharp move beyond 1.2200-10 and price should falter below 1.2255-60, risk from there remains for a much-needed correction to take place later.
Recommendation: Hold short entered at 1.1665 for 1.1465 with stop above 1.1735.

Euro's long-term uptrend started from 0.8228 (26 Oct 2000) with an impulsive structure. The rise from 0.8228 to 0.9593 (5 Jan 2001) is labeled as wave I, the retreat to 0.8352 (6 Jul 2001) is wave II and the rally to 1.3670 (31 Dec 2004) is wave III. Wave IV from there ended at 1.1640 (15 Nov 2005), the subsequent upmove to 1.6040 (July 15, 2008) is treated as wave V, the major selloff from the record high of 1.6040 to 1.2329 (October 27, 2008) signals a reversal has taken place with (I) leg ended at 1.2329 and once (II) ended at 1.5145, wave (III) itself is an extended move with I: 1.1876 and complex wave II ended at 1.4902, wave III has commenced with wave 1 and 2 ended at 1.2042 and 1.3993 respectively, wave 3 of III is now unfolding for weakness towards parity.
Trade Idea: EUR/JPY – Stand aside
EUR/JPY - 132.13
Original strategy:
Sold at 132.70, stopped profit at 132.30
Position: - Short at 132.70
Target: -
Stop: - 132.30
New strategy :
Stand aside
Position: -
Target: -
Stop:-
Although the single currency edged higher to 132.60 earlier today, lack of follow through buying and current retreat suggest further consolidation would take place and weakness to 131.60-70 cannot be ruled out, however, break of last week’s low at 131.40 is needed to revive bearishness and extend recent decline from 134.50 top for a correction of early upmove to 131.00, then towards 130.50-60.
In view of this, we are looking to reinstate short on subsequent recovery. Above 132.60-70 would bring recovery towards resistance at 133.12, break there would suggest first leg of corrective decline from 134.50 top has ended, risk a stronger rebound to 133.50-60 but still reckon upside would be limited to 133.95-00, price should falter well below said recent high at 134.50, bring another selloff later.
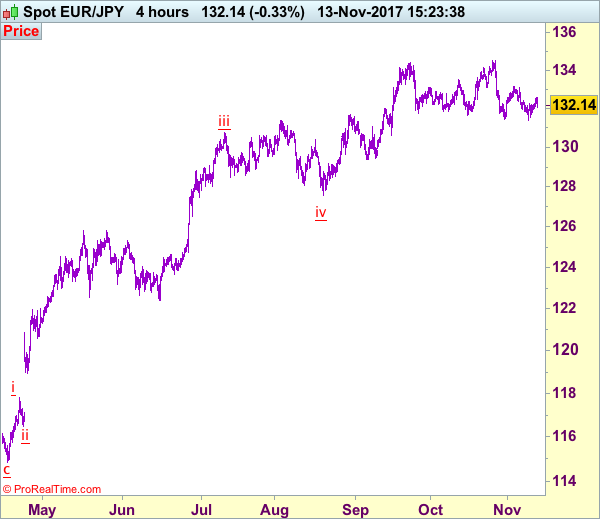
Our latest preferred count is that wave (ii) is ABC-X-ABC which ended at 123.33 and wave (iii) is unfolding with wave iii ended at 100.77, followed by wave iv at 111.57 and wave v as well as the wave (iii) has ended at 97.04, followed by wave (iv) at 111.43 and wave (v) has ended at 94.12 which is also the end of the larger degree v, this also implied the major wave (C) has also ended there, hence major correction has commenced from there with (A) leg unfolding in its lower degree wave c which has possibly ended at 145.69. Under this count, A-B-C wave (B) has commenced with A leg ended at 136.23, wave B at 143.79 and wave C has possibly ended at 149.79.
Our larger degree count is that the decline from 139.26 is wave (C) and is sub-divided into a diagonal triangle i-ii-iii-iv-v with wave i - 105.44, wave ii- 123.33, wave iii - 97.03, wave iv - 111.43, followed by the final wave v as well as the end of wave (C) at 94.12, this also mark the bottom of larger degree wave B. Under this count, major rise in wave C has commenced as an impulsive wave with minor wave III ended at 145.69, wave V is still in progress for further gain to 150.00. Having said that, this so-called wave V could well be the first leg of larger degree 5-waver wave C and this wave C should bring at least a retest of wave A top at 169.97 (July 2008).
EURUSD Maintains A Neutral Bias In 2-Week Range
EURUSD maintains a neutral bias in the short term and has not changed much since entering a range two weeks ago. The market is showing signs of stabilization as the sell-off has slowed somewhat over the past couple of weeks.
There has been a lack of a trend following a break below the neckline (1.1600) of the head and shoulders pattern on the daily chart. EURUSD did not sustain losses below 1.1553 but has been unable to re-test the range high at 1.1690 that was hit on November 3, resulting in a consolidation phase.
A decisive break above 1.1600 should see EURUSD gain momentum quickly towards the upper 1.1700 area. The 50-day moving average is expected to act as dynamic resistance. Prices would need to rise above 1.1875 in order for the bearish phase from the 1.2091 peak to weaken and to shift the market’s focus back to the upside.
A drop below 1.1553 would increase downside pressure and open the way to 1.1470. This level is roughly the mid-point of the upleg from 1.0820 to 1.2091. A deeper decline would target 1.1300, which is the 61.8% Fibonacci retracement level.
The bias is expected to remain neutral in the short term. This view is supported by the RSI which is lacking clear direction. In the bigger picture, the upside trajectory of EURUSD has lost traction but as long as the market remains above its 200-day MA, a reversal of the longer-term uptrend doesn’t look that likely.
Currencies: Dollar To Trade Cautiously Ahead Of Key Eco Data
Sunrise Market Commentary
- Rates: Side-lined ahead of central bankers and US eco data?
Today's eco calendar remains uninspiring. We expect trading to be sentiment-driven and technical in nature. The downward equity correction hasn't run its course yet, but failed to support core bonds last week. Investors might decide to stay sidelined ahead of key US eco data later this week and with an avalanche of central bankers scheduled to speak - Currencies: Dollar to trade cautiously ahead of key eco data
At the end of last week, the dollar couldn't profit even as core bond yields maintained an upward bias. US traders look out for the key US eco data later this week, including CPI and retail sales. Soft data won't derail a Fed rate hike, but might still weigh on the USD. Sterling is again under pressure as Conservative PM's are said to challenge PM May's leadership
The Sunrise Headlines
- US stock markets closed marginally lower on Friday in an uneventful trading session. Asian stock markets are mixed overnight with Japan underperforming and China outperforming.
- Sterling loses ground this morning after reports that a group of Conservative lawmakers had agreed to sign a letter of no-confidence in British PM May.
- Political turmoil in Australia risks undermining fragile economic confidence as the loss of another lawmaker in the dual-citizenship fiasco left PM Turnbull leading a minority government.
- Philly Fed Harker, voting FOMC member, said he's looking for another rate increase this year and that he is comfortable with three hikes in 2018 if inflation picks up.
- German political parties grappling to form a government have set a deadline of Thursday to produce an agreement that will pave the way for formal coalition talks.
- The head of the House Republicans' tax-writing committee said he would not accept elimination of a federal deduction for state and local taxes, opposing a proposal from Senate Republicans that would hike taxes for some middle class Americans.
- Today's eco calendar is empty. Italy holds a BTP auction while ECB Constancio and Nowotny are scheduled to speak
Currencies: Dollar To Trade Cautiously Ahead Of Key Eco Data
USD to trade cautiously ahead of key US eco data
Global markets calmed down on Friday after Thursday's uptick in volatility. There were only second tier eco data. Changes in interest rate differentials were very small. If anything they widened marginally in favour of the dollar, but the US currency remained slightly in the defensive. EUR/USD remained within the established short-term trading range. The pair closed the session at 1.1665 (from 1.1642). USD/JPY finished the day little changed at 113.53.
Asian equities are trading mixed overnight. Chinese indices outperform. Most other indices show small losses with Japan again underperforming. The risk-off sentiment in Japan doesn't yield to any sustained gains for the yen. USD/JPY still trades in the mid 113 area. The dollar was slightly better bid early in the session, but there is no clear trend. EUR/USD trades in the 1.1650 area. The Aussie dollar took a hesitant start as PM Turnbull's government lost its majority, but AUD/USD soon returned to the mid 0.76 area.
Today, there are not important data in the EMU or in the US. ECB's Constancio and Nowotny are scheduled to speak, but we don't expect their appearances to have a big impact on (FX) markets. So, global sentiment and technical considerations will set the tone for euro and USD trading today.
Equities show no clear trend. Last week, core bond yields maintained an upward bias despite an up-tick in volatility on the equity markets. In the end, the dollar lost slightly ground, but EUR/USD and USD/JPY didn't break any technically important levels. Uncertainty, on the US tax bill remains a potential negative for the dollar. Later this week the focus will return to a series of important eco data, including the US CPI and retail sales on Wednesday. Both data series are expected rather soft after a strong reading last month. A December Fed rate hike is almost fully discounted. We don't expect the Fed to change course even if the data are soft. Even so, weaker than expected data might create some doubts on the interest rate markets and maybe even more for the dollar. We start the week with a neutral/cautious bias on the dollar as we think that the US currency is vulnerable to some further losses if this week's eco data disappoint. We don't expect any USD setback to go very far though
From a technical point of view, EUR/USD dropped below 1.1670/62 support, but subsequent follow-through price action occurred very slow. Still the pair dropped to a new post-ECB low on Tuesday last week. A sustained break would confirm that the recent EUR/USD uptrend is broken. EUR/USD 1.1423 (38% retracement of 2017 rise) is the next downside target on the charts. A sustained return north of 1.1690, would question recent cautious downside momentum. Next resistance stands at 1.1837/80. USD/JPY's momentum was positive in past months. The pair regained 110.67/95 resistance and tested the 114.49 MT range top, but the attempt failed. A sustained break would improve the technicals. We remain cautious to preposition for further USD/JPY gains. Last week's price action remained unconvincing despite a solid interest rate support.
EUR/USD: holding within established range. Focus on Wednesday's US eco data
EUR/GBP
Political uncertainty weighs again on sterling
Sterling sentiment improved on Friday. The ‘sterling glass' was again half full. The UK trade deficit narrowed more than expected, supported by good export growth. At the same time, UK September production data were very strong (0.7% M/M vs 0.3% expected). Friday's data don't change the overall picture on the UK economy, but they give some counterweight to other disappointing eco data of late. Markets concluded that it remains possible to start negotiations on the future relationship after the December EU summit. EUR/GBP closed the session at 0.8841 (from 0.8856). Cable finished at 1.3196 (from 1.3145).
During the weekend, the Sunday Times reported that 40 conservative MP's agreed to sign a no confidence vote against PM May. A new fight on the leadership in the conservative party and pressure to make progress on the Brexit negotiations before the December EU summit are weighing on sterling. EUR/GBP trades again in the high 0.88 area this morning. Today, there are no important data, but the UK calendar is well filled later this week starting with the CPI tomorrow. The CPI is expected to have gone north of 3.0% in October. Even so, we doubt the data to be of much support for sterling as long as the political context isn't cleared out. We maintain an cautious upward bias for EUR/GBP.
MT technical: Sterling rebounded in September as the BoE prepared markets for a rate hike. This rebound ran into resistance as markets anticipated that any rate hikes would be very gradual and limited. This view was confirmed at this month's BoE policy meeting. EUR/GBP currently trades in a 0.8733/0.9033 consolidation range. A downside test of this range was rejected. We maintain the view that the 0.8733 -0.8652 support area will be tough to break in a sustainable way. A EUR/GBP buy-on-dips approach is favoured. EUR/GBP 0.9023/33 is the first important resistance.
EUR/GBP: political uncertainty to reaccelerate GBP-selling
Sterling Slides, Bitcoin Tumbles & Investors Seeking More Clarity On Tax Reforms
Sterling fell more than 0.5% early Monday, after the Sunday Times reported yesterday that 40 Conservative Party MPs agreed to sign a letter of no confidence in the Prime Minister, Theresa May. While this remains short of the 48 votes needed to force a new leadership, it still creates much frustration amongst investors seeking clarity on Brexit negotiations. With May’s position being potentially at risk and no significant progress after six rounds of talks with EU, Sterling may come under increased pressure in the next couple of days, with the 1.3024 support level at risk of being breached. A leaked letter from Boris Johnson and Michael Gove pushing for Hard Brexit, add to the uncertainty as House of Commons meet on Tuesday.
It is also a busy week on the UK’s economic data front, with Consumer Price Index, Producer Price Index, labour data and retails sales due for release. However, politics are likely to remain the dominant factor moving the pound this week.
For investors finding the low volatility environmentboring, have a look at Bitcoin. The cryptocurrency lost more than quarter of its value after reaching a high of $7,888 on 8 November. The cancellation of a plan to increase the bitcoin’s block size “Segwit2x” on Wednesday, is what’s to be blamed for the price crash, but given that prices rallied $400 on Monday it seems the news has been digested. We have seen similar steep falls in Bitcoin throughout the year; specifically in June and September, but every time a considerable decline occurs, new investors jump in to experience the new asset class. The increasing investor interest in the cryptocurrency market has pushed CME Group to announce the launch of a Bitcoin derivative soon, indicating that more fund managers and professional investors will become involved. Although Bitcoin might not be a suitable asset for conservative investors due to its volatility, I still see a great potential ahead.
Given that the earnings season has come to an end, equity investors will shift their attention to the U.S. tax reform plans. There is a considerable difference between the Senate and the House on how to proceed, and if no clear path evolves, I expect a further pullback in equities. The Senate’s proposed delay of the tax cut until 2019 is definitelynot what President Trump is looking for, so it remains to be seen whether he can push Republicans to unify when he returns from his Asia tour.
Daily Technical Analysis: EURUSD, GBPUSD, USDJPY, USDCHF
EURUSD
The EURUSD attempted to push lower last week bottomed at 1.1554 but closed higher at 1.1664. The bias is neutral in nearest term. Overall I remain bearish but need a clear break below 1.1580/50 support area to continue the”head and shoulders” bearish reversal scenario testing 1.1450 region. Immediate resistance is seen around 1.1670/90. A clear break above that area could trigger further bullish pullback testing 1.1725 but as long as stay below 1.1900 I remain bearish and any upside pullback should be seen as a good opportunity to sell.
GBPUSD
The GBPUSD had a bullish momentum last week topped at 1.3229 but traded lower earlier today in Asian session hit 1.3107. The bias is bearish in nearest term testing 1.3085/00 key support which remains a good place to buy with a tight stop loss. Immediate resistance is seen around 1.3180. A clear break above that area could lead price to neutral zone in nearest term testing 1.3229 but key resistance remains at 1.3330.
USDJPY
The USDJPY was indecisive last week. Price attempted to push higher, slipped above 114.50 key resistance but closed lower at 113.50. The bias is neutral in nearest term probably with a little bearish bias testing 113.20 support area. A clear break and daily close below that area would expose 112.50/25 area as a part of the bearish pin bar scenario. On the upside, 114.50 remains a key resistance and good place to sell with a tight stop loss. Overall I remain neutral.
USDCHF
The USDCHF had another indecisive movement last week. The bias is neutral in nearest term. Price is still trapped between 1.0037 – 0.9940 range area as you can see on my daily chart below and need a clear break from that range area to see clearer direction. Overall I remain bullish but need a clear break above 1.0037 to continue the major bullish trend testing 1.0100 or higher. On the other hand, a clear break below 0.9940 would expose 0.9835 area.
Trade Idea: AUD/USD – Hold short entered at 0.7720
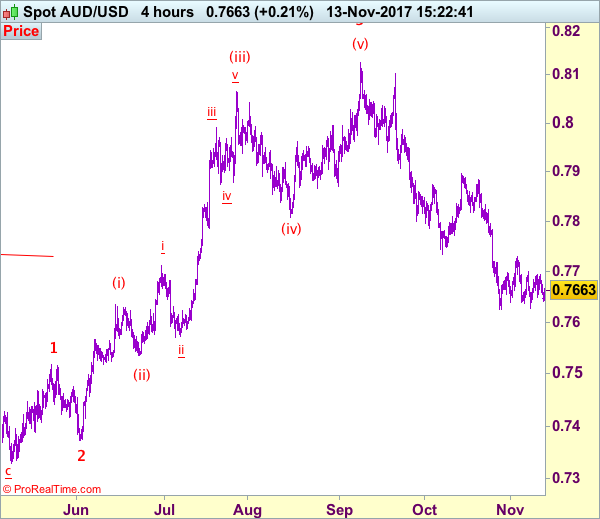
AUD/USD – 0.7663
Original strategy:
Sold at 0.7720, Target: 0.7550, Stop: 0.7720
Position: - Short at 0.7720
Target: - 0.7550
Stop:- 0.7720
New strategy :
Hold short entered at 0.7720, Target: 0.7550, Stop: 0.7705
Position: - Short at 0.7720
Target: - 0.7550
Stop:- 0.7705
As aussie has retreated again after faltering below resistance at 0.7701, retaining our bearishness for recent decline to resume after consolidation, below indicated support at 0.7625 would extend recent decline from 0.8125 top to 0.7600, then 0.7550, having said that, loss of downward momentum should prevent sharp fall below there and reckon 0.7500 would hold from here, bring rebound later.
In view of this, we are holding on to our short position entered at 0.7720. Above said resistance at 0.7701 would defer and risk a stronger rebound but only break of previous support at 0.7770 would abort and suggest a temporary low has possibly been formed, bring rebound to 0.7800 and then towards 0.7825-35 later.
On the 4-hour chart, recent upmove from 0.7329 is unfolding as an impulsive rise with wave 3 as well as smaller degree wave (iii) extending, only minor wave v of (iii) has ended at 0.8125, hence bullishness remains for this move to extend headway to 0.8200, then towards 0.8300, however, reckon upside would be limited to 0.8400 and the final wave 5 should falter below 0.8500, bring correction later.
USD/JPY Candlesticks and Ichimoku Analysis
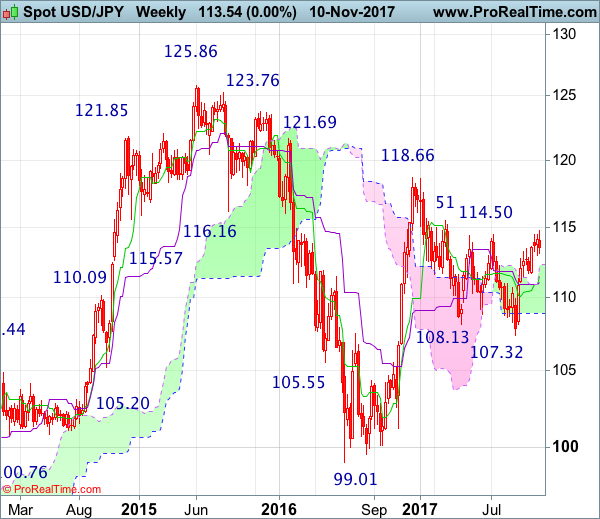
Weekly
• Last Candlesticks pattern: Dark cloud cover
• Time of formation: 10 Jul 2017
• Trend bias: Down
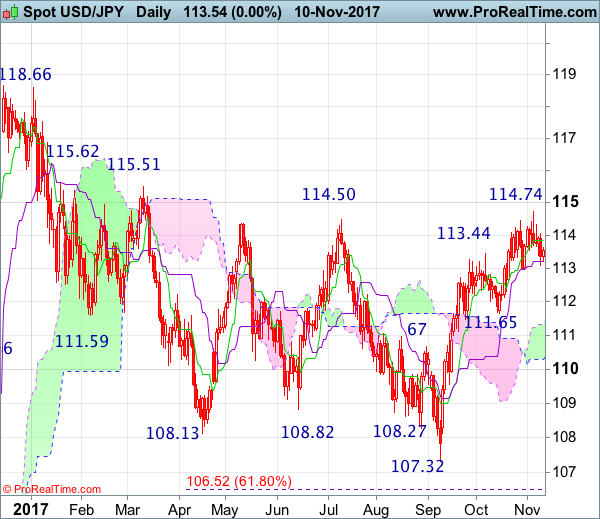
Daily
• Last Candlesticks pattern: Evening doji
• Time of formation: 7 Aug 2017
• Trend bias: Down
USD/JPY – 113.45
Although the greenback retreated after rising to 114.74 last week and consolidation below this level would be seen, reckon support at 112.96 would limit downside and bring rebound later, above 114.05-10 would signal the retreat from 114.74 has ended, bring retest of this level, break there would add credence to the view that the fall from 118.66 has ended and extend the rise from 107.32 to 115.00, then towards previous resistance at 115.51-62, having said that, loss of momentum should prevent sharp move beyond 116.00-10 and reckon 116.50-60 would hold from here, risk from there is seen for another retreat later.
On the downside, whilst initial pullback to 113.30-35 is likely, reckon support at 112.96 would contain downside and bring another rise. Below 112.55-60 would defer and suggest a temporary top has possibly been formed at 114.74, bring retracement of recent rise to 112.00 but previous support at 111.65 should remain intact, bring rebound later.
Recommendation : Hold long entered at 113.40 for 115.40 with stop below 112.40.
On the weekly chart, although the greenback broke above indicated previous resistance at 114.45-50 initially last week, lack of follow through buying and the subsequent retreat suggest consolidation below this level would be seen and pullback towards support at 112.96 cannot be ruled out, however, reckon the Tenkan-Sen (now at 112.87) would limit downside and bring another rise later, above 114.05-10 would bring retest of 114.74 but break there is needed to extend recent rise from 107.32 to 115.51-62 resistance. Once this level is penetrated, this would add credence to our view that early erratic decline from 118.66 has ended at 107.32, then headway to 116.50-60 and possibly 117.00-10 would follow.
On the downside, expect pullback to be limited to said support at 112.96 and bring another rise later. A drop below 112.96 support would defer and suggest a temporary top is possibly formed instead, bring pullback to 112.30, then 112.00, however, previous support at 111.65 should hold. Only a break below this level would signal the rise from 107.32 low has ended, bring deeper correction to the Kijun-Sen (now at 111.03) which is likely to hold from here.
The US And UK CPI Inflation For October
Market movers today
We are heading for another relatively quiet week, with no major market movers in the US or Europe today.
The ECB's Vitor Constancio is due to speak in Frankfurt today and markets will watch out for any hints that he is mirroring Benoît Coeuré's message from last week that loose monetary policy will not last forever.
Later this week, the US and UK CPI inflation for October, the first German Q3 GDP estimate and Chinese industrial production data will be in focus.
Selected market news
On Friday, the ECB's Governing Council member Ewald Nowotny (usually considered neutral) said in an interview that ECB's forward guidance regarding key interest rates does not leave policy makers room to hike interest rates before 2019. In addition, he said that the ECB should end QE after September 2018 if the economy allows, which adds to the recent indications that the Governing Council has shifted in a slightly more hawkish direction.
The Fed's Patrick Harker (voter, hawkish) said in a speech today in Tokyo that he has an other rate hike ‘lightly pencilledin' this year. Later this week (on Wednesday), focus will turn towards the US CPI release for October. Although we expect inflation pressure to have remained muted in October with the headline CPI inflation rate falling to 1.9% y/y from 2.2% in September, it remains our base case that the Fed will hike in December, as the core voting FOMC members put more weight on labour market data than current inflation data. A Fed hike in December is close to fully pricedin with a market -implied probability currently around 90%.
On Friday, Danish CPI October inflation came out at 1.5% y/y in line with our expectations, against 1.6% y/y in September. Overall, it seems as if Danish CPI inflation has reached a new higher level since the summer. We should still keep in mind though that food price increases are a big part of it and they could decrease in coming months.
It has been a calm session in global financial markets this morning. Asian stock markets have mainly been moving sideways and in fixed income markets, changes in the US 10-year government benchmark bond yield have been subdued.