
Sample Category Title
EUR/AUD Daily Outlook
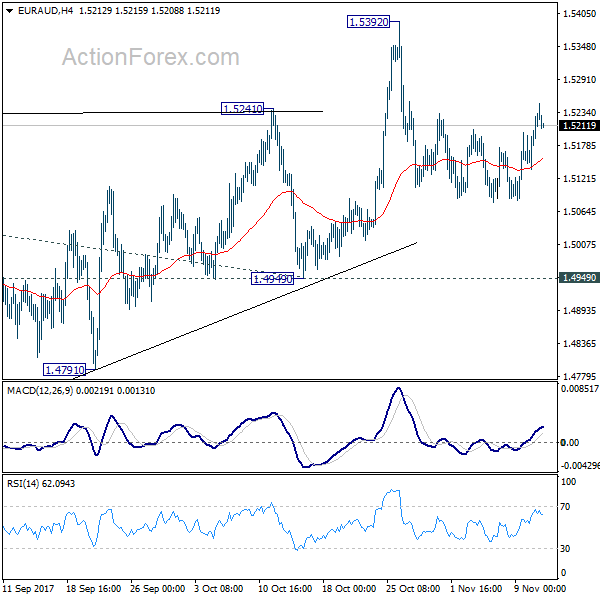
Daily Pivots: (S1) 1.5161; (P) 1.5197; (R1) 1.5258; More....
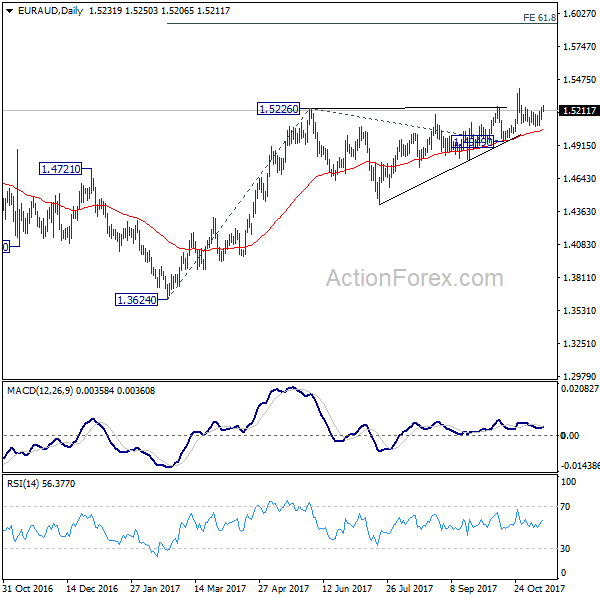
EUR/AUD is still bounded in consolidation from 1.5392 and intraday bias remains neutral at this point. As long as 1.4949 support holds, outlook remains bullish and further rise is in favor. Break of 1.5392 will resume medium term rise from 1.3624 and target 61.8% projection of 1.3624 to 1.5226 from 1.4949 at 1.5939 first. However, decisive break of 1.4949 will carry larger bearish implication and turn bias to the downside.
In the bigger picture, we're holding on to the view that corrective decline from 1.6587 medium term top has completed at 1.3624. Rise from 1.3624 is expected to extend to retest 1.6587. However, break of 1.4949 support will dampen our view and argue that rise from 1.3624 has completed. In that case, EUR/AUD would turn southward for retesting 1.3624 low.
The USD/JPY Is Building A Bullish Correction To The Top Of The Bearish Channel
Key Highlights
- The Euro started a decent recovery and moved above 1.1620 against the US Dollar.
- There is a major bearish trend line forming with resistance at 1.1760 on the 4-hours chart of EUR/USD.
- The Michigan Consumer Sentiment Index (Prelim) in Nov 2017 decreased from 100.7 to 97.8.
- Today in the Euro Zone, Portugal's CPI for Oct 2017 will be released, which is forecasted to increase by 1.4% (YoY).
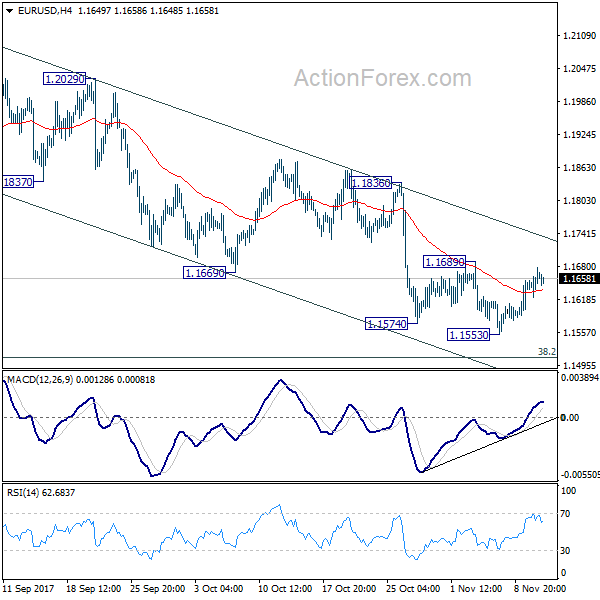
EURUSD Technical Analysis
The Euro recently formed a decent support above 1.1550 against the US Dollar. The EUR/USD pair is recovering, but faces important resistances like 1.1700, 1.1720 and 1.1760.
The pair has moved above the 23.6% Fib retracement level of the last drop from the 1.1836 high to 1.1554 low. However, buyers seem to be struggling near the 1.1700 level and the 100 simple moving average (red, 4-hour).
Above 1.1700, the 61.8% Fib retracement level of the last drop from the 1.1836 high to 1.1554 low is around 1.1720 and the 200 simple moving average (green, 4-hour). Moreover, there is a major bearish trend line forming with resistance at 1.1760 on the same chart.
Therefore, there are many barriers for EUR/USD on the upside starting with 1.1700. On the downside, an initial support is at 1.1620, followed by the 1.1600 handle that holds a lot of importance in the near term for buyers.
Michigan Consumer Sentiment Index
This past Friday in the US, the Michigan Consumer Sentiment Index (Prelim) for Nov 2017 was released by the University of Michigan. The forecast was slated for no change from the last reading of 100.7 in Nov 2017.
However, the actual result was disappointing, as there was a decline in the Michigan Consumer Sentiment Index from 100.7 to 97.8. The final index reading is scheduled on November 22, 2017 at 10am ET.
The report added:
Consumer sentiment declined slightly in early November due to widespread losses across current and expected economic conditions. The losses were quite small as the Sentiment Index remained at its second highest level since January.
Overall, the EUR/USD pair is showing a lot of positive signs, but it is facing many significant resistances on the upside such as 1.1720 and 1.1760.
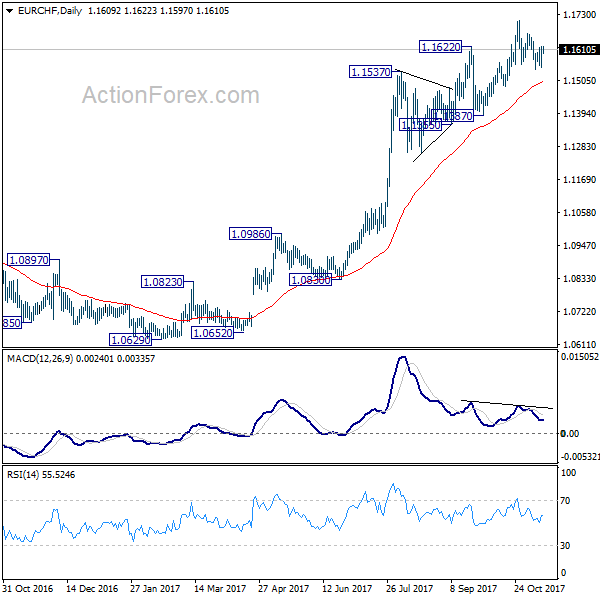
EUR/CHF Daily Outlook
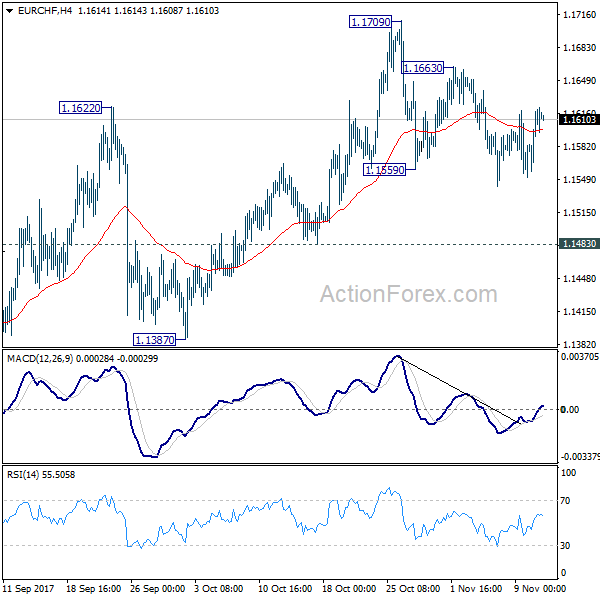
Daily Pivots: (S1) 1.1574; (P) 1.1596; (R1) 1.1636; More...
Intraday bias remains neutral in EUR/CHF and outlook is unchanged. With 1.1483 support intact, further rally is expected. On the upside, above 1.1663 minor resistance will turn bias back to the upside for 1.1709 high. Break will resume medium term rally to 1.2 key level. However, break of 1.1483 will be an early sign of reversal. In that case, deeper decline should be seen back to 1.1355 support.
In the bigger picture, long term rise from SNB spike low back in 2015 is still in progress. EUR/CHF should now be heading back to prior SNB imposed floor at 1.2000. For now, this will be the favored case as long as 1.1355 support holds. However, break of 1.1355 will indicate medium term topping. In that case, EUR/CHF should head back to 55 week EMA (now at 1.1105) and possibly below.
Daily Wave Analysis: EUR/USD Tests Fibonacci Resistance Levels Of Wave-4 Pattern
Currency pair EUR/USD
EUR/USD is in a wave 4 (blue) bullish retracement within a larger downtrend and therefore the Fibonacci levels of wave 4 (blue) could act as resistance. A break below the support trend line (blue) could indicate a potential bearish breakout within wave 5 (blue) of wave C (purple).
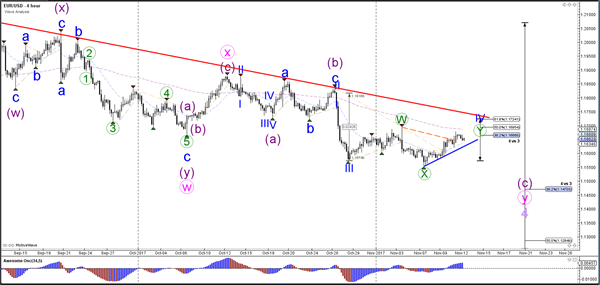
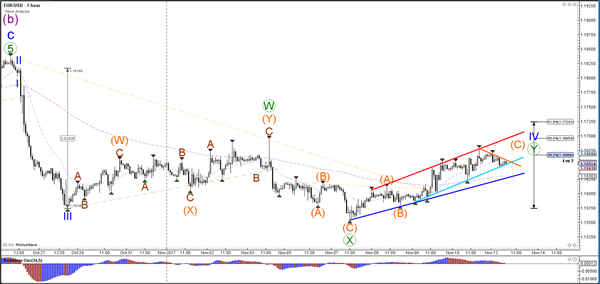
The EUR/USD seems to be building an ABC (orange) within a wave 4 (blue) correction. The wave C (orange) could extend to test higher Fibonacci levels if it breaks above the local resistance trend line (orange).
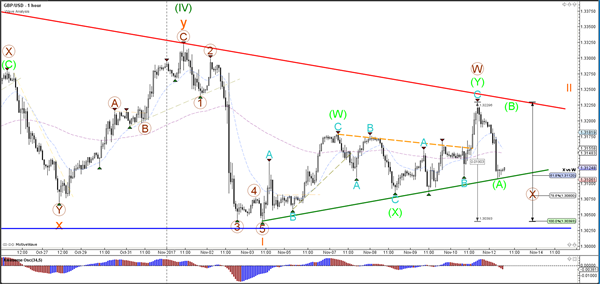
Currency pair GBP/USD
The GBP/USD is showing multiple corrective patterns and a break below support (blue) or resistance (red) is needed before a larger directional move can be expected.
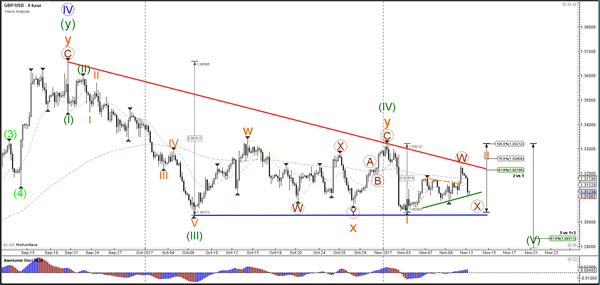
The GBP/USD is probably expanding the correction if price stays in between support and resistance trend lines.
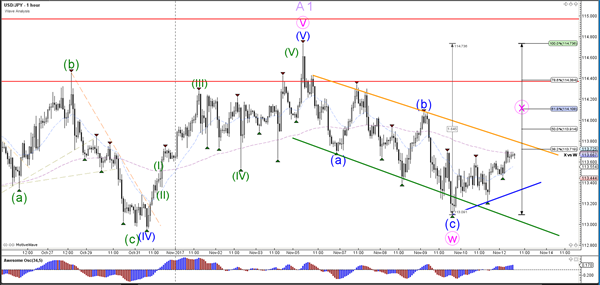
Currency pair USD/JPY
The USD/JPY is building a choppy bearish trend channel. The correction could go lower if price stays in the channel or breaks below the 23.6% Fibonacci level. In that case a wave 2 or wave B (light purple) could be developing.
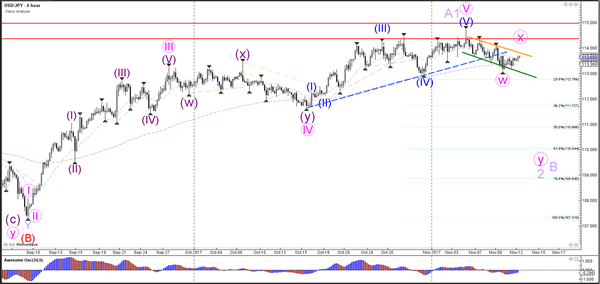
The USD/JPY is building a bullish correction to the top of the bearish channel.
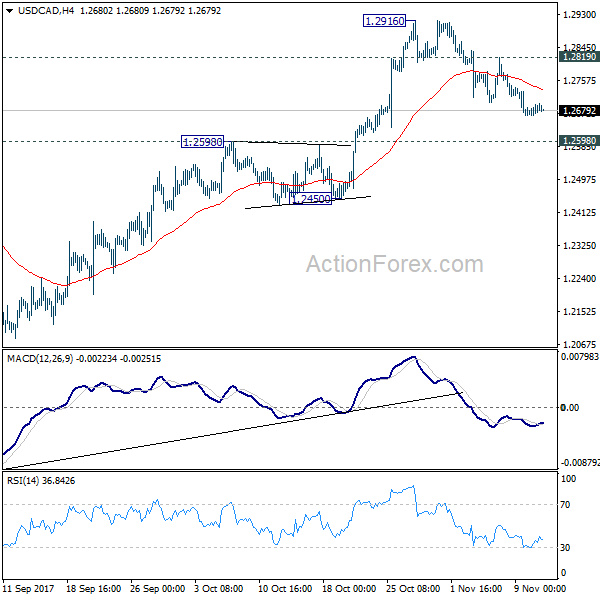
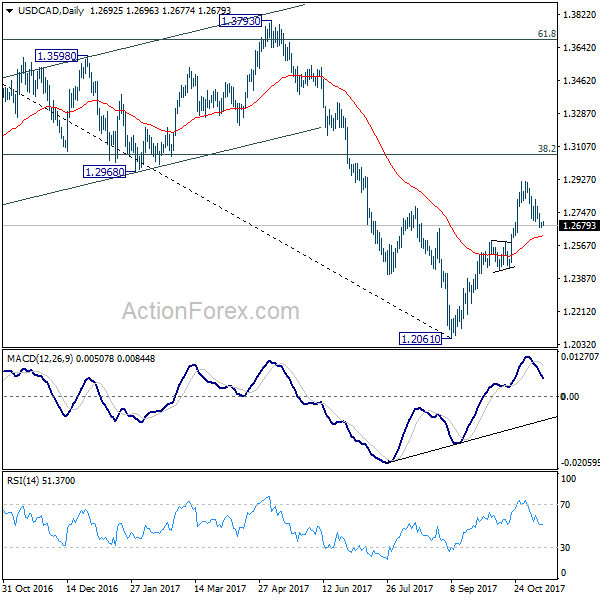
USD/CAD Daily Outlook
Daily Pivots: (S1) 1.2669; (P) 1.2682; (R1) 1.2699; More....
USD/CAD's correction from 1.2916 is still in progress and deeper fall could be seen. But outlook will remain bullish as long as 1.2598 resistance turned support holds. On the upside, above 1.2819 minor resistance will turn bias back to the upside for 1.2916 high first. Break there will extend the rise from 1.2061 to 38.2% retracement of 1.4689 to 1.2061 at 1.3065. However, sustained break of 1.2598 will argue that rebound from 1.2061 has completed after hitting 55 week EMA (now at 1.2916). Near term outlook will be turned bearish in this case.
In the bigger picture, USD/CAD should have defended 50% retracement of 0.9406 (2011 low) to 1.4689 (2016 high) at 1.2048. And with 1.2048 intact, we'd favor the case that fall from 1.4689 is a correction. Rise from 1.2061 medium term bottom should now target 38.2% retracement of 1.4689 to 1.2061 at 1.3065. Firm break there will target 1.3793 key resistance next (61.8% retracement at 1.3685). We'll now hold on to this bullish view as long as 1.2450 support holds.
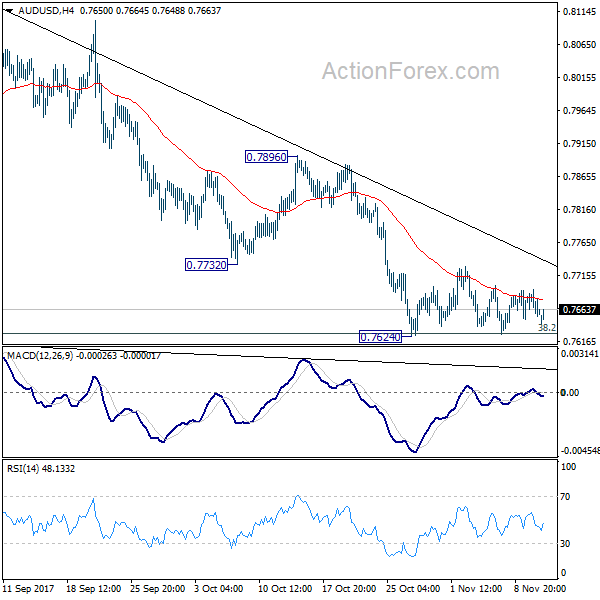
AUD/USD Daily Outlook
Daily Pivots: (S1) 0.7642; (P) 0.7668; (R1) 0.7682; More...
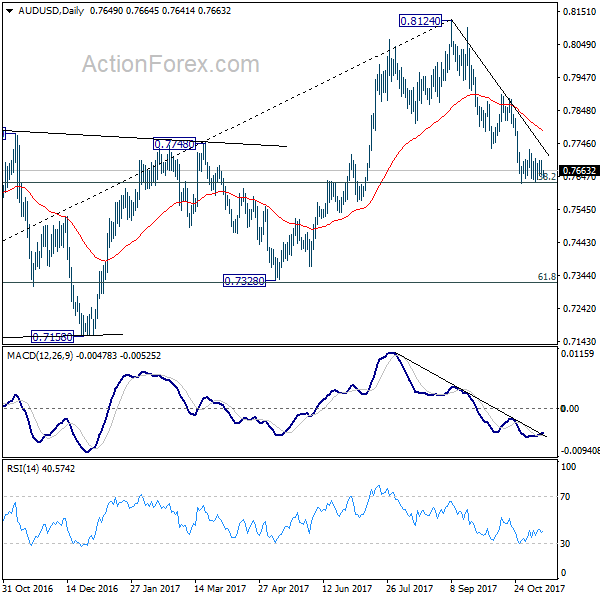
Intraday bias in AUD/USD remains neutral as consolidation from 0.7624 continues. In case of another recovery, upside should be limited well below 0.7896 resistance to bring fall resumption. On the downside, decisive break of 0.7624 will resume whole fall from 0.8124 and target next key cluster level at 0.7322/8.
In the bigger picture, corrective rise from 0.6826 medium term bottom is likely completed at 0.8124, after hitting 55 month EMA (now at 0.8067). Decisive break of 0.7328 key cluster support (61.8% retracement 0.6826 to 0.8124 at 0.7322) will confirm. And in that case, long term down trend from 1.1079 (2011 high) will likely be resuming. Break of 0.6826 will target 61.8% projection of 1.1079 to 0.6826 from 0.8124 at 0.5496. This will now be the favored case as long as 0.7896 near term resistance holds.
Aussie Trading Marginally Lower In The Morning Session
For the 24 hours to 23:00 GMT, the AUD declined 0.23% against the USD and closed at 0.7661 on Friday.
LME Copper prices rose 0.3% or $20.0/MT to $6797.0/MT. Aluminium prices rose 0.6% or $12.0/MT to $2090.0/MT.
In the Asian session, at GMT0400, the pair is trading at 0.7660, with the AUD trading slightly lower against the USD from Friday’s close.
The pair is expected to find support at 0.7636, and a fall through could take it to the next support level of 0.7613. The pair is expected to find its first resistance at 0.7689, and a rise through could take it to the next resistance level of 0.7719.
Moving ahead, investors would keep a close watch on Australia’s NAB business confidence index for October, due to release overnight.
The currency pair is showing convergence with its 20 Hr moving average and trading below its 50 Hr moving average.

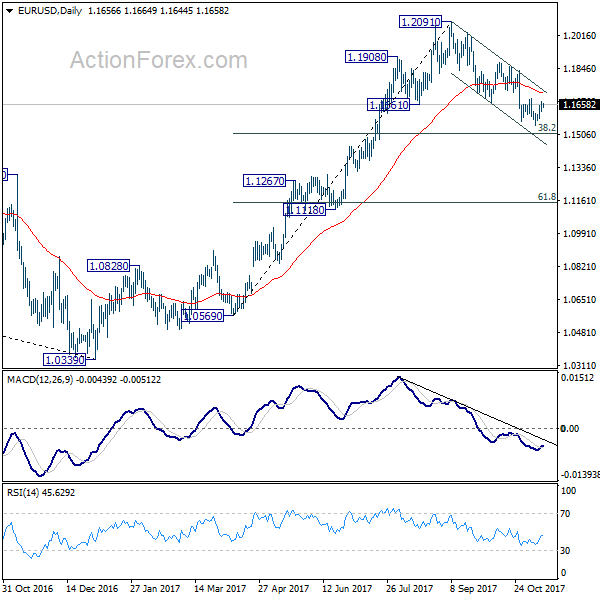
EUR/USD Daily Outlook
Daily Pivots: (S1) 1.1630; (P) 1.1654 (R1) 1.1685; More...
Intraday bias in EUR/USD remains neutral at this point. As long as 1.1689 resistance holds, deeper decline is in favor. Below 1.1553 will resume whole fall from 1.2091 and target 38.2% retracement of 1.0569 to 1.2091 at 1.1510. We'd be cautious on strong support from there to bring rebound. But sustained break of 1.1510 will pave the way to next support zone at 1.1118/1267. On the upside, break of 1.1689 resistance will now indicate short term bottoming and turn bias back to the upside for 1.1836 resistance instead.
In the bigger picture, rise from 1.0339 medium term bottom is seen as a corrective move for the moment. Therefore, in case of another rally, we'd be cautious on 38.2% retracement of 1.6039 (2008 high) to 1.0339 (2017 low) at 1.2516 to limit upside and bring reversal. Meanwhile, sustained trading below 55 week EMA (now at 1.1346) will suggest that such medium term rebound is completed and could then bring retest of 1.0339 low.
Euro Trading Lower In The Asian Session
For the 24 hours to 23:00 GMT, the EUR rose 0.22% against the USD and closed at 1.1668 on Friday.
In economic news, industrial production in France rebounded more-than-expected by 0.6% on a monthly basis in September, compared to market consensus for a rise of 0.5%. Industrial production had recorded a revised drop of 0.2% in the prior month.
The greenback traded mixed against a basket of major currencies on Friday, amid rumbling uncertainty around the implementation of US tax reform plans.
On the data front, the US preliminary Reuters/Michigan consumer sentiment index unexpectedly dropped to a level of 97.8 in November, confounding market expectations for an increase to a level of 100.9. In the prior month, the index had registered a 13-year high level of 100.7.
In the Asian session, at GMT0400, the pair is trading at 1.1654, with the EUR trading 0.12% lower against the USD from Friday’s close.
Meanwhile, the Philadelphia Federal Reserve President, Patrick Harker, flagged his support for a December interest rate hike, despite caution over stubbornly low inflation.
The pair is expected to find support at 1.1625, and a fall through could take it to the next support level of 1.1597. The pair is expected to find its first resistance at 1.1680, and a rise through could take it to the next resistance level of 1.1707.
In the absence of any major macroeconomic releases in the Euro-zone today, investors would direct their attention to the US monthly budget statement for October, slated to release overnight.
The currency pair is showing convergence with its 20 Hr moving average and trading above its 50 Hr moving average.

Britain’s Manufacturing And Industrial Production Climbed Above Expectations In September, Construction Output Dipped In The Same Month
For the 24 hours to 23:00 GMT, the GBP rose 0.41% against the USD and closed at 1.3197 on Friday, after a string of upbeat economic reports from the UK pointed to healthy economic conditions in the nation.
Britain's industrial production climbed more-than-anticipated by 0.7% MoM in September, rising at its fastest pace this year and following a revised gain of 0.3% in the previous month. Markets were expecting industrial production to advance 0.3%. Moreover, the nation's manufacturing production rose more-than-expected by 0.7% on a monthly basis in September, surging to its highest since December 2016. Market participants had expected manufacturing production to climb 0.3%, after recording a rise of 0.4% in the prior month. However, the nation's construction output retreated more-than-estimated by 1.6% on a monthly basis in September, compared to a revised advance of 0.8% in the previous month, while investors had envisaged for a fall of 0.9%.
Another set of data revealed that the nation's total trade deficit surprisingly narrowed to £2.8 billion in September, compared to market consensus for it to widen to £4.3 billion. The nation had reported a revised total trade deficit of £3.5 billion in the prior month. Further, leading think tanker, NIESR estimated that UK's gross domestic product (GDP) rose 0.5% in the three months to October, slightly stronger than the 0.4% expansion projected in the July-September period.
In the Asian session, at GMT0400, the pair is trading at 1.3122, with the GBP trading 0.57% lower against the USD from Friday's close, amid news that a group of 40 Conservative lawmakers have agreed to sign a letter of no confidence against the British Prime Minister, Theresa May.
Data released overnight showed that UK's Rightmove house prices fell 0.8% on a monthly basis in November, after recording a gain of 1.1% in the preceding month.
The pair is expected to find support at 1.3076, and a fall through could take it to the next support level of 1.3030. The pair is expected to find its first resistance at 1.3199, and a rise through could take it to the next resistance level of 1.3276.
The currency pair is trading below its 20 Hr and 50 Hr moving averages.
