Sample Category Title
Wobbles And Squabbles
More tax reform wobbles and squabbles to come?
The market certainly had its Jekyll-and Hyde moments last week as the torrent of interparty lobbying suggests we are nearing a now or never moment for US tax reform.
Digesting tax reform banter is an unsavoury business as even the ambient noise is triggering unusual moves across asset classes which has traders scurrying looking for answers. But when usual correlations break down; it creates conflicting messages producing a scrambled picture and price discovery becomes virtually impossible. Indeed, this partly explains some of the last weeks dangerous market schizophrenia, however in this low volatility environment with investors overly optimistic views likely stretched, even the smallest shock can help trigger an outsized move. Besides with Christmas just around the corner, investors will be more inclined to book year-end profits adding to sell-off momentum.
Similarly, currency traders, especially dollar bulls, will look to bank profits early this year given that most of the optimistic USD drivers have run their course. Indeed if this week's US CPI print fails to trigger more Fed tightening expectation into 2018 and given the much of the Tax reform USD positivity is factored in, we should expect a deeper USD correction.
Speaking of possible meltdowns: As the enormity of the budgetary implications surrounding Tax Reform sets in, bondholders are getting increasing jittery just thinking about the volumes of new issues that would be required to fund this massive budget shortfall. If we compound this with a possible, but at this stage unlikely uptick in US inflation, we could see a sharper Bond Market sell-off in weeks to come. But in fact, Friday's main market mover was the far-reaching sell-off in global Sovereign Bonds ahead of this week key inflation data in perhaps a foreshadowing of things to come.
Speaking of actual meltdowns: Given just how boringly predictable gold markets have become lately, I guess a 10 dollar move lower is considered a deep plunge.( referring to Friday's ” Mystery 4 million ounce seller) But with the cascade of political noise, backroom negotiations in full swing and some crankiness in US bond yields, someone is either taking a view on significant “big boys club” Gold position or it could be nothing more than hedge fund trimming longs which have been an ongoing trend the past 5-6 weeks. And while there doesn't appear to be a powerful impetus for prices to move higher, there doesn't seem to be a significant wavemaker to drive prices lower either.
Global equity markets traded lower on Friday influenced by higher bond yields and uncertainty over US tax reform. The exception was China where local stock markets were trading firmer after Friday's announcement that China will be allowing Mainland financial firms greater access to foreign ownership of Chinese Financial Firms While the timing may look suspiciously coordinated with President Trump visits, the fact is the announcement is an enthusiastic signal and symbolically significant that the government is genuine about the reforms discussed in the Party Congres.
The Chinese Yuan amid reforms
From a currency perspective, the markets will tread carefully knowing it will take time for something actionable to occur but this opening up of China's financial market's to the rest of the world is a clear signal that China is looking to increase FDI. Ultimately this should lead to more capital inflow to counterbalance China's capital outflow problem. Market reform will always be viewed in a positive light and should be Yuan positive longterm.
The Japanese Yen
Price action around the tax reform headlines will be little more than a chop fest.But logic dictates lawmakers will pass tax reform in some form or another knowing the ensuing market meltdown is on there watch if they fail to do so. With that in mind, we should expect dips to remain supported, but with an increasing number of stops entering the picture just below 113, a break of this tipping point suggests things will get messy quickly. But given what lies ahead we should expect another discombobulated week for USDJPY trading as the interday tug of war between US yields and global equities is expected to intensify.
The Australian Dollar
Australia employment data is on tap this week as all data will be scoured over in the wake of the SOMP that gave little reason to buy the Aussie dollar. But unless there is a massive surprise in the data or an abrupt shift in RBA rhetoric, who appear sidelined indefinitely on tepid growth and apathetic inflation figures, the Aussie should remain pressured.
Iron ore futures drifted lower on Friday moved by China consumption fears which now leaves little more than US Corp tax delay headlines holding the market back from assaulting the recent AUD lows.
RBA Assistant Governor Luci Ellis will talk on ‘Where is the Growth Going to Come From' in Melbourne on Wednesday which should also be of interested to the markets given the obvious lack thereof when it comes to economic growth,
The New Zealand Dollar
An intense focus will remain on the Kiwi as the recent wave of post RBNZ NZD cross buying got hosed down on the back of Friday's comments from Finance Minister Robertsons where he said that the dual mandate could result in looser policy in specific situations. Any thought of RBNZ uncertainty fading into the background after the Central Bank struck an upbeat chord at last weeks OCR quickly evaporated on Robertson's verbosity.
Strategically with the RBNZ bringing forward both OCR and inflation forecast, it should lead to a higher NZD, but the market remains overly comfortable selling on the political risk narrative which suggests politics, not the monetary policy will continue to be the primary driver near term.
The Euro
No shortage of ECB Hawks flying into the picture as the ECB's dovish taper a distant memory.Indeed the robust economic data out of the eurozone does suggest a more aggressive unwinding of easy-money policies than currently factored. With the USD all but stuck in the muck, the Euro could trade firmer this week vs the USD
But with USD CPI and Retail sales on tap not to mention Tax headline, the most obvious path for the EUR appreciation would be via the Aussie dollar given the apparently dormant RBA
EURUSD – Pressure Builds Up On The Upside, Eyes The 1.1724 Zone
EURUSD - With the pair backing off lower prices to close higher the past week, more strength is likely. Resistance comes in at 1.1700 level with a cut through here opening the door for more upside towards the 1.1750 level. Further up, resistance lies at the 1.1800 level where a break will expose the 1.1850 level. Its daily RSI is bullish and pointing higher suggesting further strength. Conversely, support lies at the 1.1600 level where a violation will aim at the 1.1550 level. A break of here will aim at the 1.1500 level. Below here will open the door for more weakness towards the 1.1450. All in all, EURUSD faces further corrective recovery threats.
GOLD – Vulnerable, Faces Further Weakness
GOLD - The commodity looks to extend its downside pressure. On the downside, support comes in at the 1,270.00 level where a break will turn attention to the 1,260.00 level. Further down, a cut through here will open the door for a move lower towards the 1,250.00 level. Below here if seen could trigger further downside pressure towards the 1,240.00 level. Conversely, resistance resides at the 1,280.00 level where a break will aim at the 1,290.00 level. A turn above there will expose the 1,300.00 level. Further out, resistance stands at the 1,310.00 level. All in all, GOLD looks to weaken further on correction.
EUR/USD Weekly Outlook
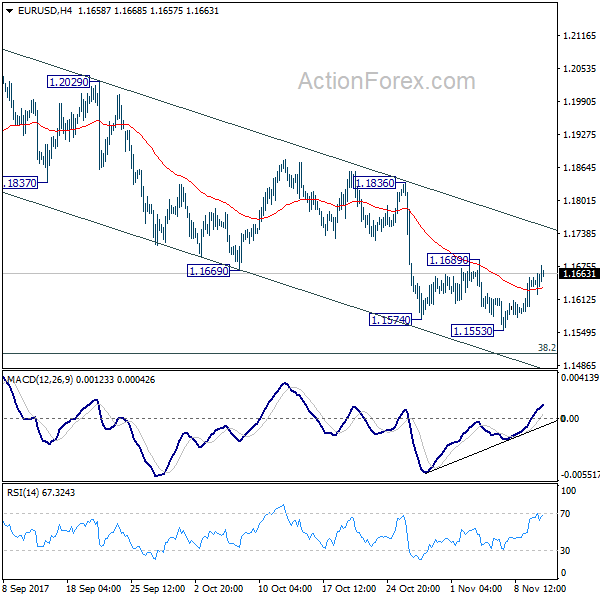
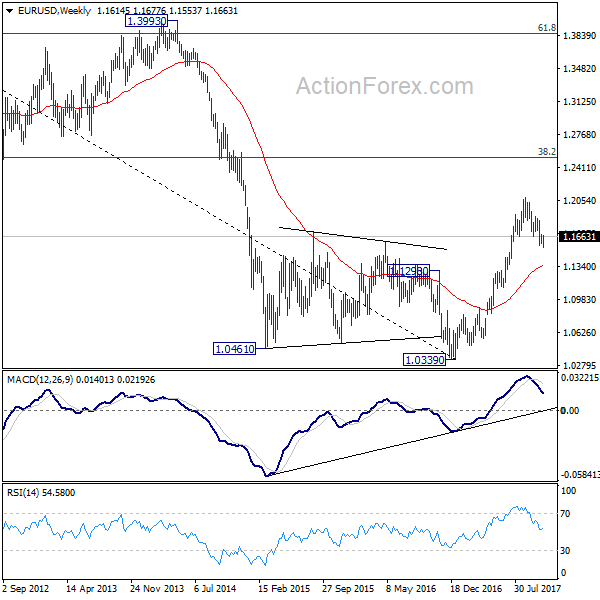
EUR/USD dipped to 1.1533 last week but recovered quickly. Initial bias remains neutral this week first. As long as 1.1689 resistance holds, deeper decline is in favor. Below 1.1553 will resume whole fall from 1.2091 and target 38.2% retracement of 1.0569 to 1.2091 at 1.1510. We'd be cautious on strong support from there to bring rebound. But sustained break of 1.1510 will pave the way to next support zone at 1.1118/1267. On the upside, break of 1.1689 resistance will now indicate short term bottoming and turn bias back to the upside for 1.1836 resistance instead.
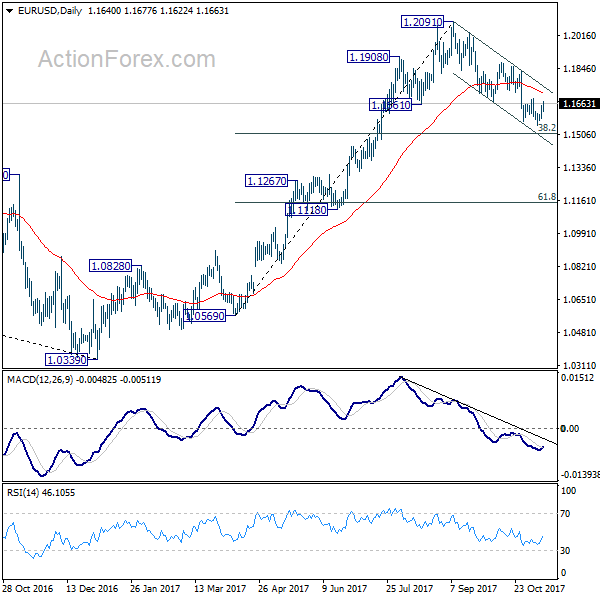
In the bigger picture, rise from 1.0339 medium term bottom is seen as a corrective move for the moment. Therefore, in case of another rally, we'd be cautious on 38.2% retracement of 1.6039 (2008 high) to 1.0339 (2017 low) at 1.2516 to limit upside and bring reversal. Meanwhile, sustained trading below 55 week EMA (now at 1.1346) will suggest that such medium term rebound is completed and could then bring retest of 1.0339 low.
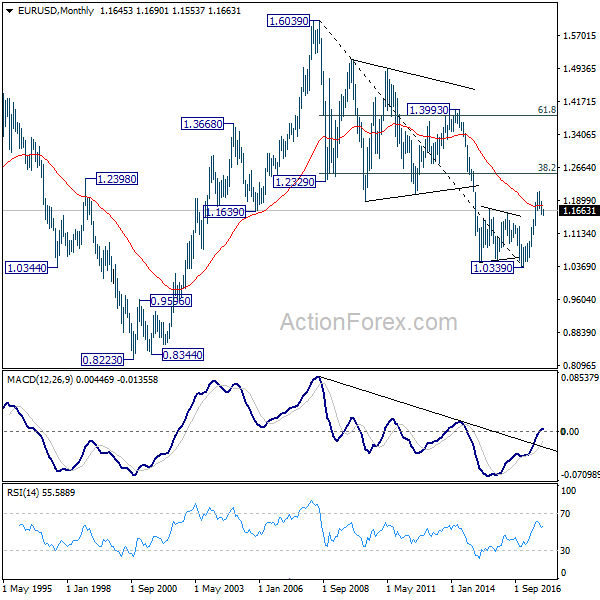
In the long term picture, 1.0339 is now seen as an important bottom as the down trend from 1.6039 (2008 high) could have completed. It's still early to decide whether price action form 1.0339 is developing into a corrective or impulsive move. On the upside, strong resistance could be seen from 38.2% retracement of 1.6039 to 1.0339 at 1.2516. On the downside, we're not anticipating a break of 1.0339 in near to medium term.
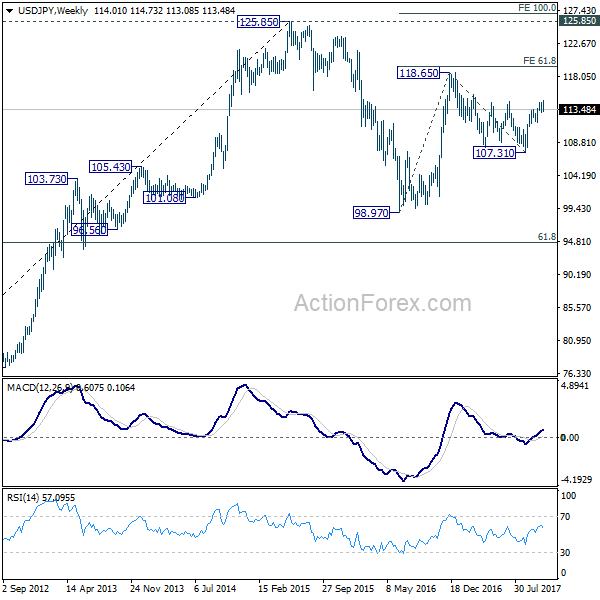
USD/JPY Weekly Outlook
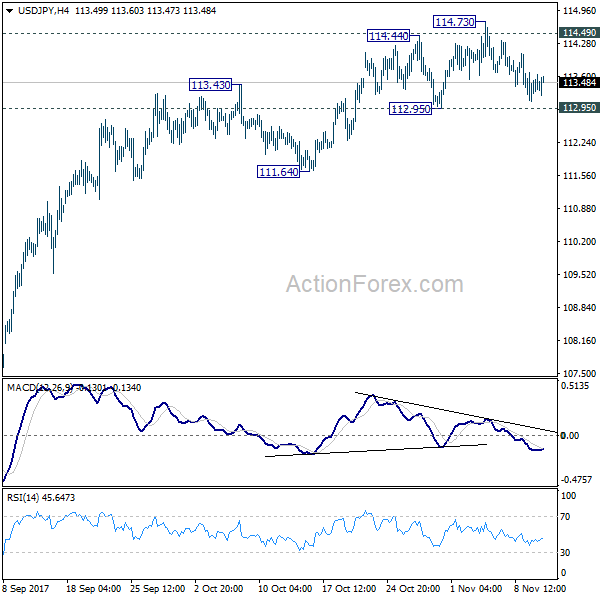
USD/JPY edged higher to 114.73 last week but failed to sustain above 114.49 key resistance and retreated. Initial bias remains neutral this week first. Since the pair is still holding on to 112.95 support, near term outlook remains bullish. On the upside, sustained break of 114.49 key resistance will pave the way to retest 118.65 high. However, break of 112.95 support will now indicate rejection from 114.49 and turn bias to the downside for 111.64 support and below.
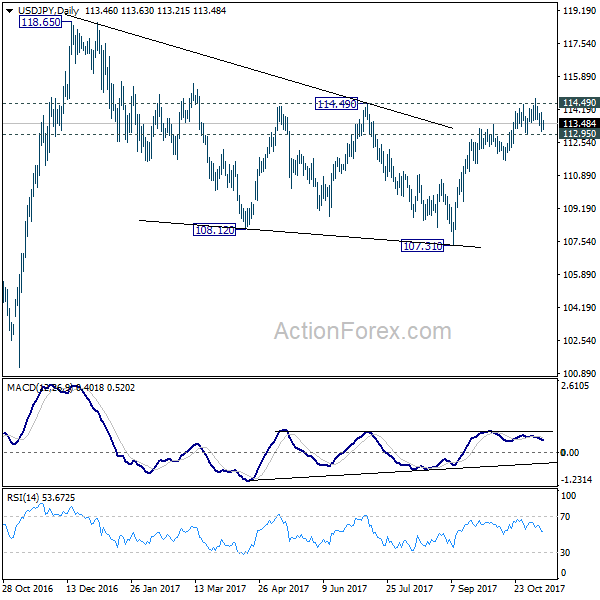
In the bigger picture, medium term rise from 98.97 (2016 low) is not completed yet. It should resume after corrective fall from 118.65 completes. Break of 114.49 resistance will likely resume the rise to 61.8% projection of 98.97 to 118.65 from 107.31 at 119.47 first. Firm break there will pave the way to 100% projection at 126.99. This will be the key level to decide whether long term up trend is resuming.
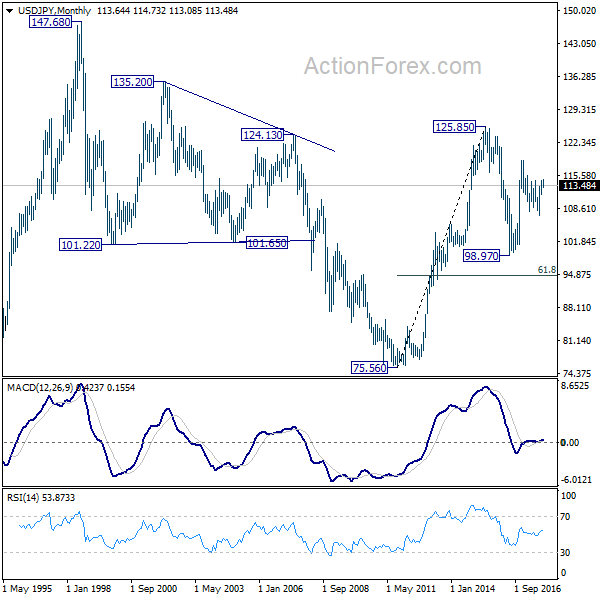
In the long term picture, the rise from 75.56 (2011 low) long term bottom to 125.85 top is viewed as an impulsive move, no change in this view. Price actions from 125.85 are seen as a corrective move which could still extend. In case of deeper fall, downside should be contained by 61.8% retracement of 75.56 to 125.85 at 94.77. Up trend from 75.56 is expected to resume at a later stage for above 135.20/147.68 resistance zone.
GBP/USD Weekly Outlook
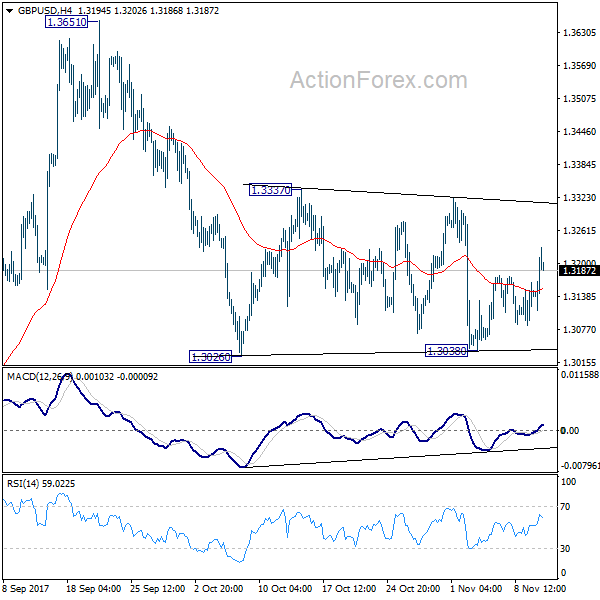
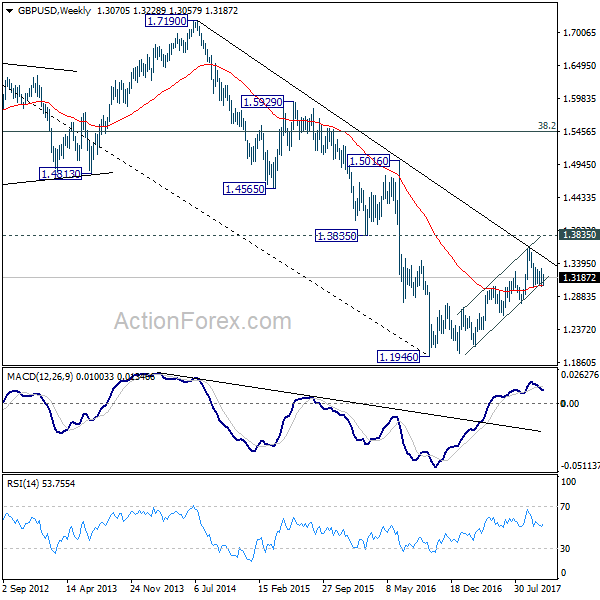
GBP/USD recovered ahead of 1.3026 support last week as sideway trading continued. Initial bias remains neutral this week first. Upside of recovery should be limited below 1.3337 resistance to bring fall resumption. Break of 1.3038 will now resume decline from 1.3651 to 1.2773 key support level. However, decisive break of 1.3337 will indicate that pull back from 1.3651 is completed and medium term rise from 1.1946 is resuming.
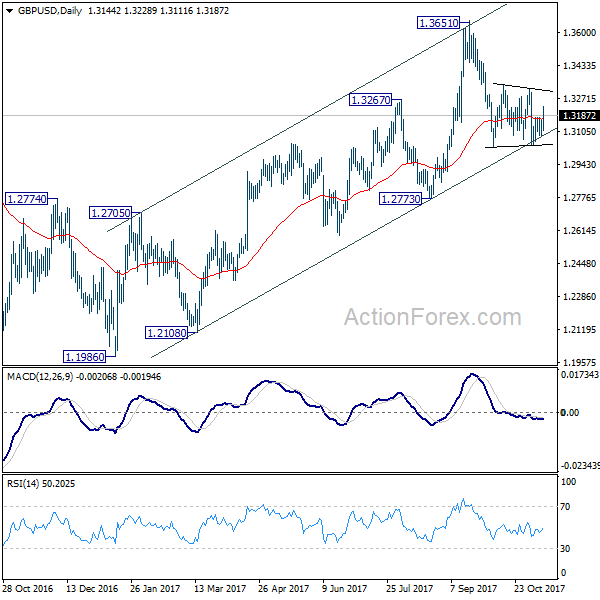
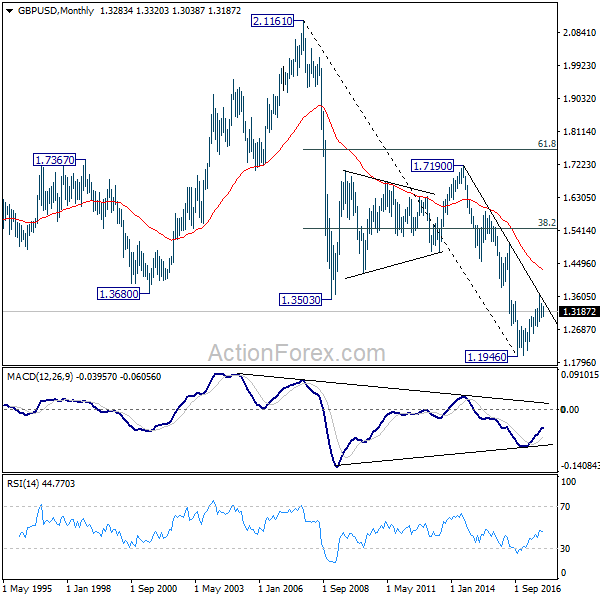
In the bigger picture, as noted before, GBP/USD hit strong resistance from the long term falling trend line. Current development is starting to favor that corrective rebound from 1.1946 low has completed at 1.3651. Decisive break of 1.2773 will confirm this bearish case and target a test on 1.1946 low next, with prospect of resuming the low term down trend. Nonetheless, break of 1.3320 resistance will restore the rise from 1.1946 for 38.2% retracement of 2.1161 (2007 high) to 1.1946 (2016 low) at 1.5466.
In the longer term picture, long the outlook is turned a bit mixed as GBP/USD failed to break through falling tend line resistance. We'll stay neutral first and assess the outlook again and price actions unfold.
USD/CHF Weekly Outlook
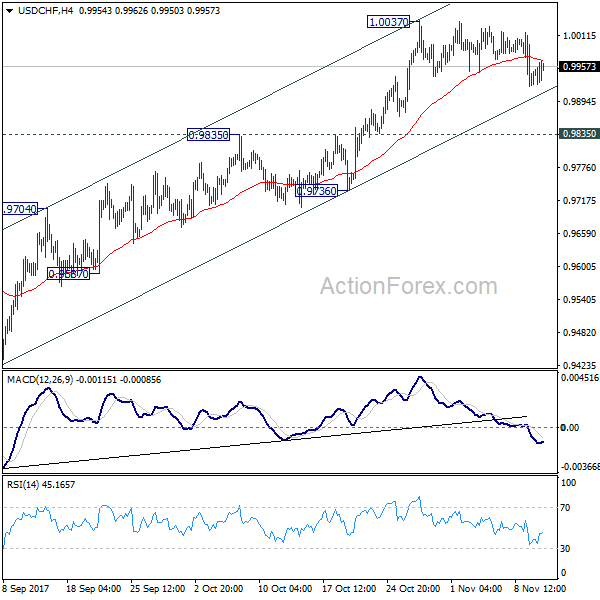
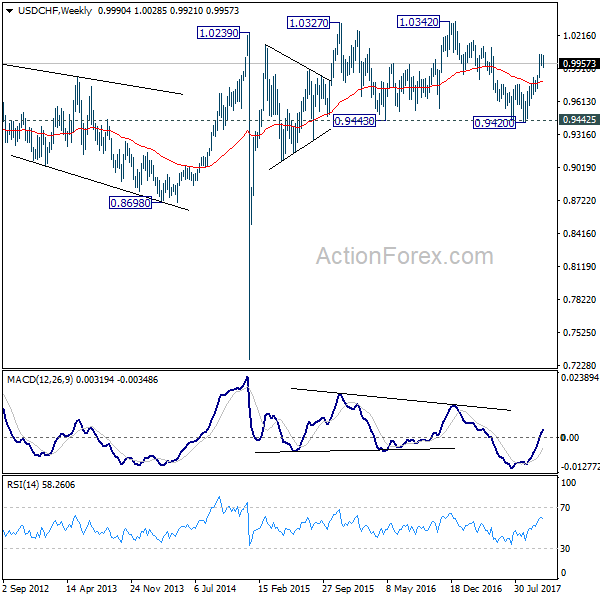
USD/CHF's consolidation from 1.0037 extended last week with a drip. But outlook is unchanged. Initial bias stays neutral this week first. We'd continue to expect downside to be contained above 0.9835 resistance turned support and bring rally resumption. On the upside break of 1.0037 will resume whole rally from 0.9420. And with sustained trading above 61.8% retracement of 1.0342 to 0.9420 at 0.9990, USD/CHF should then target a test on 1.0342 key resistance.
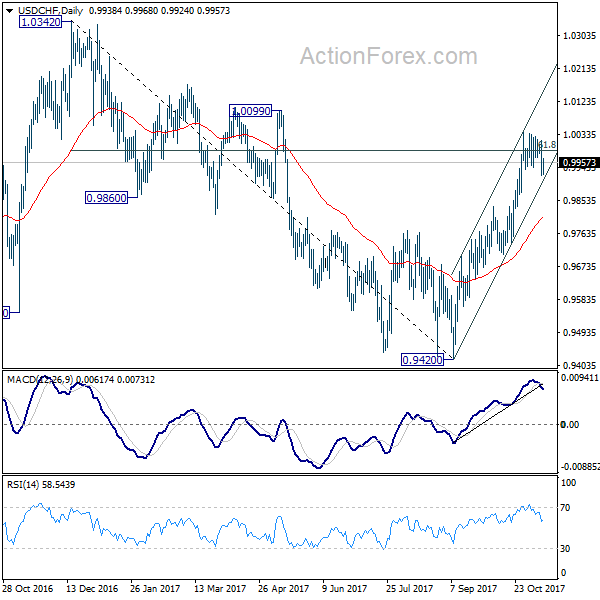
In the bigger picture, current development suggests that USD/CHF has defended 0.9443 (2016 low) key support level again. Rise from 0.9420 could is a medium term up move and should target a test on 1.0342 high. This represents the upper end of a long term range that started back in 2015. On the downside, break of 0.9736 support is now needed to indicate completion of the rise from 0.9420. Otherwise, further rally will remain in favor in medium term.
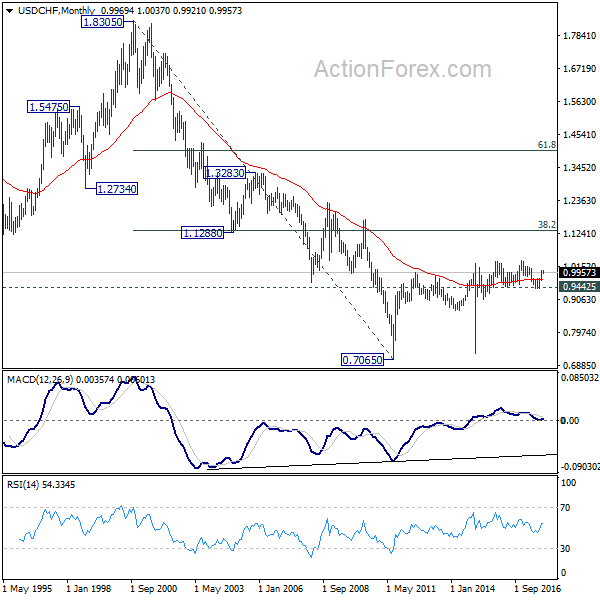
In the long term picture, while upside momentum is unconvincing, with 0.9443 key support intact, rise from 0.7065 (2011 low) is still expected to continue. Break of 1.0342 will target 38.2% retracement of 1.8305 (2000 high) to 0.7065 at 1.1359.
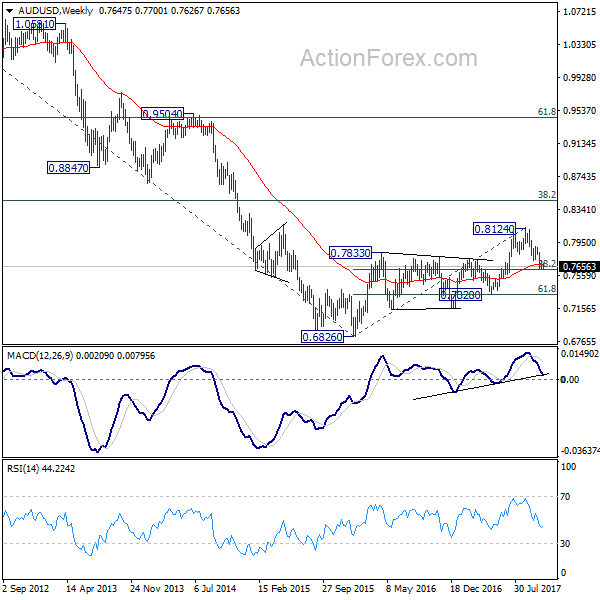
AUD/USD Weekly Outlook
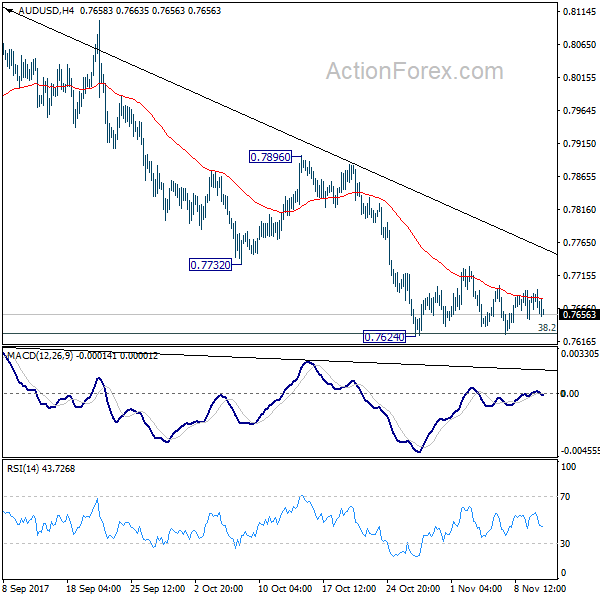
AUD/USD's consolidation from 0.7624 continued last week and outlook is unchanged. Initial bias remains neutral this week first. In case of another recovery, upside should be limited well below 0.7896 resistance to bring fall resumption. On the downside, decisive break of 0.7624 will resume whole fall from 0.8124 and target next key cluster level at 0.7322/8.
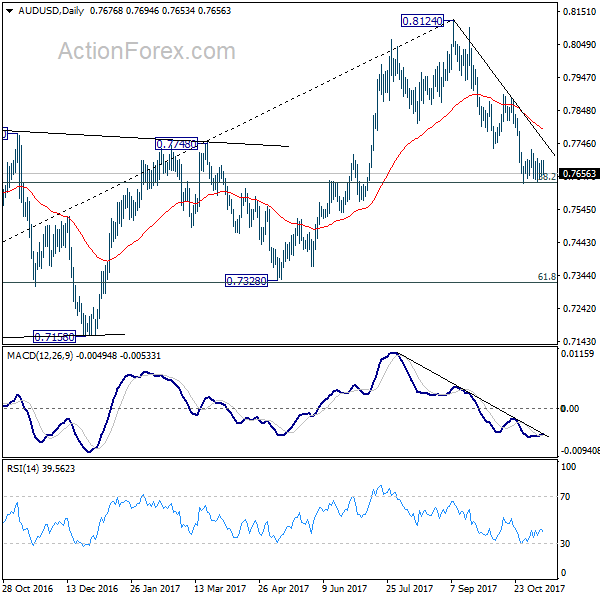
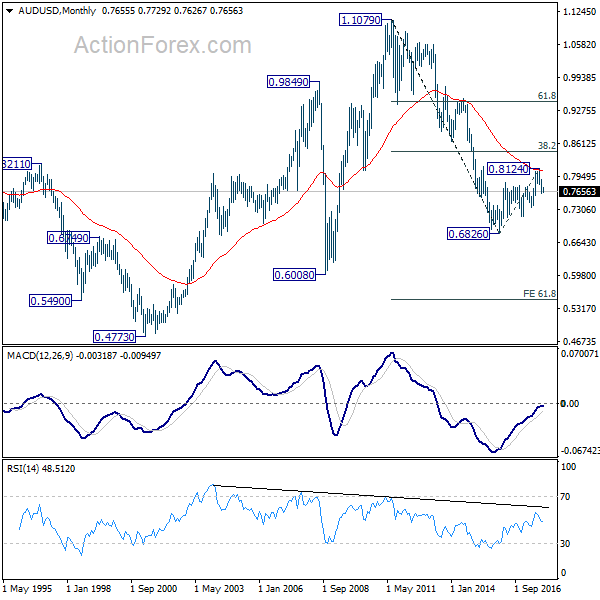
In the bigger picture, corrective rise from 0.6826 medium term bottom is likely completed at 0.8124, after hitting 55 month EMA (now at 0.8067). Decisive break of 0.7328 key cluster support (61.8% retracement 0.6826 to 0.8124 at 0.7322) will confirm. And in that case, long term down trend from 1.1079 (2011 high) will likely be resuming. Break of 0.6826 will target 61.8% projection of 1.1079 to 0.6826 from 0.8124 at 0.5496. This will now be the favored case as long as 0.7896 near term resistance holds.
In the longer term picture, 0.6826 is seen as a long term bottom. Rise from there could either reverse the down trend from 1.1079, or just develop into a corrective pattern. At this point, we're favoring the latter. And, as long as 38.2% retracement of 1.1079 to 0.6826 at 0.8451 holds, we'd anticipate another decline through 0.6826 at a later stage. But strong support should be seen between 0.4773 (2001 low) and 0.6008 (2008 low).
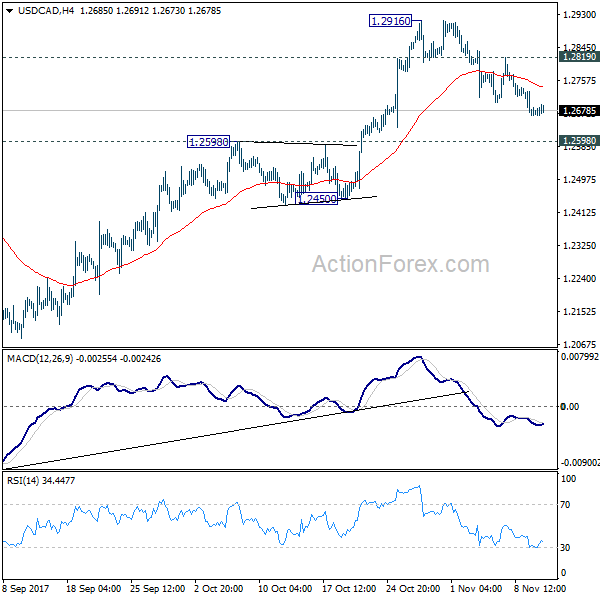
USD/CAD Weekly Outlook
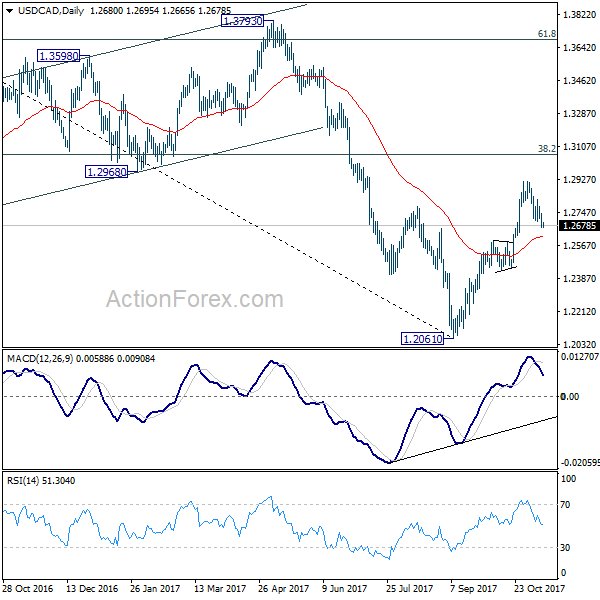
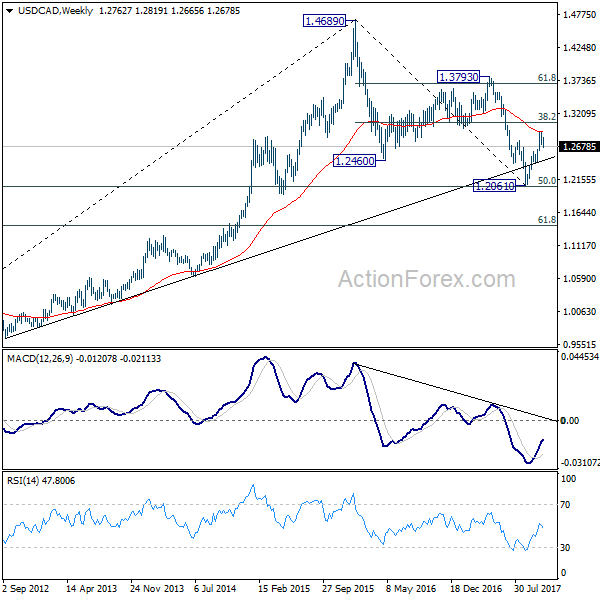
USD/CAD's pull back from 1.2916 extended lower last week but it stayed above 1.2598 resistance turned support so far. Initial bias remains neutral neutral this week first, with bullish outlook. On the upside, above 1.2819 minor resistance will turn bias back to the upside for 1.2916 high first. Break there will extend the rise from 1.2061 to 38.2% retracement of 1.4689 to 1.2061 at 1.3065. However, sustained break of 1.2598 will argue that rebound from 1.2061 has completed after hitting 55 week EMA (now at 1.2916). Near term outlook will be turned bearish in this case.
In the bigger picture, USD/CAD should have defended 50% retracement of 0.9406 (2011 low) to 1.4689 (2016 high) at 1.2048. And with 1.2048 intact, we'd favor the case that fall from 1.4689 is a correction. Rise from 1.2061 medium term bottom should now target 38.2% retracement of 1.4689 to 1.2061 at 1.3065. Firm break there will target 1.3793 key resistance next (61.8% retracement at 1.3685). We'll now hold on to this bullish view as long as 1.2450 support holds.
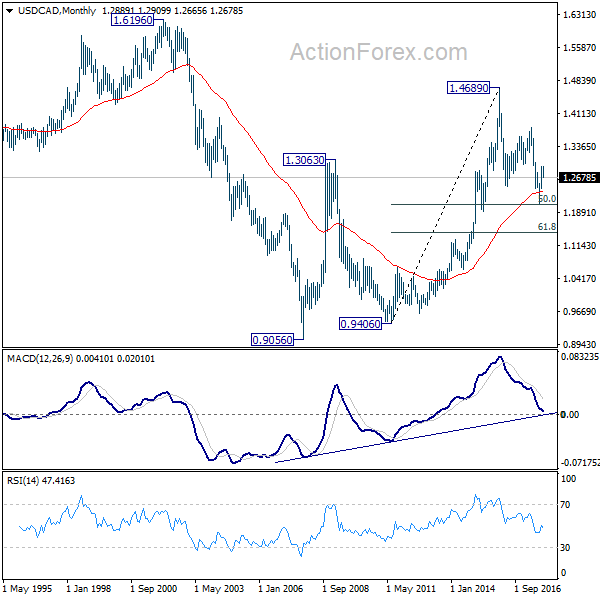
In the longer term picture, current development argues that correction from 1.4689 has completed with three waves down to 1.2061 already. And larger up trend from 0.9056 (2007 low) is still in progress. Firm break of 1.3794 resistance should now indicate up trend resumption through 1.4689 high.
GBP/JPY Weekly Outlook
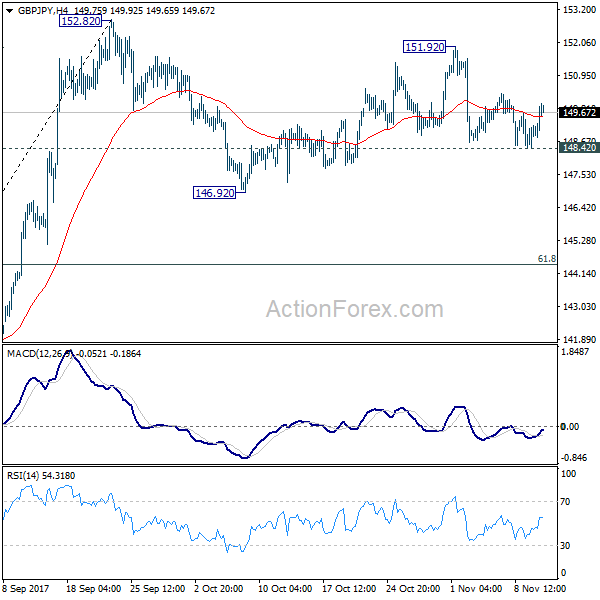
GBP/JPY breached 148.65 minor support last week but quickly recovered. Initial bias is neutral this week first. Overall, it's bounded in consolidation pattern from 152.82. Break of 148.42 support will start the third leg and target 146.92 and below. But we'd expect strong support from 61.8% retracement of 139.29 to 152.82 at 144.45 to contain downside and bring rebound. On the upside, above 151.92 will retest 152.82 high instead.
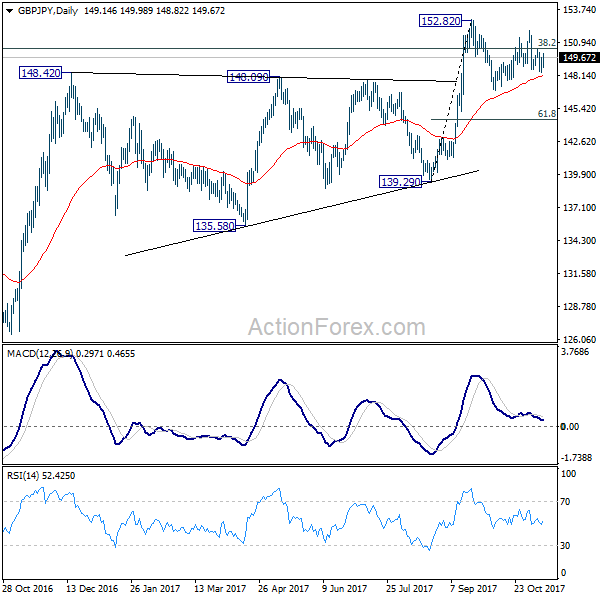
In the bigger picture, medium term rebound from 122.36 is still expected to resume after corrective pull back from 152.82 completes. Firm break of 38.2% retracement of 196.85 to 122.36 at 150.43 will carry long term bullish implications. In that case, GBP/JPY could target 61.8% retracement at 167.78. However, break of 139.29 will indicate rejection from 150.43 key fibonacci level. And the three wave corrective structure of rebound from 122.36 will argue that larger down trend is resuming for a new low below 122.26.
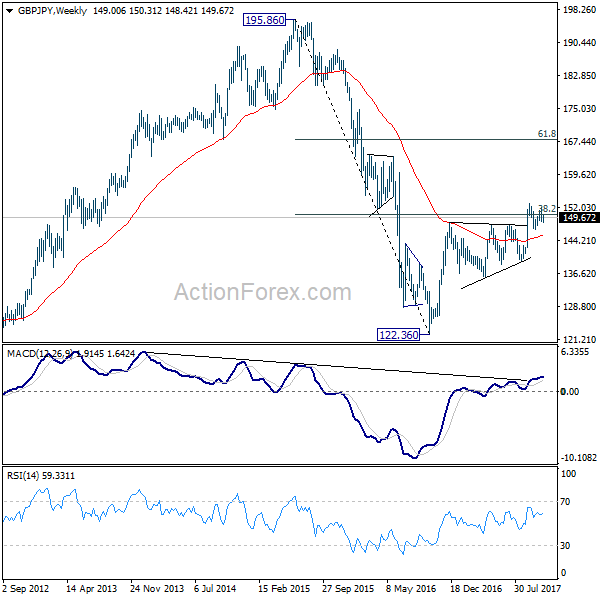
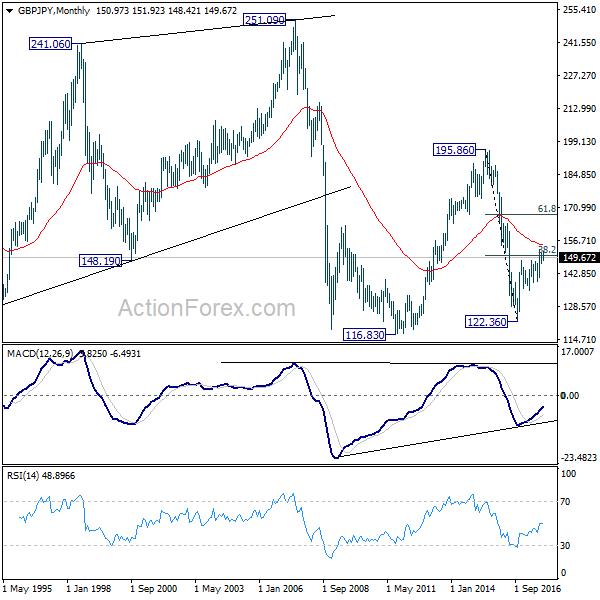
In the longer term picture, current rebound argues that the down trend from 195.86 (2015 high) has already completed at 122.36. Focus is now on 55 month EMA (now at 154.78). Firm break there will suggest that rise form 122.36 is developing into a long term move that target 195.86 again. And, price actions from 116.83 (2011 low) is indeed a sideway pattern that could last more than a decade. However, firm break of 139.29 will suggests that the long term down trend is still in progress and could break 116.83 low ahead.