Sample Category Title
Summary 11/13 – 11/17
Monday, Nov 13, 2017
[php_everywhere] [/php_everywhere]
Tuesday, Nov 14, 2017
[php_everywhere] [/php_everywhere]
Wednesday, Nov 15, 2017
[php_everywhere] [/php_everywhere]
Thursday, Nov 16, 2017
[php_everywhere] [/php_everywhere]
Friday, Nov 17, 2017
[php_everywhere] [/php_everywhere].
Weekly Economic and Financial Commentary: All Quiet on the Domestic Front
U.S. Review
All Quiet on the Domestic Front
- This week's economic release calendar was barren compared to last week's jam-packed schedule. However, what data were released largely confirmed the trends of strong labor market demand, elevated small business confidence behind regulation rollbacks, and credit growth continuing its steady growth as spending builds momentum.
- The job openings rate remained at its all-time high and the Wells Fargo/Gallup Small Business Survey showed high levels of confidence. However, reported difficulty in finding quality labor is consistent with other indicators of a tight labor market.
All Quiet on the Domestic Front
In a light week for economic indicators, the few readings we received pointed to a continuation of solid job growth, sky high small business confidence and steady consumer credit growth as spending remains elevated.
On Tuesday, the JOLTS survey was released and indicated that demand for workers continues exhibiting strength. This is not necessarily a surprising story, given that we are in the midst of the tightest labor market, at just 4.1 percent unemployment, since December 2000. The job openings rate, which is the percentage of openings compared to the total level of employment including open roles, stayed flat on the month at a record high of 4.0 percent (top chart). This speaks not only to the high level of labor demand, but also to the elevated level of total employment, and indicates that the labor market remains on firm ground with room to run. The quit rate rose to 2.2 percent, but has fluctuated around the same level for essentially all of 2017. This could be at least partially driven by an aging workforce as Baby Boomers enter the late stages of their careers, and job changes become less frequent as employees age. An increase in job switches by choice would be an encouraging sign, as it should coax wage growth higher.
The Wells Fargo/Gallup Small Business Index fell 3 points to 103 in Q4, good for the second, only to Q3, strongest reading in the current expansion. Strong small business confidence has been primarily boosted by strong consumer spending driving sales higher, and rollbacks of business regulations under the Trump administration. However, confidence has not been limited to these two areas, as gains have been broadly based. The spider chart (middle) we have developed tracks metrics of small business we believe correspond most closely with capital spending by small businesses. The chart shows nearly all metrics improving from a year ago, and many approaching all-time highs. The encouraging confidence measures among small businesses could indicate an improvement in business fixed investment that would help improve headline GDP growth. The primary issue plaguing small businesses surrounds the availability of quality labor, with 16 percent of owners reporting this as their top concern. Compounding this problem is the high percentage of small business owners planning to increase jobs at their company within the next 12 months at 32 percent, the second-highest reading in the history of the survey. This reinforces September's JOLTS story of high labor demand and the optimism of small business expansion.
Consumer credit grew $20.8 billion in September, beating market expectations and showing the strongest gain since November 2016. The growth was bolstered by revolving and nonrevolving credit and is up 6.6 percent over the year. This supports continued increases in personal consumption, despite lagging income growth. At first glance, credit growth-absent-significant income gains could be construed as a possible snag. However, the debt service ratio, which is essentially a consumer's cost of capital, sits at 5.5 percent of disposable income, well below alltime highs and levels seen in recession.
U.S. Outlook
CPI • Wednesday
Higher gas prices pushed the CPI up 0.5 percent in September, as was widely expected. The combination of refinery outages caused by Hurricane Harvey and Florida's mass evacuation from Hurricane Irma caused a 13.1 percent spike in gasoline prices, which accounted for about three-quarters of the CPI increase in September. Inflation looked pretty anemic outside of the hurricane effects, however.
Excluding food and energy, the trend in the core CPI remained weak. Core CPI rose 1.7 percent over the year, remaining short of the FOMC's 2 percent target. September's inflation readings counted another month without the long-awaited pickup in inflation that should be in the offing given other fundamentals in the economy. It is still widely expected that the Fed will go ahead with increasing the fed funds rate in December, however.
Previous: 0.5% Wells Fargo: 0.1% Consensus: 0.1% (Month-over-Month)
Retail Sales • Wednesday
Harvey and Irma provided a huge boost to retail sales to round out the third quarter. Sales rose 1.6 percent on the month, and even excluding auto sales, were up 1.0 percent. Control group sales, which go into the GDP calculation for personal consumption, rose 0.4 percent, which was a strong rebound after a flat reading in August.
Strong sales in July and September boosted GDP in Q3 significantly as personal consumption added 1.6 percentage points to growth. Hurricanes were not the only reason sales were up so strongly in Q3, but surveys of consumer sentiment have shown an upbeat U.S. consumer encouraged mostly by the strong labor market and income growth prospects. The continued run in the stock market is also supporting optimism. For this reason, we continue to expect the consumer will be a major driver of economic activity in Q4 and into next year.
Previous: 1.6% Wells Fargo: 0.1% Consensus: 0.0% (Month-over-Month)
Housing Starts • Friday
Housing starts declined more than expected in September, to a 1.127 million-unit pace as hurricanes paused building activity in the South. August starts were revised slightly higher though. Permits were also running well ahead of starts in September, which sets the stage for a rebound in coming months.
Repairs of damaged homes do not count as housing starts, although they may affect activity over the next few months by worsening construction labor shortages or driving up building costs, or by causing delays for new projects. We expect more volatility in the fourth quarter.
Residential investment in the GDP calculations declined 6 percent in Q3, and we expect another small decline in Q4 before a rebound in the first half of 2018. The NOAA also predicts another warmerthan- usual winter, which may exacerbate volatility into next spring.
Previous: 1.127M Wells Fargo: 1.167M Consensus: 1.193M
Global Review
The Reserve Bank of Australia's Dilemma
- Even as many other central banks are at various points along the path to normalization, the Reserve Bank of Australia has kept its cash rate at an all-time low since August 2016.
- In this week's Global Review, we discuss the vexing situation for policymakers in Australia, which boils down to this: Low rates have been a factor in driving consumer debt to worryingly high levels. But amid tepid consumer spending and soft inflation, the economy could benefit from even lower rates. However, that remedy could make the consumer spending problem even worse in the long run.
The Reserve Bank of Australia's Dilemma
An evolving theme in global financial markets in the second half of 2017 is that many of the world's central banks are in various stages of removing ultra-accommodative monetary policies. In separate reports over the past week we discuss the varying prospects at the European Central Bank, the Bank of England and the Bank of Korea—all these reports are available on our website.
There are a few holdouts. At its meeting at the end of October, policymakers at the Bank of Japan made it clear that they have no intention to dial back the comprehensive set of accommodative monetary policy measures in place in Japan. Another central bank that is bucking the trend is the Reserve Bank of Australia (RBA).
At its meeting in Sydney earlier this week, the RBA held its cash rate unchanged at 1.50 percent where it has been since August 2016. It was no secret that policymakers would stand pat. Every one of the 27 economists surveyed by Bloomberg correctly anticipated that the RBA would remain on hold. The accompanying statement said that "inflation was likely to remain low for some time," suggesting that the RBA will remain on hold.
With the unique distinction of having avoided a recession during the global slowdown in 2009, the rate environment in Australia has been higher than other parts of the developed world for some time. That is likely to change. If the Federal Reserve raises rates at its December meeting, as we expect it will, the fed funds rate will be the same as the RBA's cash rate for first time since 2001.
We wrote in April that the RBA was in a Catch-22, because after cutting rates to stimulate growth, households had taken on too much debt as low interest rates helped fuel a sharp rise in house prices which could hold back consumption. The trouble is that additional rate cuts risks even more piling-on of debt.
In the latest manifestation of this dilemma, RBA Governor Philip Lowe said this week that a "continuing source of uncertainty is the outlook for household consumption." This was evident in the September retail sales figure released last week, which showed no change. This followed a 0.6 percent monthly decline in the prior month which had most analysts looking for a bounce.
Our currency strategists think the negative influences of monetary policy dynamics on the Aussie dollar will be outweighed by the positive influences from the strengthening in commodity prices and, on that basis, they anticipate a modestly stronger Australian dollar over time. This makes the vexing challenges for the RBA even harder, as any foreign exchange pass-through effect would put downward pressure on already-low inflation.
The upside for Australia is that the labor market is firming and the unemployment rate has been trending lower over the past year, although that has not yet translated into significant wage gains. A firming in global growth may also translate into stronger exports for the resource-rich Australian economy.
Stuck between needing to stimulate the economy through lower rates yet not wanting to drive household debt even higher, we expect the RBA to remain on hold well into 2018.
Global Outlook
China Industrial Production • Monday
Markets will be watching news coming from China early in the week as the country is slated to release the industrial production index for October on Monday. The year-over-year growth rate started to trend downward in July but reversed its course in September of this year, increasing from 6.0 percent in August to 6.6 percent in September. An improvement from September's reading would probably be greeted favorably as market analysts are expecting industrial production growth to slow down a bit on a year-over-year basis, to 6.2 percent.
On the same day the country is also releasing the retail sales data. Retail sales rose 10.3 percent in September and markets are expecting sales growth to be up a bit, to 10.4 percent. Retail sales have been growing at a 10 to 11 percent rate, year over year, for the past several years, and thus, we do not expect any departure from these rates.
Previous: 6.6% Consensus: 6.2% (Year-over-Year)
Japan Q3 GDP • Tuesday
The Japanese economy surprised markets in Q2 with a relatively strong performance, growing 0.6 percent, not annualized and by 2.5 percent annualized. This was the strongest performance by the Japanese economy since the first quarter of 2015, when it grew at an annualized rate of 4.6 percent.
Today, markets are expecting the economy to have slowed down a bit during Q3, with a market consensus estimate of 1.5 percent annualized. Our forecast is for a 1.6 percent annualized rate for the quarter, as we expect some payback from the strong performance of Q2.
Of course, any improvement in Q3 from the rate we saw in Q2 will greatly help the global economic cause for a continuous improvement in economic conditions. However, we will not hold our breath for it.
Previous: 2.5% Wells Fargo: 1.6% Consensus: 1.5% (Quarter-over-Quarter, Annualized)
Eurozone Industrial Production • Tuesday
There are several data points coming out next week from the Eurozone. One of these data points is industrial production for September. The industrial sector was relatively strong in August, increasing 1.4 percent on a seasonally adjusted basis. This impressive result was reflected in the flash GDP release for Q3 which was stronger than the consensus was expecting. Preliminary results for GDP will also be released on Tuesday and will probably reaffirm the relatively strong performance of the flash release.
On the same day, the region will also release the result for the ZEW expectations survey for November. The survey declined in October, to 26.7 compared to 31.7 in September. Furthermore, the index weakened a bit in the third quarter compared to the second quarter and started on a weak note in Q4. Thus, an improvement in expectations in November could be a positive sign for the rest of the year.
Previous: 1.4% Consensus: -0.6% (Month-over-Month)
Point of View
Interest Rate Watch
Flatter Yield Curve Raises Eyebrows
New cycle lows in the 2s/10s spread brought the flattening in the yield curve back into focus this week. The difference between the yields on 10-year and 2-year Treasuries fell to 69 bps earlier this week, which is 16 bps narrower than a month ago and the lowest level since 2007 (top chart).
While the yield curve remains far from inverted, the decline in the 2s/10s spread back to 2007 levels, as well as flattening in other parts of the yield curve, has raised concerns about the outlook for growth. Our probit model of the chance of a recession in the next months using the yield spread between 10-year Treasuries and 3-month T-bills is below 10 percent.
Further Flattening Ahead
Our forecast for the U.S. economy does not call for a recession over the next two years, but we do expect the yield curve to flatten further (middle chart).
The FOMC is widely expected to hike rates again in December, with the current market probability above 90 percent. There is less of a consensus for 2018, with the median estimate from the FOMC projecting three hikes next year and markets currently penciling in only one hike. We take a middle view and anticipate two rate increases next year, but the bottom line is that short-term rates will likely move higher next year.
Longer-term rates should also rise as U.S. growth strengthens, but we expect to see further curve flattening. The slow pace of Fed tightening from what are already low levels of rates may continue to push some investors to extend duration. At the same time, low interest rates around the world continue to make U.S. Treasuries look relatively attractive (bottom chart). Foreign net purchases of long-term Treasuries have on average been positive this year. A third factor limiting the rise in longer-term Treasury rates is the persistence of low inflation, leading investors to demand lower inflation compensation.
While the yield curve is expected to flatten further on trend in the coming months, a significantly wide federal deficit and/or pickup in inflation could upset the pace and degree of flattening.
Credit Market Insights
Mixed Credit Standards in Q3
The Federal Reserve's October 2017 Senior Loan Officer Opinion Survey (SLOOS) portrayed varied lending practices among households and businesses.
Banks reported relaxing lending standards on business commercial and industrial (C&I) loans for the third consecutive quarter, as demand continued to weaken. Increased strength in business investment suggests firms turned to other sources of funding to fuel capital spending. The loosening in lending standards, coupled with the positive outlook for business investment, should drive C&I loan demand higher in the future.
The loosening of lending standards for residential mortgages, yet a tightening of credit card and auto loan standards were reported, while demand remained basically unchanged. Mortgage demand remains weak, as softness persists in existing home sales. As individuals act on the damage of recent hurricanes, demand rose for auto loans.
Banks attribute credit tightening to uncertainties surrounding the economic outlook, possible portfolio deterioration and reduced risk tolerances. But, increases in demand growth can be expected, as a rise in consumer confidence is matched with weakened funding abilities. Such explanations, in line with surges in confidence figures, along with modest wage growth, is driving consumers to run down savings rates or increase borrowing to sustain levels of consumption.
Topic of the Week
Will Trade Deals Close the Trade Deficit?
President Trump is presently in the midst of a 13-day trip to Asia during which he will visit Japan, South Korea, China, Vietnam and the Philippines (hereafter "Asia-5"). One of the expressed purposes of the trip is to discuss U.S. trade relations with these important trading partners, and the president has already closed some deals that will be welcomed by the affected American businesses. The administration is also hoping that the deals will help close the gaping U.S. trade deficit.
As shown in the top chart, the value of American imports of goods exceeded the value U.S. goods exports by $735 billion in 2016 (i.e., the United States incurred a $735 billion trade deficit last year). More than half of this trade deficit was accounted for by the Asia-5 countries. So anything that can be done to encourage more American exports to these countries will lead to a narrower trade deficit, correct?
Not so fast. Macroeconomic theory shows that a country's current account balance is identically equivalent to its savings-investment imbalance. As shown in the bottom chart, the U.S. current account deficit widened during the past decade as the country's rate of investment increasingly outstripped its savings rate. The current account deficit has narrowed in recent years as the savings imbalance has become less extreme. That said, the national savings rate in the United States continues to fall short of the national investment rate. In short, the United States incurs a current account deficit because it does not save "enough." The Asia-5 incurs an aggregate current account surplus because it saves "too much" in aggregate.
Trade deals do little to change a country's savings and investment rates. Unless the underlying savingsinvestment imbalance is corrected, a country will continue to incur a current account imbalance. Until the American household, business or public sectors begin to save more and/or investment weakens, the United States will continue to incur current account deficits.
The Reserve Bank of Australia’s Dilemma
An evolving theme in global financial markets in the second half of 2017 is that many of the world's central banks are in various stages of removing ultra-accommodative monetary policies. In separate reports over the past week we discuss the varying prospects at the European Central Bank, the Bank of England and the Bank of Korea - all these reports are available on our website.
There are a few holdouts. At its meeting at the end of October, policymakers at the Bank of Japan made it clear that they have no intention to dial back the comprehensive set of accommodative monetary policy measures in place in Japan. Another central bank that is bucking the trend is the Reserve Bank of Australia (RBA).
At its meeting in Sydney earlier this week, the RBA held its cash rate unchanged at 1.50 percent where it has been since August 2016. It was no secret that policymakers would stand pat. Every one of the 27 economists surveyed by Bloomberg correctly anticipated that the RBA would remain on hold. The accompanying statement said that "inflation was likely to remain low for some time," suggesting that the RBA will remain on hold.
With the unique distinction of having avoided a recession during the global slowdown in 2009, the rate environment in Australia has been higher than other parts of the developed world for some time. That is likely to change. If the Federal Reserve raises rates at its December meeting, as we expect it will, the fed funds rate will be the same as the RBA's cash rate for first time since 2001.
We wrote in April that the RBA was in a Catch-22, because after cutting rates to stimulate growth, households had taken on too much debt as low interest rates helped fuel a sharp rise in house prices which could hold back consumption. The trouble is that additional rate cuts risks even more piling-on of debt.
In the latest manifestation of this dilemma, RBA Governor Philip Lowe said this week that a "continuing source of uncertainty is the outlook for household consumption." This was evident in the September retail sales figure released last week, which showed no change. This followed a 0.6 percent monthly decline in the prior month which had most analysts looking for a bounce.
Our currency strategists think the negative influences of monetary policy dynamics on the Aussie dollar will be outweighed by the positive influences from the strengthening in commodity prices and, on that basis, they anticipate a modestly stronger Australian dollar over time. This makes the vexing challenges for the RBA even harder, as any foreign exchange pass-through effect would put downward pressure on already-low inflation.
The upside for Australia is that the labor market is firming and the unemployment rate has been trending lower over the past year, although that has not yet translated into significant wage gains. A firming in global growth may also translate into stronger exports for the resource-rich Australian economy.
Stuck between needing to stimulate the economy through lower rates yet not wanting to drive household debt even higher, we expect the RBA to remain on hold well into 2018.
The Weekly Bottom Line – Tax Bills: When Two Is Not Better Than One
U.S. Highlights
- With little to digest on the data front, attention was devoted to political developments this week. Stock markets remained upbeat through Wednesday, given optimistic expectations on tax reform, supportive earnings reports and gains among energy stocks.
- However, market sentiment turned down thereafter, as developments on tax reform failed to meet expectations, given key differences between the House bill and the newly-released Senate bill.
- While tax reform will remain top of mind in the days ahead, a number of important data releases next week will help tilt the narrative back toward economic fundamentals, with emphasis placed on the upcoming CPI report.
Canadian Highlights
- The WTI crude oil benchmark jumped to over $57 per barrel, reaching the highest level seen since mid-2015.
- In a speech this week, Governor Poloz maintained a dovish tone, focusing on the softness in inflation. Further rate hikes remain highly data dependent.
- Housing starts increased in October, erasing some of September's decline. However, with higher interest rates and new B20 measures weighing on demand, starts are likely to gradually slide in the coming quarters.
U.S. - Tax Bills: When Two Is Not Better Than One
This week was exceptionally quiet in terms of economic data. There were no primary reports released and second-tiers did little to spur market action. On that front, JOLTS job openings and weekly jobless claims saw little change, while consumer sentiment (U. of Michigan) pulled back in early November but remained upbeat at 97.8 - a level marking the second-highest reading this year. With little else to digest on the data front, attention was devoted to political developments.
Markets remained upbeat through midweek, given optimistic expectations on tax reform, supportive earnings reports and gains among energy stocks. The latter were buoyed by a surge in crude oil prices, with rising geopolitical uncertainty in the Middle East, particularly in Saudi Arabia, being the main catalyst behind the move (Chart 1). Global demand has been strong and OPEC discipline is expected to continue, but the risks for oil prices are skewed to the downside as non-OPEC production is on the rise, particularly U.S. shale. The EIA reported that U.S. production reached 9.62 million (B/D) last week, which is at the top range of historical highs.
Market sentiment followed a more downbeat tone later in the week, as developments on tax reform, which appeared to overshadow headlines from the President's Asia trip, failed to meet expectations. While the Ways and Means Committee advanced the House bill on Thursday, preparing for a vote by the full House next week, the Senate released its own version of the bill, with preliminary reporting pointing to some key differences among the plans. For instance, the Senate bill retains the current seven-bracket income tax structure with a new top rate of 38.5% as opposed to the reduced four-bracket structure in the House bill, it doubles the estate tax exemption but does not eliminate it after 2024, and it eliminates state and local tax deductions (SALT) without keeping a 10k deduction on property tax. Moreover, the Senate bill would delay corporate tax cuts to 2019 as opposed to implementing them in 2018, and takes a different approach on pass-through taxation, creating a new 17.4% deduction, as opposed to lowering the rate to 25% as in the House bill.
In short, there are enough differences between the two bills to make immediate passage less likely. Much rides on tax reform, with expectations for major change being one of the main supporting factors behind the impressive post-election gains in stock markets (Chart 2). As such, the delay is likely to weigh on near-term sentiment, with prospects for a later introduction of corporate tax cuts of particular concern to investors.
Tax reform is likely to remain top of mind in the days ahead, but a number of important data releases next week will help tilt the narrative back toward economic fundamentals. Hurricane-related volatility should begin to taper off in upcoming reports, supporting the Fed's decision-making process. With the economy still on a solid course and the labor market tightening further, we remain of the view that the Fed will hike rates once more by year's end. But, this will require some cooperation from inflation metrics, with the emphasis placed on next week's CPI report.
Canada - Oil Prices Hit A 2-year High
It was a fairly quiet week in Canada, with housing starts data and a speech from Bank of Canada Governor the only major events. Still, the S&P/TSX managed to hit a record high early in the week, helped along by rising oil prices. The WTI benchmark jumped nearly $2 to over US$57 per barrel - the highest level seen since mid-2015.
There has been some fundamental support for oil prices recently as OPEC and the group of non-OPEC members indicated that they plan to extend production cuts through the end of 2018 in order to ensure the market returns to a more balanced position. But the jump this week was triggered by Saudi Arabia's King ordering the arrest of several royal, political, and business officials in an attempt to crackdown on corruption. This sparked concern in the market over the stability in one of the world's top oil producing countries, and signaled to markets that power in the kingdom was consolidating with those in favour of extending production cuts.
Given that the latest move up has been based more on geopolitical risk rather than proof of an improvement in the global market balance, prices are unlikely to gain much more ground. Moreover, with prices at current levels, non-OPEC producers - particularly US shale producers - are likely to increase hedging activity, supporting higher production going forward. What's more, OPEC's latest forecast shows US output expected to grow at a faster pace than previously thought, slowing the overall balancing process. All told, there is more downside risk for oil prices than upside, with prices just over US$50 per barrel likely for the foreseeable future.
Oil's steep rise has not benefited the Canadian dollar, with the typical positive relationship between the two having broken down in recent weeks. It appears as though the loonie is responding more to monetary policy expectations at present. On that front, following two rate hikes earlier this year, the Bank of Canada has switched to a more dovish tone. In his speech this week, Governor Poloz focused on the softness in inflation, but also maintained 'optionality' going forward, consistent with data dependence as it ensures the economy is unfolding as expected. The risks to the Canadian economy are skewed to the downside, with uncertainty surrounding NAFTA and recently implemented/announced measures aimed at cooling the housing market two key risks. Still, our (and the Bank of Canada's) forecast is for continued economic growth, and at this point we continue to expect another rate hike in early-2018.
This will add to the tightening in monetary policy that has already occurred this year, as well as the new B20 measures that are set to come into effect in January. As such, demand for housing is expected to slow in the coming quarters. Housing starts data out this week showed a slight bounce back in October, erasing some of September's decline. The 6-month moving average is now sitting at 217k units, which is a healthy pace of homebuilding activity. But, given the headwinds facing demand, starts are likely to edge down over the next year as they move toward more demographically sustainable levels.
U.S.: Upcoming Key Economic Releases
U.S. Consumer Price Index - October
Release Date: November 15, 2017
Previous Result: 0.5% m/m, core 0.1% m/m
TD Forecast: 0.1% m/m, core 0.2% m/m
Consensus: 0.1% m/m, core 0.2% m/m
We expect headline CPI inflation to slip back to 2.0% y/y in October, with prices up 0.1% m/m. Energy prices should be a drag, led by declines in gasoline prices which will give back some of their hurricane-induced strength. We expect core CPI to print a 0.2% m/m increase though serial disappointment keeps us cautious. A firmer read in October is possible on a rebound in core goods prices, helped by higher vehicle prices. Shelter prices, which moderated in September, also have scope for a pickup, keeping the upward pull in core services in check. We expect core inflation to be stable at 1.7% y/y.
U.S. Retail Sales - October
Release Date: November 15, 2017
Previous Result: 1.6%, ex-auto 1.0%, control 0.4%
TD Forecast: 0.3%, ex-auto 0.2%, control 0.4%
Consensus: 0.0%, ex-auto 0.2%, control 0.3%
We believe another strong retail sales report is in the cards for October, with headline sales rising 0.3% on a solid 0.4% in the core control group. The August-September hurricanes that propped up spending in September, specifically for autos, grocery stores and restaurants, and building materials, have scope for a sustained tailwind into October. New vehicle sales should be only a modest drag as the reported figures showed a smaller than expected moderation (18.0m vs 18.5m), offloading a solid landing for Q4 consumer spending. Gasoline station receipts should also lend a negative contribution on lower gasoline prices. We expect the report to reinforce Q4 real PCE tracking estimates near a 2% pace.
Canada: Upcoming Key Economic Releases
Canadian Manufacturing Sales - September
Release Date: November 16, 2017
Previous Result: 1.6% m/m
TD Forecast: -0.7% m/m
Consensus: -0.2% m/m
Manufacturing sales for September will be distorted by labour market disruptions in motor vehicle production. We look for a pullback of 0.7% on the month, with the transportation sector driving the decline. General Motors workers were on strike for roughly half of the month which could leave factory sales of motor vehicle down 5-10% m/m in line with the performance in exports. However, energy products will provide a key offset due to increased foreign demand and a sizeable tailwind from gasoline prices. Outside of motor vehicles and energy, we see few reasons to be upbeat. Ex-petrol producer prices saw a broad decline in September and hours worked in manufacturing were on the weak side. Manufacturing sales should see a more modest pullback in real terms. This will provide a soft handoff to Q4 though we still see exports rebounding due to one-off factors that hampered auto production in the third quarter.
Canadian Consumer Price Index - October
Release Date: November 17, 2017
Previous Result: 0.2% m/m, 1.6% y/y
TD Forecast: 0.0% m/m, 1.3% y/y
Consensus: 0.1% m/m, 1.4% y/y
Headline CPI was likely flat on the month, reflecting a drag from gasoline prices, which would cause the headline inflation rate to slow to 1.3% y/y vs 1.6% y/y due in part to unfavourable base effects. Headwinds from the past strengthening in the Canadian dollar - non-petroleum import prices fell by 20% annualized in Q3 - are built into this forecast as well. Sector-specific effects also pose downside risks, such as a continued decline from telephone services prices due to heightened competition in the sector from the unveiling of cheaper data plans. Meanwhile, we expect shelter prices to gain steam after a relatively weak month, in line with the resurgence in housing activity in Toronto and Vancouver. Food prices also have scope for sustained strength though remain vulnerable to past exchange rate appreciation. Special attention will be given to exclusion-based core measures (ex food and energy and CPIX) which are currently underperforming the BoC's preferred core measures - an indication that transitory one-off factors are driving the recent disappointment in inflationary pressures. These factors will be important to keep in mind in the months to come as further weakness could stay the Bank's hand. But alongside sustained improvement in the trend-based measures, which suggests that slack continues to dissipate, we expect the BoC to look through below-target inflation, setting the stage for a January rate hike. It should also be noted that even with the past sources of downward pressures, 2% inflation remains in sight with our current forecast now showing inflation back to target as early as March.
Another Taxing Week Ahead
The Dollar always seems to struggle in the absence of tier one US economic data, so fortunately for the dollar bulls next week will offer up both US CPI and Retail sales. But given that the underlying inflation is expected to remain muted, the risk is skewed to a more significant upside response whereas only considerable downside miss on the print will rattle December rate hike expectations. But for the greenback's near-term fortunes, there is no escaping the Tax Reform torrent as next week will likely bring a vote in the House to set the stage for the Senate showdown. As far as markets are concerned, the mood will be established by the probability of passage as opposed to content within at this stage.
Digesting the US tax reform is an unpalatable experience for most as the noise triggers tightly correlated moves amongst all asset classes which has traders jumping from screen to screen.The fact is in this low volatility world even the smallest shock can help trigger an outsized move, and that's what we saw over "Taxing Thursday". But with equity markets at the significantly stretched levels and Christmas just around the corner, investors will be more inclined to book year-end profits adding to sell-offs momentum, so we could see more of these mini-meltdowns heading into year-end.
Similarly, currency traders will be looking to book profits early this year given the most of the confident USD drivers have run their course. I suspect if next weeks US CPI print fails to trigger more Fed tightening expectation into 2018, that should be a signal for the dollar bulls to unwind gradually.
The Australian Dollar
While next weeks focus will be on the Australia employment data, I suspect more interest will centre on Deputy Governor Guy Debelle speech which comes on the heels of the SOMP that gave little reason to buy the Aussie dollar. But unless there is an abrupt shift in RBA rhetoric, a sidelined RBA should be cause enough to sell the AUD.
The New Zealand Dollar
An intense focus will remain on the Kiwi as the recent wave of post RBNZ NZD cross buying got hosed down on the back of yesterdays comments from Finance Minister Robertsons where he said that the dual mandate could result in looser policy in specific situations. Any thought of RBNZ uncertainty fading into the background after the CB struck an upbeat chord at last weeks OCR was quickly extinguished on Robertson's verbosity.
The Japanese Yen
Price action around the tax reform headlines will continue to be exigent especially when prices move within a stone's throw of 113.00. But logic dictates lawmakers will pass tax reform in some form or another knowing the ensuing market meltdown is on there watch if they fail to do so. With that in mind, we should expect dips to remain supported, but with an increasing number of stops entering the picture just below 113, a break of this tipping point suggests things will get messy quickly.
The Euro
No shortage of ECB dissenter Hawks flying into the picture this week as the bank's dovish taper becomes a distant memory. And with the USD all but stuck in the muck on tax delays, the Euro appears positioned to test 1.1700 in the coming days. But with USD CPI and Retails sales on tap next week, the most obvious path for the EUR appreciation would be via the Aussie dollar given the apparently dormant RBA
The Malaysian Ringgit
Although the MPC kept rates on hold as expected, BNM did validate our view that the Malaysian Economy is on solid footing by sounding very upbeat on growth. .Overall the market interpreted this as a hawkish MPC and pointing to a Jan 25 rate hike.But if Malaysia's economic performance continues to overshoot expectations, look for markets to price in one additional interest rate hike in 2018 which will offer even more support to the MYR.
Favourable macro conditions support the Ringgits latest rally while rising OIL prices come as a bonus. On the dollar side of the equation, the GOP internal squabbles over tax reform will continue to hang like an anvil around the dollar's neck near term and should play favourably for the regional basket.
However, the most significant headwinds for the MYR will continue to come from being a faster rise in the US dollar than expected and or a sudden drop in energy prices.
In the meantime, the broader uptick in interest rate differentials will favour the MYR, and with the BNM tacitly indicating a stronger currency could fend off inflationary pressures, by all accounts, the BNM is welcoming a stronger Ringgit.
US Tax Uncertainty Hammers Dollar
Republican House and Senate tax plans differ
The US dollar depreciated against majors in a week that had few economic indicators for investors to digest and left the market speculating about the chances of a US tax overhaul and the impact of the developments in Saudi Arabia over the weekend. The week of November 13 to 17 will bring to light important data releases. Inflation figures from the United Kingdom, the US and Canada will be the main events.
The UK's Office for National Statistics will release the consumer price index (CPI) on Tuesday, November 14 at 4:30 am EST. The rise of inflationary pressure prompted the Bank of England (BoE) to hike rates for the first time in a decade. UK inflation is expected to come in at 3.1 percent in October.
The US Bureau of Labor Statistics will publish the change in consumer prices on Wednesday, November 15 at 8:30 am EST. At the same time the US Census Bureau will release the monthly retail sales data. Core inflation is forecasted to come in at 0.2 percent on a monthly basis adding up to a 1.7 percent year to year comparison. Core retail sales are expected to have gained 0.2 percent in October.
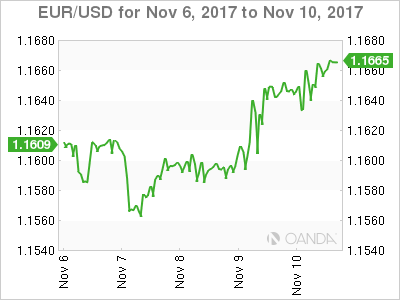
The EUR/USD gained 0.51 percent in the last five days. The single currency is trading at 1.1667 after a week of few economic data releases leaving the market to value the impact of political events. The US tax reform that at one point had revived the USD rally is slowing down hard with doubts rising on the ability of Republican lawmakers to turn the proposal into legislation.
The USD had risen more than 4 percent against major pairs in September, but has slowly given some of those gains back as the Republican House and Senate proposals diverge with little time to hammer the differences.
The economic calendar in Europe will be quiet leaving the attention of the market to focus on inflation in the UK and the US. The U.S. Federal Reserve is expected to raise rates at the end of its December meeting, but the move has already been priced in. Strong signs of US inflation would keep the rate hike on the table and give some momentum to Jerome Powell's term at the head of the central bank when his term begins in February.
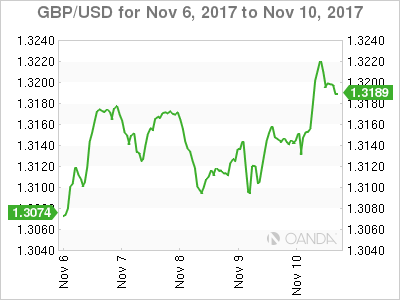
The GBP/USD gained 1.03 percent this week. The currency pair is trading at 1.3211 and gained 0.39 on Friday alone after the UK manufacturing production and goods trade balance releases. The ONS published a 0.7 percent gain of monthly manufacturing gain beating expectations of a 0.3 percent rise. The balance of imported versus imported goods in the UK shrank for the first time in 5 month. The weakness in the pound has helped boost the manufacturing numbers as exports also become more competitive.
Softer Brexit hopes rose on Friday as EU chief Brexit negotiator Michel Barnier issued comments on the possibility of trade talks still happening in December. The divorce between the EU and the United Kingdom is slowly inching forward, but with little progress on an amicable split. Adding drama to the proceedings the author of Article 50 Lord Kerr, a former UK ambassador to the European Union suggests that there is still a chance to withdraw the bill. With Theresa May's hold on the conservative party weakening these comments will not help her cause. Although she supported to Remain in the EU, the fact that she was victorious in a Prime Minister race in the aftermath of the referendum.
The Bank of England (BoE) hiked rates by 25 basis points to 0.50 percent on November 2 under pressure from inflation who sits at 3 percent, when the target from the central bank is 2 percent. The bank remains concerned about the potential fallout when the UK leaves the European Union, but it is limited in what it can actually do to shore up the economy. The release of the UK inflation data next week will be the focus of pound traders as they keep monitoring the ongoing Brexit saga for any potential downside risks.
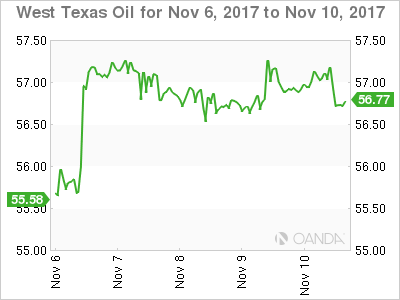
The price of oil remains above the $56 price level on Friday. West Texas Intermediate surged on Monday after the news of the arrests of influential princes and politicians were made public. As part of a corruption sweep ordered by the Saudi Crown Prince Mohammed bin Salman. The prince has quickly landed on the global scene and has been the driving force behind the biggest initiatives at the Organization of the Petroleum Exporting Countries (OPEC) but also the aggressive diplomatic style putting an embargo against Qatar.
Political uncertainty in one of the world's largest producers of oil has taken prices higher. The price has been kept in a new range given the ample supply still in existence. US weekly inventories showed a surprise buildup on Wednesday. The price of West Texas has been stable at the new trading range and will be sensitive to additional information on the Kingdom's future.
Market events to watch this week:
Monday, November 13
- 9:00pm CNY Industrial Production y/y
Tuesday, November 14
- 4:30am GBP CPI y/y
- 8:30am USD PPI m/m
Wednesday, November 15
- 4:30am GBP Average Earnings Index 3m/y
- 8:30am USD CPI m/m
- 8:30am USD Core CPI m/m
- 8:30am USD Core Retail Sales m/m
- 8:30am USD Retail Sales m/m
- 8:30am 10:30am USD Crude Oil Inventories
- 7:30pm AUD Employment Change
Thursday, November 16
- 4:30am GBP Retail Sales m/m
- 8:30am USD Unemployment Claims
Friday, November 17
- 8:30am CAD CPI m/m
- 8:30am USD Building Permits
*All times EDT
Dollar Drifts Lower; Pound Heads up as Barnier Sets a Deadline on Divorce Bill
The dollar was on track to finish the week in the red against its major counterparts after three weeks of rising as uncertainties around the US tax overhaul continued weighing on the markets and disappointing readings on the Michigan Consumer sentiment also pressured the dollar. On the other hand, the pound was the biggest winner during the European session as Brexit talks did not conclude bitterly, with the EU Brexit negotiator setting a deadline for the UK to clarify its financial obligations, while upbeat industrial production and trade figures out of the UK provided further support.
Concerns over a delay in the implementation of the US corporate tax cuts gained momentum after the Senate plan submitted on Thursday differed in key areas from the House version, revealing that corporate tax cuts might not take effect until 2019. The dollar index extended its losses during the session, falling to a fresh one-week low of 94.13 in the wake of worse-than-expected preliminary data on Michigan consumer sentiment. Particularly, the index declined by 2.2 points to 97.8, below the 100.7 reading of the previous month. The index measuring consumers' expectations for future economic conditions decreased to 87.6, while forecasts were for the gauge to remain steady at 90.5.
Dollar/yen retreated by 0.19% to 113.26.
Meeting the Brexit Secretary, David Davis, in Brussels on Friday, the EU Brexit negotiator, Michel Barnier, said that Brexit talks have achieved "some progress" but still more work needed to be done for the talks to move to trade relations. Moreover, he asked Britain to clarify its financial obligations to the EU within two weeks before he considers whether "sufficient progress" has been made ahead of the EU summit in December. Earlier, the UK Prime Minister, Theresa May, unveiled her plans to set an official date and time on the UK's departure from the EU.
In economic news, the UK's industrial production expanded by 2.5% y/y in September, recording the highest rise since February, while previous marks were also revised upwards. Expectations were for a growth of 1.9%. Month-on-month, industrial output increased by 0.7%, while analysts projected the measure to post the same growth as the previous month at 0.3%. Production in the manufacturing sector also surpassed expectations, rising by 2.7% y/y and 0.7% m/m, whereas construction activities missed forecasts, with the relevant output contracting by 1.6% m/m, driving the yearly expansion down from 3.9% to 1.1%.
Regarding trade data, Britain's trade deficit narrowed to 11.25 billion pounds, while analysts expected the measure to widen by 0.45 billion to 12.80 billion pounds.
The pound exited its consolidation phase recorded during the Asian session, advancing by 0.42% on the day to a one-week high of $1.3211.
The euro jumped by 0.27% to $1.1672 on the back of a weaker dollar.
The aussie partially reversed earlier losses after the RBA cut its inflation forecasts, climbing to $0.7677. Its New Zealand cousin also pared some losses, moving up to $0.6948.
Turning to commodities, oil prices were mixed with WTI crude trading 0.10% down on the day at $57.11 per barrel and Brent edging up by an equivalent percentage to $64. Gold was flat at $1,284.95 per ounce.
Australia & New Zealand Weekly – Statement on Monetary Policy: RBA Lowers Inflation Forecasts
Week beginning 13 November 2017
- Statement on Monetary policy: RBA lowers inflation forecasts.
- RBA: Deputy Governor Debelle and Asst. Governor Ellis speak.
- Australia: Westpac-MI consumer sentiment, wage price index, labour force.
- NZ: house sales and prices.
- China: property prices.
- US: CPI, retail sales.
- Central banks: ECB's Draghi, Fed's Yellen, BoE's Carney and BoJ's Kuroda in discussion.
- Key economic & financial forecasts.
Information contained in this report was current as at 10 November 2017.
Statement on Monetary Policy: RBA Lowers Inflation Forecasts
The Reserve Bank has just released its November Statement on Monetary policy.
We have been surprised by some of the forecast changes in the statement. These forecasts are critically important because they summarise the Bank's view on the growth and inflation outlook.
In the August Statement on Monetary Policy, GDP growth was forecast at 2-3% in 2017, 2 ¾-3 ¾% in 2018, and 3-4% in 2019. These forecasts are largely unchanged for the November revisions. Growth is still forecast at 2 ½ per cent in 2017, 3 ¼% in 2018, and 3 ¼% in 2019 (down slightly on the August forecast of 3-4%). The forecast unemployment rate from the August statement was 5-6% for 2017, 2018 and 2019. In this statement, the forecast is 5 ½% in 2017; 5 ½% in 2018, 5 ¼% in 2019. This slight reduction in the unemployment forecast for 2019 is more consistent with the above trend growth forecast for 2018 and 2019 than we saw in August.
The big change comes with the policy sensitive inflation outlook. Underlying inflation is now forecast at 1 ¾% for 2017; 1 ¾% for 2018, and 2% for 2019. These changes should not be entirely attributed to the revised weights in the CPI as released by the Australian Bureau of Statistics on November 6th.
These changes are much more significant than that from a policy perspective.
The Bank is now telling us that over the whole course of 2018, inflation will remain below the bottom of its 2-3% target zone, and in 2019, it will only reach 2%, the bottom of the target range. This is a significant departure from the forecasts in August. The August forecasts had underlying inflation at 1 ½-2 ½% in 2017; 1 ½-2 ½% in 2018 and 2-3% in 2019. That is, the outlook for 2019 was underlying inflation to be back in the middle of the target band.
It would be inappropriate to merely attribute these changes to a mechanistic adjustment. Bear in mind that the Bank has discussed the prospect of these weight changes in previous speeches and statements and had noted that previous adjustments took around 0.2% off the measured level of yearly underlying inflation. It is reasonable to assume that with the knowledge that the re-basing was imminent, such an adjustment would have been taken into account, informally, in previous forecasts.
It is our view that the decision to lower the forecasts to below the bottom of the band in 2018 and at the bottom of the band in 2019 has significant policy implications. We are now assessing a central bank which is expecting that it will undershoot its core inflation target for another year, and that even one year out, inflation will still be at the bottom of the target zone.
It has always been our view that with the confident growth forecasts of ½ a per cent above potential growth in 2018 and ¾ above potential in 2019, and inflation moving back to the middle of the target in 2019, the Bank expected to be raising rates in 2018.
These new forecasts cast considerable doubt on that view.
Recall, that in May 2016, when the Bank was forced to lower its underlying inflation forecast to 1 ½ per cent, it immediately cut rates by 25bps. It is uncomfortable for a central bank to be consistently undershooting its target, and it would be surprising if it felt the need to tighten policy at a time when inflation is below its target. That is especially true when the expectation for the next year, when policy can be anticipated to have its effect, is that inflation will only be at the bottom of the target zone.
We are not changing our view that rates will remain on hold in 2018 and 2019, but we have always been uncomfortable that the central bank's forecasts were implying that it was expecting that it would be raising rates in 2018. These forecasts no longer portray a central bank that expects to raise rates.
The growth outlook
The bank provides a useful analysis of the risks around the growth outlook. Recall that it has retained its 3 ¼% growth forecast in 2018, and has slightly lowered its 2019 forecast. Some key observations around their views are:
1. They have become more confident around the non-mining business investment outlook, particularly referring to some recent upward revisions which point to stronger momentum in that regard. However, they continue to link faster growth in investment to businesses' assessment of rising household consumption.
2. The core forecast expects that consumption will "pick up a little", along with "a gradual increase in wage growth", however they are decidedly uncertain about both prospects. While they note that some industries are having difficulty attracting labour, they also point out that wage growth in newly negotiated enterprise agreements has declined. The Bank also has revised down its forecast for the recovery in average earnings which have even undershot the admittedly weak wage price index, probably reflecting a rebalancing in the jobs mix to low paid jobs.
3. The expectation for rising wages growth is clearly dependent on ongoing strength in jobs growth and a fall in the unemployment rate reducing spare capacity in the labour market although the ongoing rise in the participation rate represents a risk. On the other hand, there is this uncertainty about structural factors, including technology and globalisation, which may be restraining wages growth given benign wages growth in many countries which have even tighter labour markets.
4. The Bank also recognises other factors that may constrain incomes and spending particularly high household indebtedness and changes in wealth. With house prices now losing momentum particularly in Sydney, wealth perceptions may constrain spending.
5. The Bank has also lowered its outlook for dwelling investment now expecting it to peak earlier than previously anticipated. However, it still assesses that dwelling investment will have a neutral effect over the forecast period.
Our lower growth forecasts for next year at 2.5% are predicated on weaker household consumption than the Bank implies; a sharper downturn in residential investment and a more modest uplift in non-mining business investment. All these issues are interconnected with weaker signals from the household sector likely to weigh on business confidence and employment decisions while a sharper downturn in housing construction will generate spare capacity in the building sectors and ease jobs growth.
Conclusion
This is a significant set of forecast revisions and we believe signals a changed policy outlook from the Bank itself. While the Governor will continue to indicate that the next move in rates will be up, we think that the rhetoric around a long period of steady rates will gain further emphasis.
Forecasting another year of inflation undershooting the target zone might, in other circumstances signal a central bank which is contemplating further rate cuts. However, it still believes that growth will lift to above trend, and the experience of 2016, when two rate cuts triggered another surge in house prices will temper any inclination to cut again.
The Week that Was
This week began with our understanding of Australia's inflation story being 'revised' and ended with the RBA making a significant adjustment to their forecasts. In between, we saw progress on tax reform in the US; although on this front, developments to date are best regarded as a work in progress.
Firstly on the CPI, we have released a number of pieces this week that have detailed both the quantitative and qualitative effect of the ABS' reweighting of the CPI basket. See chart of the week below for further detail.
The other big event in Australia this week was the RBA's November meeting and the release of the November Statement on Monetary Policy. The monthly meeting came and went with little fanfare, but the November Statement received considerable attention.
The change that particularly caught our eye was the significant downward revision to their CPI forecasts. Inflation is now not expected to get back to the bottom of the target band (2%) until 2019.
As our Chief Economist Bill Evans explains, this cannot solely be put down to the CPI reweighting (highlighted above) and comes despite expectations of above-trend growth from 2018 on.
Bill's conclusion on the Statement is in the essay above.
Before moving on to the international economy, it would be remiss to not highlight our latest monthly, Market Outlook. In this edition, in addition to discussions on the outlook for the Australian dollar and interest rates, the thematic articles investigate the outlook for business investment and central bank exploration into the world of digital currencies and distributed ledger technologies. Other important themes are the persistence of highly-accommodative monetary policy in Europe, with consequences for the Euro, and the outlook for China following the five-yearly National Congress.
This Market Outlook also contains updated forecasts from our New Zealand team following the recent election and this week's RBNZ policy meeting. On the NZ economy, government spending will increase in time; regarding monetary policy, the new government is likely to change the framework that governs the RBNZ's decision making. In the meantime, our NZ team continues to believe that the RBNZ's optimistic expectations for the economy will be disappointed and that policy will remain on hold until late 2019.
Outside of Australia and New Zealand, the most significant development this week has been continuing progress on US tax reform in both the House and Senate. The issue is, that rather than work together, the two halves of Congress have each formed their own plan which, while based on the same 'principles', are actually quite different.
Negotiations will continue in coming weeks and inevitably a compromise package of reforms will be brought before Congress for a vote. In Northern Exposure this week, we abstract from the political uncertainty and focus instead on assessing, should reform occur, will it mean much for the real economy? Our conclusion is that, for households, any benefit is likely to marginal and temporary; for corporates, a near-term win from a lower corporate tax rate will give way to considerable uncertainty in the longer-term.
Chart of the week: ABS CPI 17th series
The ABS maintains a program of periodic reviews of the Consumer Price Index (CPI) to ensure it continues to meet community needs. On Monday, the ABS released the details of the 17th series, which they state is a minor review of the CPI.
For the 17 series the ABS has updated the upper level (expenditure class) weights in line with the latest Household Expenditure Survey (HES). This is done as the CPI is a fixed weight index and the weights have to be revised from time to time to bring them in line with the latest spending patterns associated with changing technology and individual preferences as well as correcting a substitution bias that emerges over time as spending tends to rise (fall) for items where relative prices have declined (risen).
Incorporating the changed weights, we struggle to see a peak in headline inflation any higher than 2.0%yr for the foreseeable future. Key to this outlook is ongoing competition amongst retailers as well as the impact greater housing supply is having on rents.
New Zealand: Week Ahead & Data Wrap
This week's Monetary Policy Statement was very much in line with expectations. The Reserve Bank left the OCR unchanged at 1.75% and issued the same forward guidance it has used all year. Essentially, the OCR is on hold, and the RBNZ expects that it will remain on hold until 2019, although there are large uncertainties on both sides.
While the overall tone of the MPS was both neutral and much the same as previous missives, there was a lot going on beneath the surface. The RBNZ acknowledged that the housing market and construction activity were weaker than previously anticipated, and downgraded its forecasts in both areas. This downgrade was overdue - we had complained that the RBNZ was too optimistic on construction and house prices in its August MPS. But offsetting these downside developments, the RBNZ acknowledged that the lower exchange rate will support inflation, and that the Government's fiscal plans would stimulate the economy.
The standout for us was the RBNZ's extraordinary optimism about future GDP growth. The RBNZ estimates that the economy grew 0.7% in the September quarter this year, whereas our estimate is 0.4%. The RBNZ goes on to forecast that GDP growth will be 0.9% in December 2017, rising to 1.2% in March 2018. That would make March the strongest quarter of GDP growth in four years. These are heroic forecasts, to say the least. In recent times we have seen business confidence dropping away, the housing market slow and construction activity stagnate. With the uncertainty associated with a change of Government lying ahead of us and population growth slowing sharply, we find it highly unlikely that the economy will reach these heights. Our own forecast for GDP growth in the March 2018 quarter is 0.5%.
The RBNZ is also very optimistic on GDP growth over a longer timeframe, based on the idea that the new Government's policies will tend to boost the economy. In turn, this will apply upward pressure to inflation, necessitating a higher OCR than otherwise. The RBNZ looked at four areas of proposed Government policy: extra spending on education and health, the Kiwibuild residential building programme, hikes to the minimum wage, and plans to reduce incoming migration to New Zealand. On balance it judged these to be a positive stimulus to inflation, necessitating an OCR perhaps 50 basis points higher than otherwise.
We broadly agree with the RBNZ on these areas, although we would quibble with their assumptions around Kiwibuild - we think it will mostly displace private sector activity and will therefore have little impact on overall construction activity.
But we suspect that the RBNZ has not allowed enough for the Government's plans around the property market. The Government is planning to restrict foreign purchases of residential property and to change the tax treatment of property investors. Furthermore, it plans to convene a tax working group that might recommend a capital gains tax or similar. We expect that these actual and prospective tax changes will cause the housing market to weaken noticeably next year.
Furthermore, the RBNZ is assuming that any weakness in the housing market will have little impact on consumer spending. Here we disagree strongly, and recent evidence is on our side. This week's electronic card transactions data registered yet another very small rise in spending, despite booming population growth. Spending on durables has been particularly weak, falling 2% over the past three months. This looks to us like a classic response to a weak housing market, which could intensify next year if house prices remain soft.
The other area that the RBNZ may be disappointed in is export conditions. We expect New Zealand's export commodity prices to fall next year, due to an expected slowdown in China's economy. Indeed, dairy auction prices are already falling - this week's auction registered a 3.5% decline in the overall dairy price index, with whole milk powder down 5.5%. This is the latest in a string of auction price declines, which has cumulatively been enough for us to downgrade our forecast farmgate milk price for the 2017/18 season to $6.20/kg (previously $6.50). Fonterra's $6.75/ kg forecast is now looking well out of market. We have also published for the first time our milk price forecast for the 2018/19 season. We expect the payout to increase to $6.50/kg, on the basis of a revival in the Chinese economy from late 2018 and supported by a lower average exchange rate over the season.
Putting all of this together, we expect that the RBNZ will be surprised by slow GDP growth, weak house prices and falling export commodity prices over 2018. If we are correct, the RBNZ will become more dovish.
There could be a couple of other knock-on effects to consider. First of all, the exchange rate would fall even further in these conditions, providing some offset from an inflation point of view. Second, a weak housing market could prompt the RBNZ to loosen macro-prudential policy. The RBNZ Governor this week said that the criteria under which the LVR mortgage lending restrictions may be loosened will be outlined at the Financial Stability Report on 29 November. Any loosening would likely be incremental, but still might have a positive influence on the housing market.
Data Previews
Aus Nov Westpac-MI Consumer Sentiment
Nov 15 Last: 101.4
- The Westpac-Melbourne Institute Consumer Sentiment Index rose 3.6% to 101.4 in Oct, the first time since Nov last year that optimists have outnumbered pessimists and the highest level since Oct 2016. The lift has come from an improving global economy, easing concerns about rising interest rates and over-heated housing markets, and improving labour market conditions. However, confidence is still not particularly strong, with views on family finances a clear weak spot.
- This month's survey is in the field over the week ended Nov 11. Factors that may influence confidence include: the RBA's decision to again leave rates on hold; more signs of cooling across Australia's major housing markets; disappointing retail updates; and renewed political instability. Notably, the ASX is also up over 5% since Oct.
Aus Q3 Wage Price Index
Nov 15, Last: 0.5%, WBC f/c: 0.7%
Mkt f/c: 0.7%, Range: 0.5% to 0.8%
- Wages have lagged the recovery in the Australian labour market. While it is part of a global phenomenon of wage deflation, there are domestic considerations as well. Rising part-time employment and underemployment have a role to play particularly in Victoria which has the fastest population growth and higher rate of employment growth.
- The rise in the national Minimum Wage has an impact in the September quarter Wage Price Index. The RBA has estimated a direct impact of 0.5ppt boost in the quarter due to the increase. Given that the previous Minimum Wage increases contributed 0.3ppt, the net impact of the increase is a 0.2ppt boost to the underlying pace.
- Our 0.7%qtr forecast will lift the annual pace to 2.3%yr, the fastest pace since September 2015.
Aus Oct Labour Force - employment '000
Nov 16, Last: 19.8k, WBC f/c: 20k
Mkt f/c: 18k, Range: -10k to 30k
- Total employment increased by 19.8k in September, broadly in line with the market median forecast of +15.0k and Westpac's forecast of +25.0k. Part-time employment grew 13.7k, while full-time rose 6.1k, though importantly hours worked posted a solid 0.7% gain. September's result was consistent with the positive momentum seen over 2017. After the Australian labour market went through a soft patch in 2016, employment gathered steam as we moved through 2017 rising 371k or 3.1% through the year to September.
- Westpac's forecast of a 20k rise will be a record breaking 13th consecutive monthly gain in employment. It may be tempting to look for a statistical correction but the strength of the labour market indicators in both consumer and business surveys suggest the underlying momentum remains very robust.
Aus Oct Labour Force - unemployment %
Nov 16, Last: 5.5%k, WBC f/c: 5.5%
Mkt f/c: 5.5%, Range: 5.4% to 5.6%
- The unemployment rate fell to 5.5% with the participation rate holding at 65.2% though August's number was revised lower from 65.3%. In the month the labour force increased just 7.9k. Note that at two decimal places, participation fell slightly to 65.21% from 65.25%, with male participation falling to 70.7% from 70.8% and female participation falling to 59.8% from 59.9%.
- We are expecting the continuing robust growth in employment to draw more people into the labour force, particularly females. This is behind our forecast for a small rise in participation to 65.3% which will hold the unemployment rate flat at 5.5%.
NZ Oct house sales and prices
Nov 15, Sales last: -6.9%, Prices last: 2.1%yr
- The housing market weakened over much of 2017, with prices falling in Auckland and nearby regions. But over August and September there were signs of the housing market perking up in the REINZ data. Prices rose by 1% in September.
- Other sources of data corroborate the idea of the market improving slightly. Available stock on a real estate website has dropped, and another website has reported a rising average asking price.
- While uncertainty around post-election outcomes (a coalition agreement was announced on 19 October) may have kept housing turnover in check, the October REINZ data might show a further lift in house prices.
US Oct CPI
Nov 15, last 0.5%, WBC 0.1%
- September's headline CPI outcome was dominated by Hurricanes Harvey and Irma. Following a 0.4% gain in August (also hurricane affected), prices rose 0.5% in September. That left the annual pace at 2.2%yr.
- Of the monthly gain, 75% of the increase reportedly came from a surge in gasoline prices after refining operations were heavily impacted by the weather.
- Abstracting from this factor, inflation pressures remained benign. The core CPI rose by just 0.1%, leaving the annual rate unchanged at 1.7%yr for a fifth consecutive month.
- The headline and core CPI outcomes are expected to be soft in October, with both likely to print at 0.1%. On both a CPI and PCE basis, there is no cause for concern on inflation.
US Oct retail sales
Nov 15, last 1.6%, WBC 0.3%
- Retail sales received a large boost from restocking in the month of September in the aftermath of Hurricanes Harvey and Irma.
- There were two particularly notable weather effects in the month: (1) car sales surged in affected areas as consumers replaced vehicles written off in the storm; and (2) the surge in gasoline prices flattered total nominal sales.
- Both effects will be largely absent in October. Hence our expectation that sales will rise by just 0.3% following September's 1.6% jump. The market forecast of 0.1% points to some downside risk. Broadly, it has long been hoped that confidence and job gains will drive stronger sales. However, soft wages growth continues to get in the way.
Ending Diagonal On NZDUSD Points Lower
Good day traders! Let's look at NZDUSD and its Elliott wave pattern.
NZDUSD is pushing higher, unfolding a five-wave overlapping structure within final wave c of 4. This structure looks more and more like an EW ending diagonal, that can once completed unfold a sharp reversal lower towards the 0.68881 level.
NZDUSD, 1H
An ending diagonal is a special type of pattern that occurs at times when the preceding move has gone too far too fast, as Elliott put it. A very small percentage of ending diagonals appear in the C wave position of A-B- C formations. In double or triple threes, they appear only as the final "C" wave. In all cases, they are found at the termination points of larger patterns, indicating exhaustion of the larger movement.
- structure is 3-3-3-3-3
- a wedge shape within two converging lines
- wave 4 must trade into a territory of a wave 1
- appears primarily in the fifth wave position, in the C wave position of A-B- C and in double or triple threes as the final "C" wave
Ending diagonal example:

DAX – Strong Bearish Signal is Developing on Weekly Chart
DAX holds in red on Friday and attempts again through cracked Fibo support at 13144 (61.8% of 12906/13530 upleg) after repeatedly breaking below 20SMA (13164).
Thursday's dip to new two-week low at 13103 was short-lived and failed to sustain break below 20SMA/Fibo supports, but downside pressure persists and shows scope for final clear break lower.
Long red candle from the previous day weighs along with south-heading indicators on daily chart.
In addition, the index is on track for strong weekly close in red (after two bullish weeks) with weekly RSI/slow stochastic emerging from overbought territory and generating bearish signal. Firm break below 13144 handle will be bearish signal for next week's trading for test of psychological 13000 support and possible test of 12906 (25 Oct trough) in extension.
Broken Kijun-sen (13214) is expected to ideally cap and keep the upside protected.
Res: 13173; 13214; 13291; 13316
Sup: 13103; 13053; 13000; 12906