Sample Category Title
USD/CHF Mid-Day Outlook
Daily Pivots: (S1) 0.9901; (P) 0.9959; (R1) 0.9997; More....
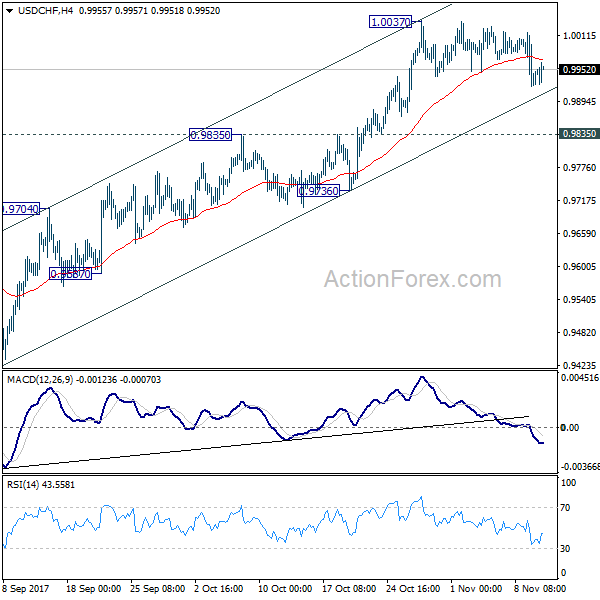
Intraday bias in USD/CHF stays neutral as consolidation from 1.0037 is in progress. As noted before, downside should be contained above 0.9835 resistance turned support and bring rally resumption. On the upside break of 1.0037 will resume whole rally from 0.9420. And with sustained trading above 61.8% retracement of 1.0342 to 0.9420 at 0.9990, USD/CHF should then target a test on 1.0342 key resistance.
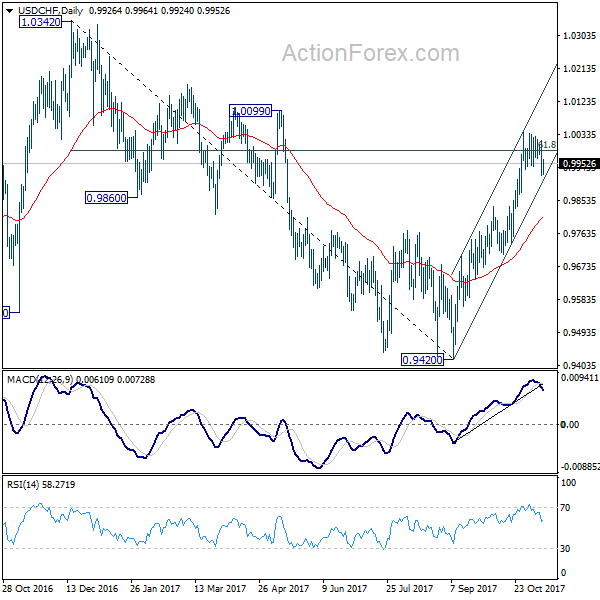
In the bigger picture, current development suggests that USD/CHF has defended 0.9443 (2016 low) key support level again. Rise from 0.9420 could is a medium term up move and should target a test on 1.0342 high. This represents the upper end of a long term range that started back in 2015. On the downside, break of 0.9736 support is now needed to indicate completion of the rise from 0.9420. Otherwise, further rally will remain in favor in medium term.
EUR/USD Mid-Day Outlook
Daily Pivots: (S1) 1.1598; (P) 1.1626 (R1) 1.1668; More...
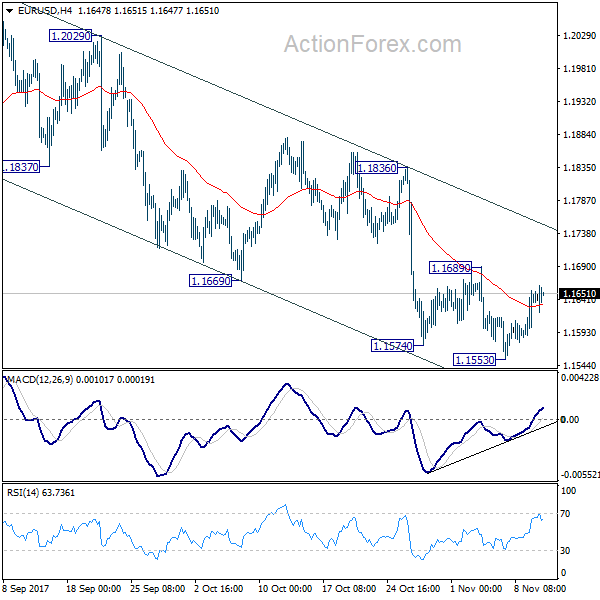
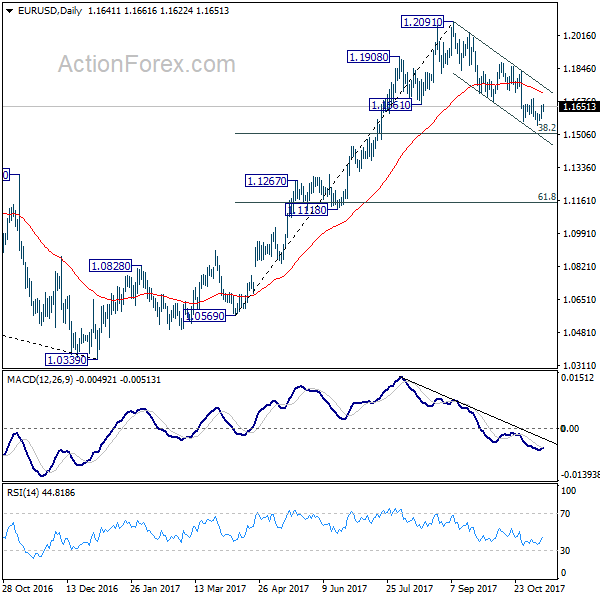
Intraday bias in EUR/USD stays neutral for the moment. Overall, with 1.1689 resistance intact, fall from 1.2091 is in progress for 38.2% retracement of 1.0569 to 1.2091 at 1.1510. We'd be cautious on strong support from there to bring rebound. But sustained break of 1.1510 will pave the way to next support zone at 1.1118/1267. On the upside, break of 1.1689 resistance will now indicate short term bottoming and turn bias back to the upside for 1.1836 resistance next.
In the bigger picture, rise from 1.0339 medium term bottom is seen as a corrective move for the moment. Therefore, in case of another rally, we'd be cautious on 38.2% retracement of 1.6039 (2008 high) to 1.0339 (2017 low) at 1.2516 to limit upside and bring reversal. Meanwhile, sustained trading below 55 week EMA will suggest that such medium term rebound is completed and could then bring retest of 1.0339 low.
GBP/USD Mid-Day Outlook
Daily Pivots: (S1) 1.3097; (P) 1.3131; (R1) 1.3178; More....
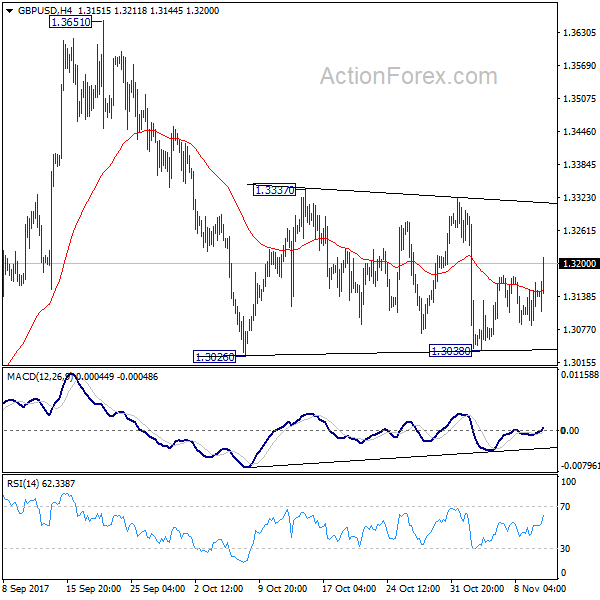
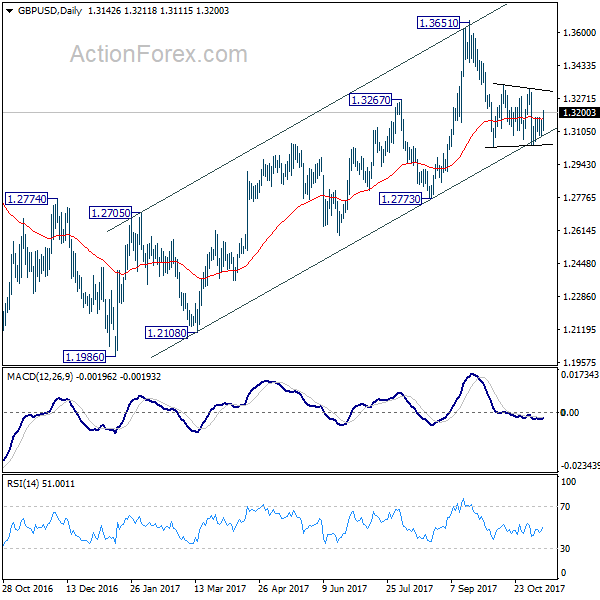
GBP/USD rebounds notably today but it's still staying in range of 1.3038/3337. Intraday bias remains neutral and outlook is unchanged. Upside of recovery should be limited below 1.3337 resistance to bring fall resumption. Break of 1.3038 will now resume decline from 1.3651 to 1.2773 key support level. However, decisive break of 1.3337 will indicate that pull back from 1.3651 is completed and medium term rise from 1.1946 is resuming.
In the bigger picture, as noted before, GBP/USD hit strong resistance from the long term falling trend line. Current development is starting to favor that corrective rebound from 1.1946 low has completed at 1.3651. Decisive break of 1.2773 will confirm this bearish case and target a test on 1.1946 low next, with prospect of resuming the low term down trend. Nonetheless, break of 1.3320 resistance will restore the rise from 1.1946 for 38.2% retracement of 2.1161 (2007 high) to 1.1946 (2016 low) at 1.5466.
Sterling Surges on Production Data, to End the Week as Strongest
Sterling shines today in rather dull trading as lifted by strong production data. Industrial production rose 0.7% mom, 2.5% yoy in September versus expectation of 0.3% mom, 1.9% yoy. Manufacturing production rose 0.7% mom, 2.7% yoy versus expectation of 0.3% mom, 2.4% yoy. Trade deficit also narrowed to GBP -11.3. But construction output dropped more than expected by -1.6% mom. Over the week, the Pound will also likely end as the strongest one. Canadian Dollar follows closely as supported by surge in oil price. Meanwhile, Dollar is set to end as the weakest as traders are dissatisfied with Senate's plan to delay corporate tax cut by a year.
ECB Nowotny: Should signal intention to end asset purchase
ECB Governing Council member Ewald Nowotny expressed his "absolute agreement" with Bundesbank head Jens Weidmann. Nowotny said "this new purchasing program is valid until September 2018 and in my view we should then go about bringing it to an end if the economy develops as we currently expect it to." Weidmann made a similar point the day after ECB announced to half asset purchase to EUR 30b a month and extend the program till September next year. Another Governing Council member Philip Lane said that "if we have enough signals, we can get active and move on" with monetary policy. And he emphasized that "our monetary policy does not always have to follow such a gradual and incremental approach as it is currently the case." And, "inflation doesn't have to reach our goal before we discuss changing our policy." Nonetheless, he also acknowledged that "inflation must be clearly on the way towards this goal. At the moment this is not the case."
Senate propose to delay corporate tax cuts to 2019
As noted in their vision for the tax reform plan, Senate Republicans propose to implement a corporate tax rate cut to 20% on January 1, 2019, one year later than the House proposal released last week. On other aspects, the members retain the seven income tax brackets but the tax rates are slightly different from the House proposal, whilst they propose to preserve existing mortgage-interest deduction for home purchases with up to USD 1m of debt. Senate Republicans also propose to maintain the estate tax while doubling the current USD 5.49m exemption for individuals.
The House Ways and Means committee passed its tax bill yesterday, setting it up for a full House vote as soon as next week. Senate will hold hearings on the bill next week. And the Senators are targeting to pass it a week after Thanksgiving. After passing the bill in Senate, the two chambers will try to close the gaps in a process known as a conference committee.
RBA revised lower GDP forecasts
RBA in its Statement of Monetary Policy revised lower the GDP growth outlook. It now expects growth to reach 2.5% this year, compared with 2-3% projected in August, before rising to 3.25% in 2018, down from previous forecast of 3.75%. As the central bank noted, "the drag on growth from the end of the mining boom has eased and is likely to end some time in the next year or so". On inflation RBA forecasts headline CPI to rise to 2% by the end of this year. Inflation is not expected to reach 2.25% until end- 2018.
China CPI and PPI beat expectations
China inflation, both upstream (PPI) and downstream (CPI), surprised to the upside in October. Headline CPI accelerated to 1.9% yoy, from 1.6% in September, beating consensus of 1.7%. Food deflation improved to -1.4% yoy in October, from September's -1.4%, whilst non-food price steadied at 2.4% yoy. Core CPI also steadied at 2.3% last month. PPI stayed unchanged at 6.9%, beating expectations of a slowdown to 6.9%. The set of data indicates gradual but smooth pass-through of inflation (from PPI to CPI), thanks to stable wage growth and improved capacity utilization. Headline CPI has a chance of rising to 2% by year-end and exceeding it in 2018. Note, however, that the upper bound of PBOC's inflation target is 3%. More in China: Strong Inflation Unlikely Alter Monetary Policy Outlook, Trade Surplus With US Second On Record.
GBP/USD Mid-Day Outlook
Daily Pivots: (S1) 1.3097; (P) 1.3131; (R1) 1.3178; More....
GBP/USD rebounds notably today but it's still staying in range of 1.3038/3337. Intraday bias remains neutral and outlook is unchanged. Upside of recovery should be limited below 1.3337 resistance to bring fall resumption. Break of 1.3038 will now resume decline from 1.3651 to 1.2773 key support level. However, decisive break of 1.3337 will indicate that pull back from 1.3651 is completed and medium term rise from 1.1946 is resuming.
In the bigger picture, as noted before, GBP/USD hit strong resistance from the long term falling trend line. Current development is starting to favor that corrective rebound from 1.1946 low has completed at 1.3651. Decisive break of 1.2773 will confirm this bearish case and target a test on 1.1946 low next, with prospect of resuming the low term down trend. Nonetheless, break of 1.3320 resistance will restore the rise from 1.1946 for 38.2% retracement of 2.1161 (2007 high) to 1.1946 (2016 low) at 1.5466.
Economic Indicators Update
| GMT | Ccy | Events | Actual | Forecast | Previous | Revised |
|---|---|---|---|---|---|---|
| 23:50 | JPY | Japan Money Stock M2+CD Y/Y Oct | 4.10% | 4.10% | 4.10% | 4.00% |
| 0:30 | AUD | RBA Monetary Policy Statement | ||||
| 4:30 | JPY | Tertiary Industry Index M/M Sep | -0.20% | -0.10% | -0.20% | -0.10% |
| 9:30 | GBP | Industrial Production M/M Sep | 0.70% | 0.30% | 0.20% | 0.30% |
| 9:30 | GBP | Industrial Production Y/Y Sep | 2.50% | 1.90% | 1.60% | 1.80% |
| 9:30 | GBP | Manufacturing Production M/M Sep | 0.70% | 0.30% | 0.40% | |
| 9:30 | GBP | Manufacturing Production Y/Y Sep | 2.70% | 2.40% | 2.80% | |
| 9:30 | GBP | Construction Output M/M Sep | -1.60% | -0.90% | 0.60% | 0.80% |
| 9:30 | GBP | Visible Trade Balance (GBP) Sep | -11.3B | -12.9B | -14.2B | -12.4B |
| 15:00 | USD | U. of Mich. Sentiment Nov P | 100.6 | 100.7 |
EURCHF Hits Three-Week Low; Bears Still Active in the Short-Term
EURCHF has been making lower tops and bottoms since October 26, stretching its downtrend to a three-week low of 1.1526 on Thursday. The pair is currently trading with a neutral bias on the four-hour chart, but risks remain to the downside in the short-term.
The pair is capped by the 20-period MA below the Ichimoku cloud, sending bearish signals, while the bearish cross between the Kijun-sen and the Tenkan-sen also hints that a downfall might emerge. Yet, the fact that the RSI is close to its neutral zone, pointing to an upside and the MACD has slightly deviated above its signal line, showing that the pair might move sideways for a while before it resumes its downtrend.
A support level is likely to occur at the previous low of 1.1526 before the pair moves towards 1.1483, opening the way towards October's low at 1.1387.
On the flip side, an immediate resistance is likely to be met around 1.1583, an area where the 20-period exponential moving average and the Kijun-sen line converge. Any rise from here, would target the previous top at 1.1618 (close to the 50-period EMA), while steeper increases would shift focus towards the top of 1.1663 and October's high at 1.1710.
EURGBP – At the Back Foot After Rallies Were Repeatedly Capped
The cross is in red on Friday and pressures initial support at 0.8828 (10SMA) after upside attempts were repeatedly capped by descending 20SMA (currently at 0.8870). Pound was boosted by overall solid UK data today and cross may extend weakness through 10 SMA towards higher base at 0.8795 and 200SMA (0.8766) in extension, as sustained break below 10SMA will be bearish signal. At the upside, a plethora of barriers (20/55SMA and 55/100SMA bear-cross; daily cloud base) weighs on near-term action and keeps bias in bearish mode.
Res: 0.8871; 0.8885; 0.8915; 0.8938
Sup: 0.8828; 0.8795; 0.8766; 0.8732
USDJPY: Remains Vulnerable To The Downside On Bear Pressure
USDJPY: The pair remains weak and vulnerable to the downside despite price consolidation. On the downside, support comes in at the 113.00 level where a break if seen will aim at the 112.50 level. A cut through here will turn focus to the 112.00 level and possibly lower towards the 114.00 level. On the upside, resistance resides at the 114.50 level. Further out, we envisage a possible move towards the 115.00 level. Further out, resistance resides at the 115.50 level with a turn above here aiming at the 116.00 level. On the whole, USDJPY faces further pullback further threats.
GBPUSD Still Beraish Below 1.3168 Level
The GBPUSD pair remains bearish while trading below the 1.3168 level. Further downside pressure towards the 1.3130 and 1.3109 levels should be expected. Extended intraday support is found at the 1.3086 and 1.3036 levels.
Should price action break above the 1.3168 level, further upside towards the 1.3180 weekly price-high and the 1.3200 level remains likely. Extended intraday resistance is found at the 1.3268 level.
EURUSD Still Intraday Bullish Above 1.1640 Level
The euro has moved to a new weekly price-high against the U.S dollar during the European trading session, hitting 1.1661, as the dollar index comes under fresh selling pressure. The EURUSD pair currently trades around the 1.1650 level, as buyers continue to defend the 1.1640 technical support region. Traders now look to the U.S session, with the release of the Michigan Sentiment Survey and U.S stock markets likely to dictate the next directional move.
The EURUSD pair remains intraday bullish while trading above the 1.1640 support zone. Further upside towards the 1.1677 and 1.1710 resistance levels remains increasingly likely.
Should price action decline below the 1.1640-32 support level, further losses towards the 1.1610 and 1.1598 technical levels should be expected.
GBPJPY is Stuck Between Bear-Trendline and Daily Cloud Top
The cross is holding within tight rage on Friday with downside remaining at risk after Thursday's action ended in long-legged Doji. Top of daily cloud keeps the downside protected for now, despite several dips into cloud. Upside attempts were capped by falling trendline, drawn off 151.94 (01 Nov high), forming a series of lower highs from 151.94. Fresh probes into daily cloud could be anticipated while bear-trendline caps, with sustained break lower needed to complete asymmetric H&S pattern on daily chart and generate bearish signal on break below 148.29 (neckline/cloud top). This could open way towards next strong support at 147.67 (Fibo 38.2% of 139.30/152.85 ascend). Alternatively, break and close above bear-trendline/daily Kijun-sen (currently at 149.44) would sideline immediate downside risk and expose 10SMA (149.72) which guards pivotal barriers at 150.19 (Tenkan-sen) and 150.32 (07 Nov lower top).
Res: 149.44; 149.72; 150.19; 150.32
Sup: 148.83; 148.44; 148.29; 147.67