
Sample Category Title
EUR/JPY Weekly Outlook
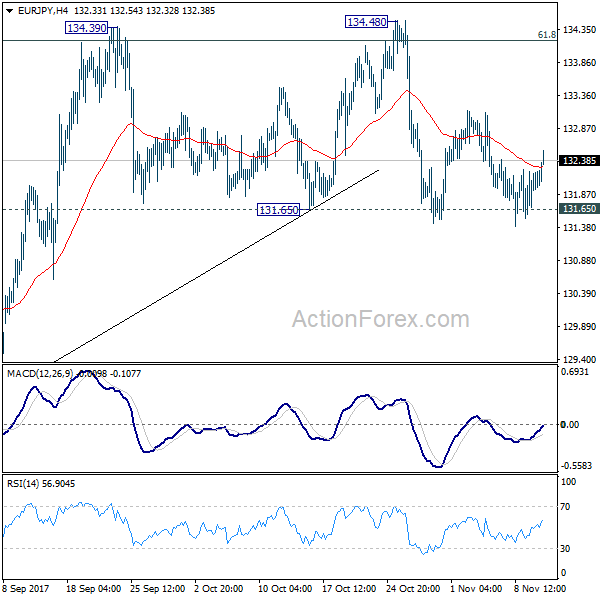
EUR/JPY breached 131.65 support last week but quickly recovered again. Initial bias remains neutral this week first and outlook is unchanged. Again, decisive break of 134.39/48 resistance zone is needed to confirm up trend resumption. Otherwise, even in case of rebound, near term outlook is neutral at best. On the downside, decisive break of 131.65 will confirm rejection from 134.20 fibonacci level and confirm near term reversal. And, in such case, intraday bias will be turned to the downside for 127.55 key support level.
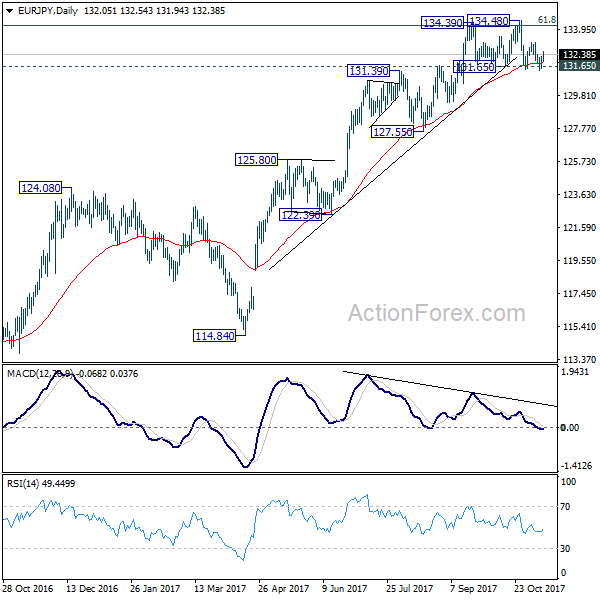
In the bigger picture, medium term rise from 109.03 (2016 low) is seen as at the same degree as the down trend from 149.76 (2014 high) to 109.03 (2016 low). 61.8% retracement of 149.76 to 109.03 at 134.20 is already met. Sustained break there will pave the way to key long term resistance zone at 141.04/149.76. However, break of 127.55 support will argue that the medium term trend has reversed and will turn outlook bearish for deeper fall back to 114.84/124.08 support zone at least.
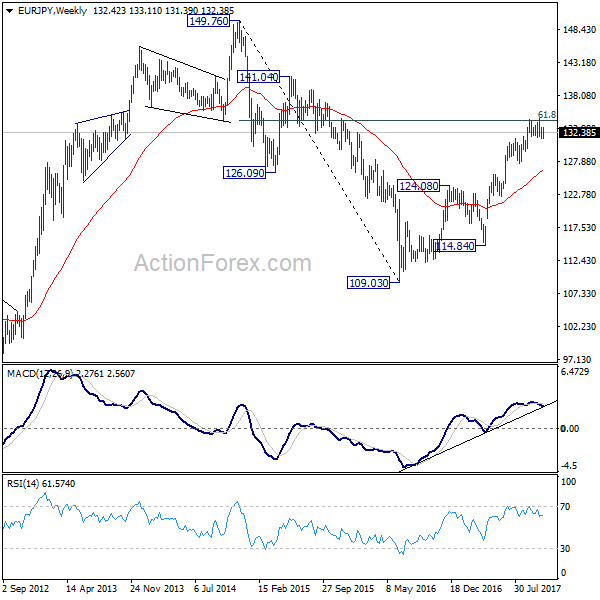
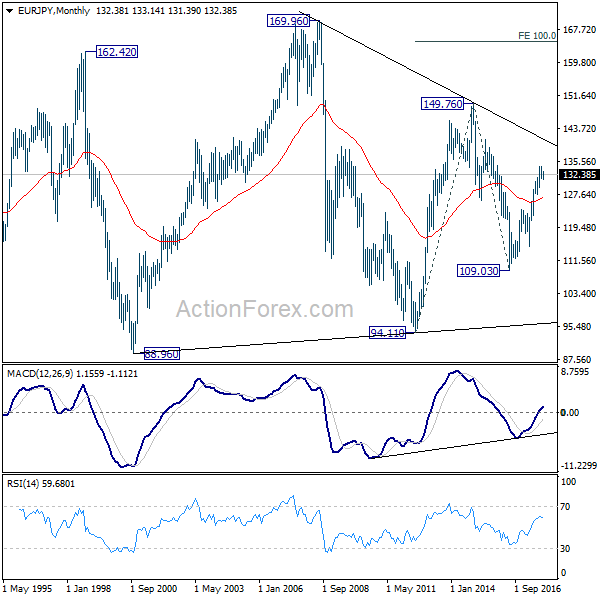
In the long term picture, at this point, there is no clear indication that rise from 109.03 is resuming that from 94.11. Hence, we'd be cautious on topping below 149.76 to extend range trading. Nonetheless, firm break of 149.76 will indicates strong underlying buying. In such case, EUR/JPY will target 100% projection of 94.11 to 149.76 from 109.03 at 164.68.
EUR/GBP Weekly Outlook
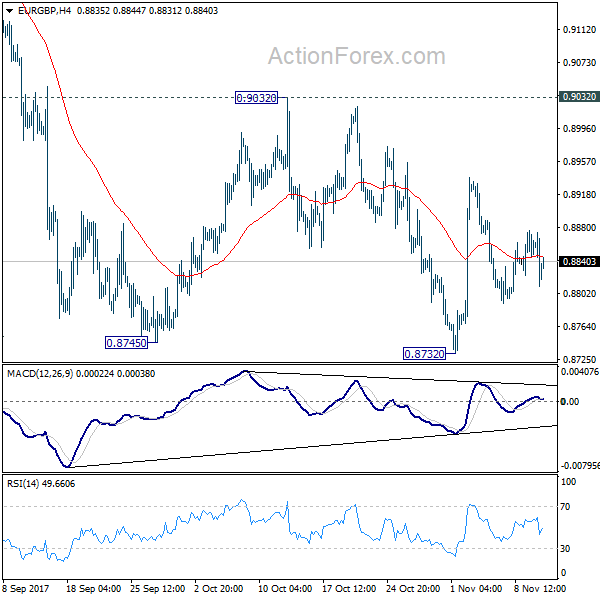
EUR/GBP stayed in range of 0.8732/9032 last week and outlook is unchanged. Initial bias remains neutral this week first. With 0.9032 resistance intact, deeper decline is mildly in favor in the cross. Break of 0.8732 will resume the decline from 0.9305 and target 0.8303 key support level. However, on the upside, decisive break of 0.9032 will confirm completion of the decline from 0.9305. In such case, intraday bias will be turned back to the upside for retesting 0.9305 key resistance.
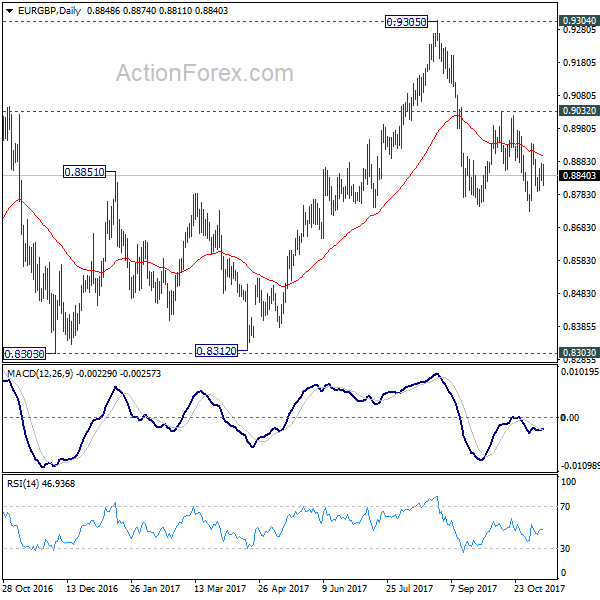
In the bigger picture, there are various ways to interpret price actions from 0.9304 high. But after all, firm break of 0.9304/5 is needed to confirm up trend resumption. Otherwise, range trading will continue with risk of deeper fall. And in that case, EUR/GBP could have a retest on 0.8303. But we'd expect strong support from 0.8116 cluster support (50% retracement of 0.6935 to 0.9304 at 0.8120) to contain downside.
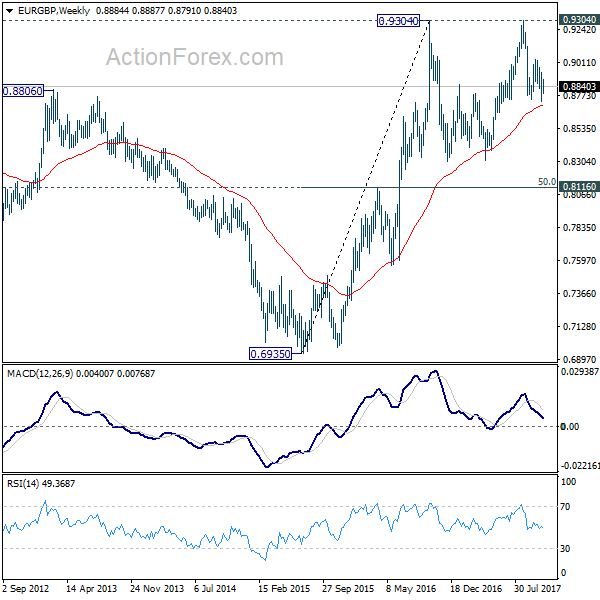
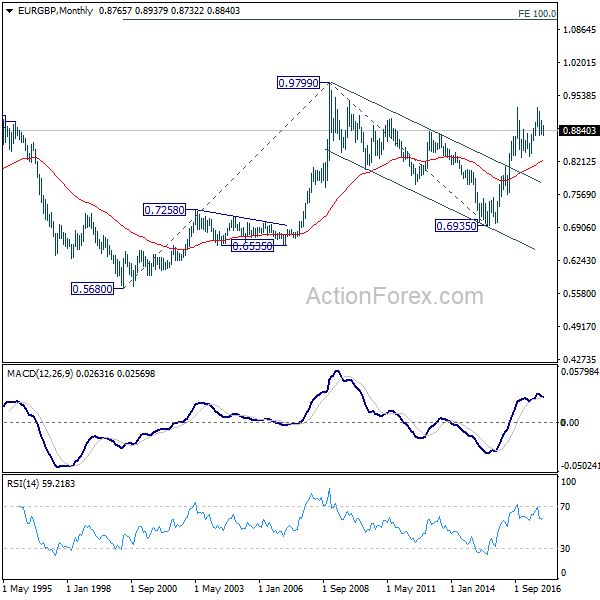
In the long term picture, firstly, price action from 0.9799 (2008 high) is seen as a long term corrective pattern and should have completed at 0.6935 (2015 low). Secondly, rise from 0.6935 is likely resuming up trend from 0.5680 (2000 low). Thirdly, this is supported by the impulsive structure of the rise from 0.6935 to 0.9304. Hence, after the correction from 0.9304 completes, we'd expect another medium term up trend through 0.9799 to 100% projection of 0.5680 to 0.9799 from 0.6935 at 1.1054.
EUR/AUD Weekly Outlook
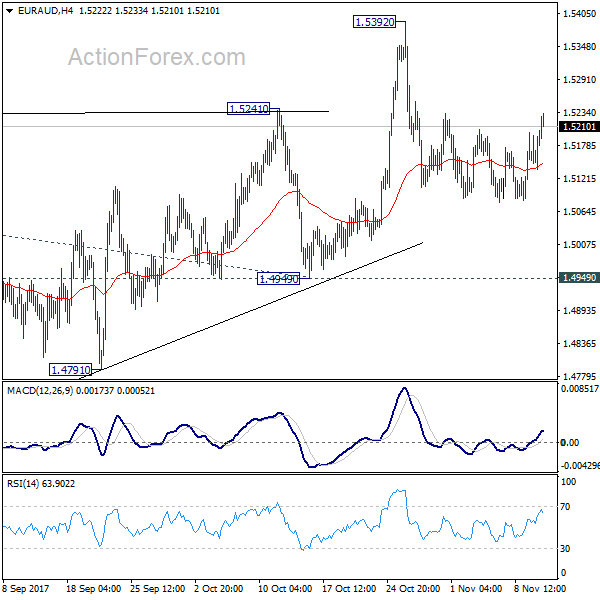
EUR/AUD's consolidation from 1.5392 continued last week and was held well above 1.4949 key support. Outlook is unchanged and initial bias remains neutral first. As long as 1.4949 support holds, outlook remains bullish and further rise is in favor. Break of 1.5392 will resume medium term rise from 1.3624 and target 61.8% projection of 1.3624 to 1.5226 from 1.4949 at 1.5939 first. However, decisive break of 1.4949 will carry larger bearish implication and turn bias to the downside.
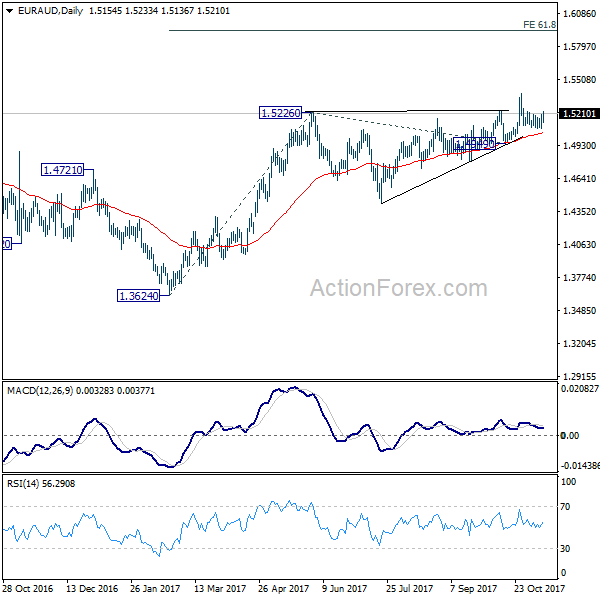
In the bigger picture, we're holding on to the view that corrective decline from 1.6587 medium term top has completed at 1.3624. Rise from 1.3624 is expected to extend to retest 1.6587. However, break of 1.4949 support will dampen our view and argue that rise from 1.3624 has completed. In that case, EUR/AUD would turn southward for retesting 1.3624 low.
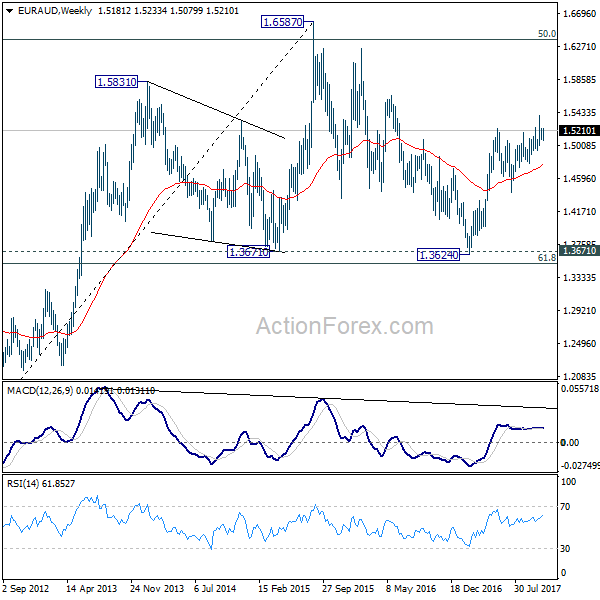
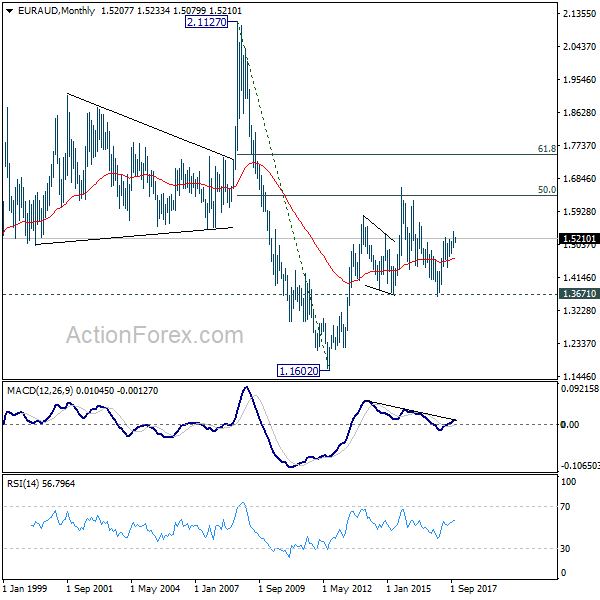
In the longer term picture, the rise from 1.1602 long term bottom isn't over yet. We'll keep monitoring the development but there is prospect of extending the rise to 61.8% retracement of 2.1127 to 1.1602 at 1.7488 and above. However, sustained trading below 1.3671 should confirm trend reversal and target 1.1602 long term bottom again.
EUR/CHF Weekly Outlook
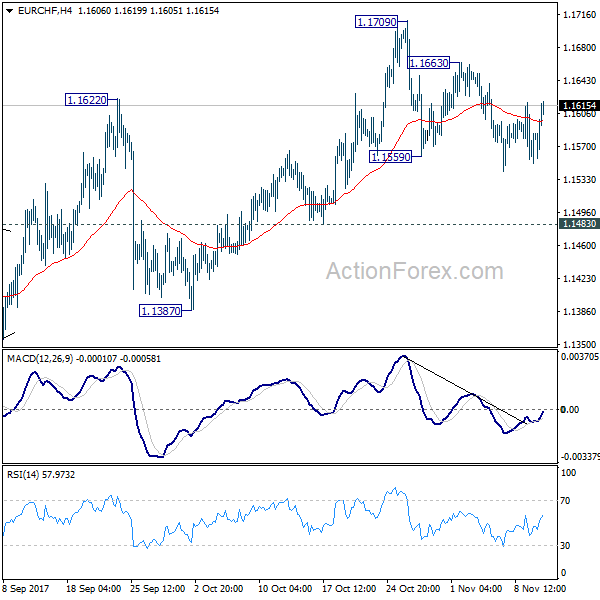
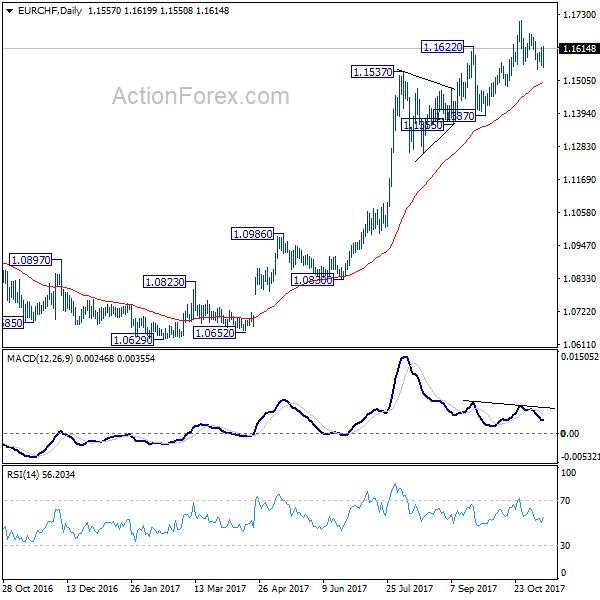
EUR/CHF dipped through 1.1559 minor support last week as correction from 1.1709 extends. But overall outlook is unchanged. While more consolidation could be seen, outlook will remain bullish as long as 1.1483 support holds. On the upside, above 1.1663 minor resistance will turn bias back to the upside for 1.1709 high. Break will resume medium term rally to 1.2 key level. However, break of 1.1483 will be an early sign of reversal. In that case, deeper decline should be seen back to 1.1355 support.
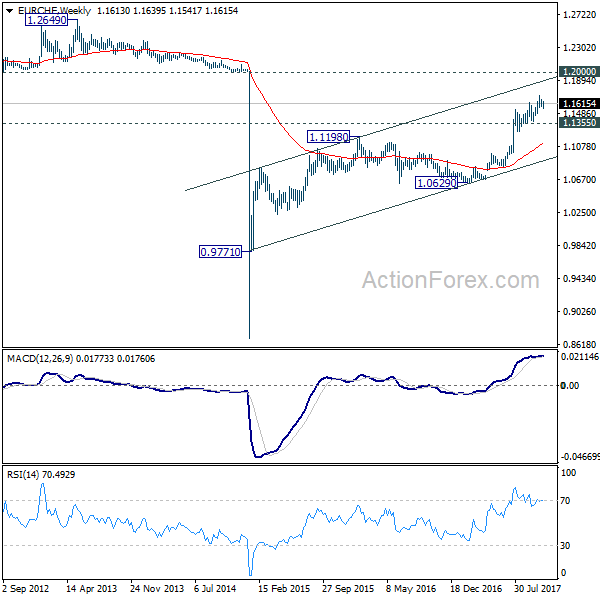
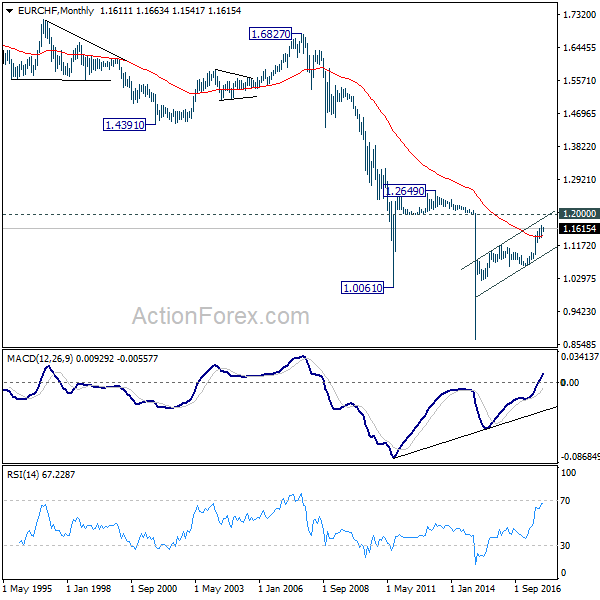
In the bigger picture, long term rise from SNB spike low back in 2015 is still in progress. EUR/CHF should now be heading back to prior SNB imposed floor at 1.2000. For now, this will be the favored case as long as 1.1355 support holds. However, break of 1.1355 will indicate medium term topping. In that case, EUR/CHF should head back to 55 week EMA (now at 1.1105) and possibly below.
Dollar Ended Broadly Lower on Tax Plan Jitters, Rally Resumption Delayed
It was a rather dull week last week as US tax plan was the main market driver. Dollar ended broadly lower as investors were clearly dissatisfied with the Senate's version of the plan, which delay corporate tax cut by a year. But judging from reactions in US stocks, comparing to European markets, sentiments were not that bad. For the moment, DOW's up trend is still intact. Similar picture is seen in Dollar which is holding above key near term support level against all other major currencies. Indeed, US long term yields staged the strongest rally in more than a month on Friday, on worry off additional bond supply next year. And the surge in 10 year yield could provide the greenback with extra support. The economic calendar with come back this week with more important economic data, like CPI fro US and UK. And, with a tight working schedule, US tax plan will stay on top as a key focus in the markets.
DOW showed resilience comparing to DAX and FTSE
DOW made new record high at 23602.12 last week. But it failed to sustain above 100% projection of 20379.55 to 22179.11 from 21721.12 at 23530.68 and retreated. With daily MACD dived below signal line, a short term top is in place and more corrective trading would be seen in near term. But as long as 23251.11 support holds, such correction/consolidation should be brief. Another rise is expected through 23602.12 to 161.8% projection at 24642.80. However, firm break of 232.51.11 will bring deeper pull back to 55 day EMA (now at 22814.51) before up trend resumption.
DAX also hit record high at 13525.56 but retreated steeply since then. A short term top is in place and more corrective trading would be seen. But outlook will remain bullish as long as 12911.58 support holds. The larger up trend is expected to continue through 13525.56 high. However, firmed break of 12911.58 will be an early sign of medium term reversal and bring deeper fall to trend line support (now at 12347. )
FTSE's sharp decline last week and firm break of 55 day EMA suggests that rise from 7196.58 has completed at 7582.85, ahead of 7598.99 high. Fall from 7582.82 is tentatively viewed as the third leg of the pattern from 7598.99 and could target 7196.58 support. At this point, we'd expect strong support from there to bring rebound. However, firm break there will complete a double top reversal pattern and will indicate medium term trend reversal.
TNX rebound strongly on Friday, maintains bullishness
10 year yield's strong rebound of Friday argues that pull back from 2.475 has completed at 2.304, after drawing support from 55 day EMA. More importantly, as 2.273 structural support remains intact, so is near term bullish outlook. That is, we're holding on to the view that correction from 2.621 has completed at 2.103. And rise from 2.034 is still in progress and would resume through 2.475 to retest 2.621 high later.
Dollar stayed in consolidation with bullishness intact
Dollar index's consolidation from 95.15 extended last week after failing to take out this resistance. While there was a steep selloff in the latter part of the week, DXY is held well above 93.47 support so far. Thus, near term outlook remains cautiously bullish. We're holding on to the view that whole medium term fall from this year's high at 103.82 has completed at 91.01 after drawing support from long term cluster at 91.91/93 (38.2% retracement of 72.69, 2011 low, to 103.82, 2016 high). Break of 95.15 will target 38.2% retracement of 103.82 to 91.01 at 95.90 and then 61.8% retracement at 98.92 and above.
Trading strategy
Dollar's pull back last week is seen as a correction for the moment. And we're expecting more dollar buying ahead as the reconciled tax plan of House and Senate emerges. Hence, we'll stay with out USD/JPY long position (bought at 114.50). Stop will be kept at 112.80. As noted before, the medium term correction from 118.65 should have completed at 107.31. We'd expect a strong break of 114.49 key resistance later to confirm this bullish view. 118.65 is the first target. We'll look at the upside momentum on rally resumption to gauge the chance of hitting 2015 high at 125.85 at a later stage.
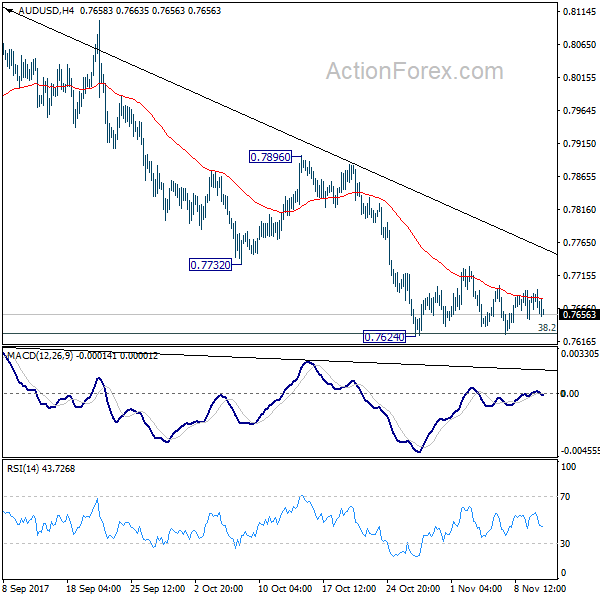
Meanwhile, RBA monetary policy statement released on Friday confirmed the view that the central bank will stay on hold. Monetary policy divergence will keep AUD/USD pressured. We'll try to sell AUD/USD on break of 0.7624 this week. In our view, the medium term rise from 0.6826 should have completed with three waves up to 0.8124. Going forward, first target is 0.7328 cluster support (61.8% retracement of 0.6826 to 0.8124). But we'll also look at downside momentum to assess the chance of breaking through 0.6826 low to resume the long term down trend. Stop will be placed at 0.7710, slightly above last week's high.
AUD/USD Weekly Outlook
AUD/USD's consolidation from 0.7624 continued last week and outlook is unchanged. Initial bias remains neutral this week first. In case of another recovery, upside should be limited well below 0.7896 resistance to bring fall resumption. On the downside, decisive break of 0.7624 will resume whole fall from 0.8124 and target next key cluster level at 0.7322/8.
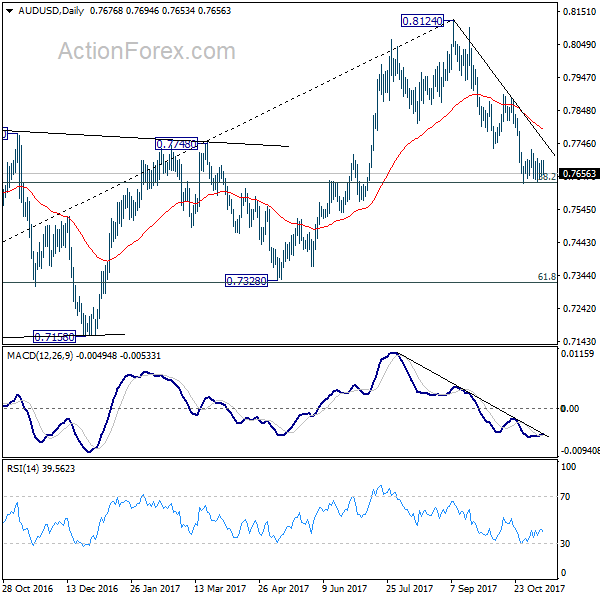
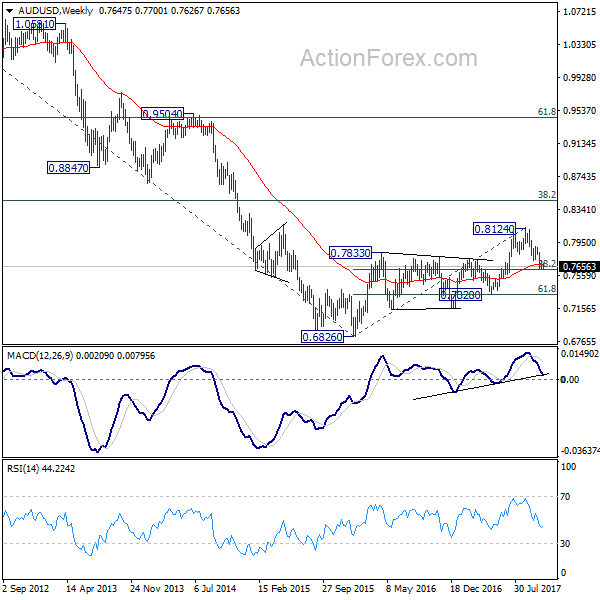
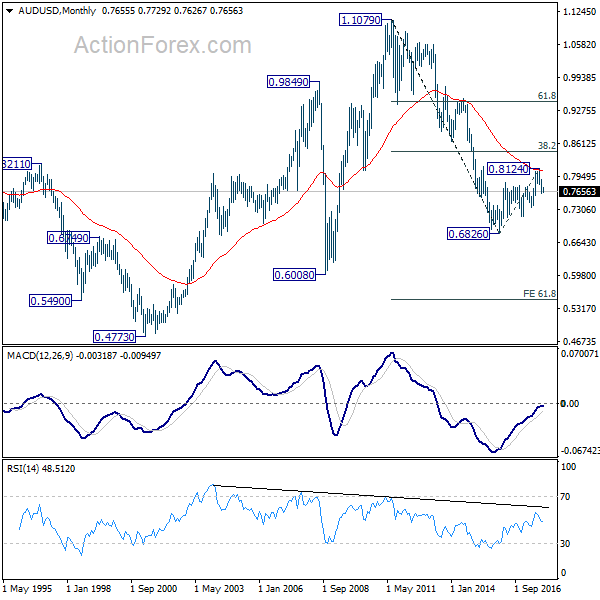
In the bigger picture, corrective rise from 0.6826 medium term bottom is likely completed at 0.8124, after hitting 55 month EMA (now at 0.8067). Decisive break of 0.7328 key cluster support (61.8% retracement 0.6826 to 0.8124 at 0.7322) will confirm. And in that case, long term down trend from 1.1079 (2011 high) will likely be resuming. Break of 0.6826 will target 61.8% projection of 1.1079 to 0.6826 from 0.8124 at 0.5496. This will now be the favored case as long as 0.7896 near term resistance holds.
In the longer term picture, 0.6826 is seen as a long term bottom. Rise from there could either reverse the down trend from 1.1079, or just develop into a corrective pattern. At this point, we're favoring the latter. And, as long as 38.2% retracement of 1.1079 to 0.6826 at 0.8451 holds, we'd anticipate another decline through 0.6826 at a later stage. But strong support should be seen between 0.4773 (2001 low) and 0.6008 (2008 low).
Eco Data 11/17/17
[php_everywhere] [/php_everywhere]
Eco Data 11/16/17
[php_everywhere] [/php_everywhere]
Eco Data 11/15/17
[php_everywhere] [/php_everywhere]
Eco Data 11/14/17
[php_everywhere] [/php_everywhere]
Eco Data 11/13/17
[php_everywhere] [/php_everywhere]