
Sample Category Title
EUR/GBP Strong Downside Risk
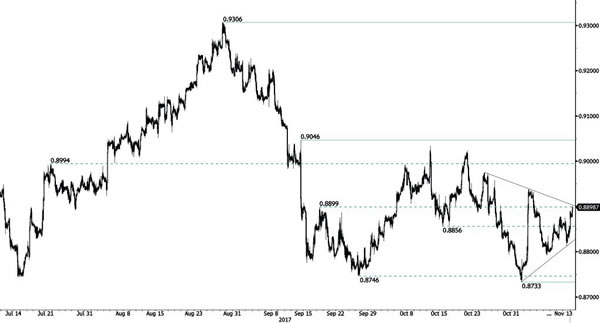
EUR/GBP lies into a symmetrical triangle. As long as prices are below the resistance at 0.9046 (05/09/2017 high), the short-term technical structure is biased to the downside. Hourly support is given at a distance at 0.8733 (01/11/2017 low).
In the long-term, the pair has largely recovered from recent lows in 2015. The technical structure suggests a growing upside momentum. The pair is trading above from its 200 DMA. Strong resistance can be found at 0.9500 (psychological level).
Gold Remains In 1-Month Range, Short-Term Bearish Outlook Unchanged
Gold has been maintaining a neutral bias for just over a month now after entering a consolidation phase. The downtrend from a multi-month high at 1357.47 has not shown signs of reversal yet as the market remains well below the mid-point of this decline to 1260.59.
Prices are currently trapped below the 23.6% Fibonacci retracement level at 1283.39. This resistance level needs to be breached to see a move towards the key 1300.00 level. But only a rise above the 50% Fibonacci at 1308.95 would shift the market’s focus back to the upside. Breach of resistance at 1320.13 (61.8% Fibonacci) would indicate the downtrend has ended and from this point, the odds would increase for a test of the 1357.47 peak.
A break below 1260.59 would bring a resumption of the downtrend that started from 1357.47 and confirm the bearish outlook on the 4-hour chart with scope to target 1251.49 and 1204.79.
AUD/USD Descending Triangle
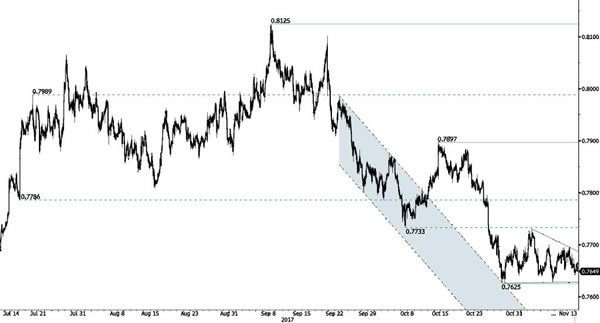
AUD/USD is ready to go even lower showing that downside pressures are still lively. Hourly resistance is given at a distance at 0.7897 (13/10/2017 high). Expected to show renewed pressures towards key support at 0.7571 (05/07/2017 low).
In the long-term, the trend is turning positive. Key supports stands at 0.6009 (31/10/2008 low) . A break of the key resistance at 0.8164 (14/05/2015 high) is needed to invalidate our long-term bearish view.
USD/CAD Ready To Bounce Back
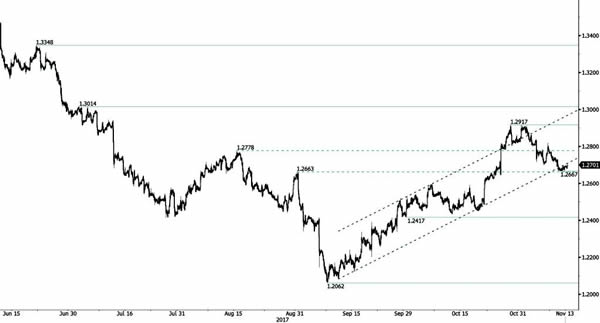
USD/CAD continues to decline, but at a slower pace, after the set-up of a resistance at 1.2917 (27/10/2017 low). Hourly support lies at 1.2667 (10/11/2017 low). Expected to show continued short-term bearish pressures.
In the longer term, the pair has broken longterm support that can be found at 1.2461 (16/03/2015 low). Strong resistance is given at 1.4690 (22/01/2016 high). The pair is likely to head further lower.
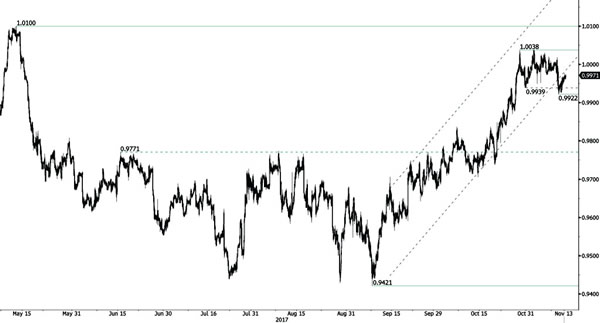
USD/CHF Increasing Selling Pressures
USD/CHF is consolidating lower. Yet, the technical structure is still bullish. Yet, the pair has failed to hold consistently above the parity. The technical structure suggests growing selling pressures.
In the long-term, the pair is still trading in range since 2011 despite some turmoil when the SNB unpegged the CHF. Key support can be found 0.8986 (30/01/2015 low). The technical structure favours nonetheless a long term bullish bias since the unpeg in January 2015
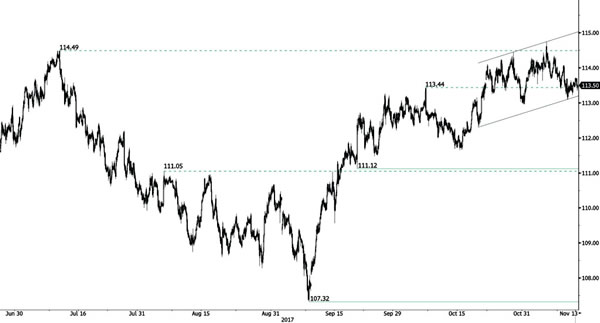
USD/JPY Ready To Bounce Back
USD/JPY is riding uptrend channel below former resistance at 114.49 (11/07/2017 high). Hourly support is given at 113.09 (09/10/2017 low). Strong support is located at a distance at 111.12 (20/09/2017 low).
We favor a long-term bearish bias. Support is now given at 99.02 (10/08/2013 low). A gradual rise towards the major resistance at 125.86 (05/06/2015 high) seems unlikely. Expected to decline further support at 93.79 (13/06/2013 low).
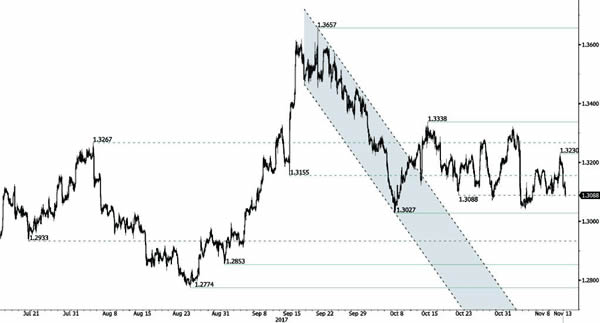
GBP/USD Volatility Declines
GBP/USD is still holding below 1.32. Support is given at 1.3027 (06/10/2017 low). Resistance area is given around 1.3200. Expected to show further increase.
The long-term technical pattern is reversing. The Brexit vote had paved the way for further decline. Long-term support can be found at 1.1841 (07/10/2017 low). Long-term resistance given around 1.35 is at stake and indicates a long-term reversal in the negative trend. Yet, it is very unlikely at the moment.
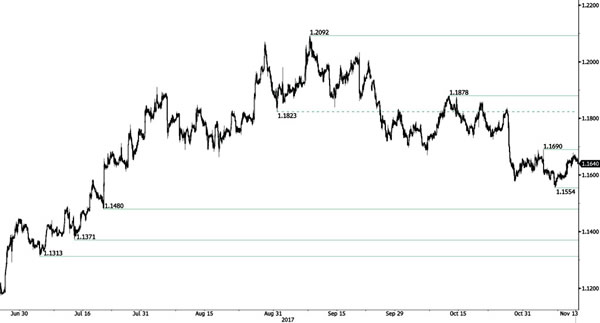
EUR/USD Sideways Price Action
EUR/USD is still biased to the downside despite the current rebound. Hourly resistance is located at 1.1690 (03/11/2017 high). Hourly support is given at 1.1554 (07/11/2017 low). Expected to show some short-term consolidation.
In the longer term, the momentum is now turning largely positive. We favour a continued bullish bias. Key resistance is holding at 1.2252 (25/12/2014 high) while strong support lies at 1.0341 (03/01/2017 low).
Technical Outlook: WTI OIL – Strong Technical Signals Warn Of Correction
WTI Oil holds in red on Monday and extends lower, despite expectations to rise after pipeline disruption in the Middle East and concerns of oil facilities damage on deadly earthquake that hit Iran and Iraq early on Monday.
Fresh easing is threatening Friday’s low at $56.54 and key near-term support at $56.40 (08 Nov low) loss of which would generate stronger bearish signal for extended pullback.
Completion of diamond top pattern on daily chart reversal of indicators from overbought territory are strong bearish signals which indicate correction.
Extension below rising 10SMA ($56.08) is needed to confirm scenario.
Res: 57.00, 57.51, 57.90, 58.85
Sup: 56.40, 56.08, 55.82, 54.53
Sterling Traders Losing Confidence | Big Drop In Bitcoin | Geopolitical Tensions Surged In Middle East
Bitcoin euphoria came out, dropped 29% over the weekend
Sterling is surely out of luck
Continuing talks on the US tax legislation under focus
Saudi Arabia called for an urgent meeting among Arab counties to discuss Iran
Investors are cautious this morning after a negative close on Wall Street on Friday. But not everything is negative, thanks to Single Day which helped the e-commerce giant Alibaba to post another record of $25 billion in sales against its previous number of $17.8 billion.
Bitcoin isn't the most favourable asset among investors as some of the euphoria came out it. Investors took profit off the table and this pushed the price of Bitcoin down by 11 percent. The move came mainly due to the cancellation of the technology upgrade.
In terms of currencies; Sterling is surely out of luck on the back of the news that Theresa May has lost her supporters confidence. Nearly 40 conservative MPs have agreed to sign a letter which would entail no confidence in her.
If and when the letter is signed, it could push the Sterling even lower because it would raise a threat to her leadership. Another election in the UK would be the last thing which the public would have desired because they are really tired of this repetitive voting process. The Brexit negotiation process is also facing greater challenges due to the lack of the firm leadership which is also having an impact on the currency and it has also created an impact on businesses in the UK.
Something which investors would keep a close eye on would be the continuing talks on the US tax legislation. Not much progress has been made yet and investors would seek more clarity. Something of interest would be the speeches from the several members of the Federal Reserve committee and if they would increase the interest rate one more time this year.
Geopolitical tensions over in the Middle East are increasing day by day and investors are likely to gauge the impact of these by looking at the price of gold and oil. The deputy crown prince of Saudi Arabia who is hungry for more power, has called for an urgent meeting among Arab counties to discuss Iran.
The recent purge under the headline of corruption to fill the country's coffin could just help his aim to push the country's agenda through out the region. Lebanon is at the heart of this discussion and Saudi Arabia clearly wants to eradicate the control of Iran in Lebanon and in Syria.
The young, inexperienced and power hungry prince has major challenges and the question is if his policies would make the region more unstable. Gold and oil would be your primary indicator and any increase in tensions would bring some serious moves in them.