Sample Category Title
EURUSD – Near-Term Bias Turns Higher after Correction
The Euro regained traction and bounced from session low at 1.1637 to regain levels near Friday's peak at 1.1677. Weaker dollar helps to maintain momentum from last week's rally for attack at next barriers at 1.1685 (20SMA) and 1.1690 (03 Nov high). Rising hourly cloud and daily 10SMA continue to underpin after staying intact on today's pullback. Sustained break above 20SMA to open 30/100SMA's (1.1716/27) and would expose key obstacles at 1.1800/15 (55SMA/daily cloud base). Alternative scenario requires sustained break below 10SMA to neutralize near-term bulls.
Res: 1.1677; 1.1690; 1.1716; 1.1727
Sup: 1.1637; 1.1629; 1.1585; 1.1553
Yen Looking for Direction, Investors Eye Kuroda Comments
USD/JPY is showing limited movement in the Monday session. In North American trade, USD/JPY is trading at 113.49, down 0.03% on the day. On the release front, Japanese PPI jumped to 3.4%, above the forecast of 3.1%. There are no major indicators out of Japan or the US. Bank of Japan Governor Haruhiko Kuroda will speak at an event in Zurich. On Tuesday, Kuroda and Federal Reserve Chair Janet Yellen will participate in a panel at an ECB event in Frankfurt. As well, the US will release PPI and Core PPI reports.
As Prime Minister Shinzo Abe begins a new term in office, he can point to his economic platform as being partially successful. The 'Abenomics' program is based on three prongs – ultra-loose monetary easing, fiscal spending and structural reforms to the economy. The program has been in place since 2012, and the economy is finally on its feet, as GDP continues to expand. However, inflation remains stubbornly low, and a strong labor market has not led to higher wages,which would help boost inflation. Companies continue to look for ways to spend their cash, such as buying foreign companies, but are reluctant to plow more funds into wages. Business confidence in the economy remains lukewarm, and businesses are reluctant to add to their fixed costs. The BoJ has urged companies to increase wages, but this is unlikely to occur until the business sector is convinced that the current economic rebound will be long-lasting.
The Bank of Japan has faced criticism over its ultra-accommodative stimulus program, but received support from the IMF last week. The IMF stated that the BoJ should maintain the program in order to boost inflation, which remains at low levels, despite a stronger Japanese economy. Critics have argued that the massive stimulus has distorted markets, such as a 26-year high for the Tokyo stock market. However, the BoJ has consistently said that it will not taper the program until inflation moves closer to the Bank's 2 percent target. This stance puts the BoJ at odds with the Federal Reserve and the ECB, which are looking to reduce stimulus. However, the IMF noted that this divergence had not caused any significant capital outflows out of Asia, since the Fed and ECB had clearly communicated to the markets their shift in policy.
Political Uncertainty Dominates GBP-Trading
- European equities extended their correction lower with main indices losing up to 1.25% (CAC 40) despite an empty eco calendar. US stock markets also opened in negative territory, but losses are modest (0.2%-0.3%)
- Catalonia's deposed president Puidgemont said he might consider a solution to Spain's political crisis that did not involve the region's secession, appearing to soften the staunchly pro-independence stance that cost him his leadership last month.
- South Africa's currency and government bonds came under heavy pressure, as the departure of a senior civil servant raised fears that supporters of the president were interfering with the Treasury's operations to force through controversial spending measures. USD/ZAR rose above 14.50 for the first time this year.
- OPEC and non-OPEC oil producers are moving towards deciding at their Nov. 30 meeting whether to extend a global agreement to curb oil supply further into 2018, two ministers said, a quicker time frame than previously indicated. Brent crude trades stable around $63.5/barrel.
- The European Central Bank's monetary policy must remain easy as inflation in the euro zone continues to lag its 2% target despite stronger economic growth and falling unemployment, vice president Constancio said.
- China's new loans fell more than expected in October to their lowest in a year as banks tightened mortgage lending and corporates continued to shun bank loans, amid a continuing clampdown on risky shadow lending activities.
- The Belgian Debt Agency decided to cancel the last remaining OLO auction of the year which was scheduled for November 20, 2017, on the back of its reduced funding requirements. As such, the OLO issuance in 2017 will amount to EUR 35.55 billion.
Rates
Lackluster performance core bonds despite weak stocks
Global core bond trading was confined to tight ranges. An attempt to rise on weak stock markets (-1%) rapidly ran out of steam. As the US trading session gets going, the Bund even faces new selling pressure. All in all, it's a continuation of the trends of the end of last week: core bonds can't profit in a risk-off environment. Today's eco calendar was empty and might have kept investors sidelined ahead of central bank speakers (ECB Draghi, Fed Yellen, BoE Carney and BoJ Kuroda; tomorrow) and key US eco data (CPI inflation, retail sales on Wednesday).
At the time of writing, changes on the German yield curve range between +0.2 bps (2-yr) and -1.1 bp (30-yr). The US yield curve flattens as well with changes varying between +0.6 bps (2-yr) and -2.8 bps (30-yr). On intra-EMU bond markets, 10-yr yield spreads versus Germany narrow up 1 bp with Spain (-4 bps), Portugal (-6 bps) and Greece (-9 bps) outperforming. Catalan president Puigdemont suggested he is open to alternatives to Catalan independence.
The Italian debt agency successfully kicked off this week scheduled EMU bond supply by tapping the on the run 3-yr BTP (€2 bn 0.2% Oct2020), 7-yr BTP (€2.5 bn 1.45%Nov2024) and 15-yr BTP (€1.5 bn 2.45% Sep2033). The total amount sold was the maximum of the targeted €4.5-6 bn with a total auction bid cover of 1.56, which is good for Italian standards. The Belgian debt agency cancelled the last remaining OLO auction of the year (scheduled for Monday Nov 20) on the back of its reduced funding requirements. 2017 OLO issuance totaled €35.55 bn.
Currencies
USD/JPY and EUR/USD hold tight ranges despite risk-off
Today's trading in EUR/USD and USD/JPY was quite similar to what happened at the end of last week. Equity sentiment remained risk-off, but core bond yields hardly declined. EUR/USD traded with a slightly positive bias intraday, but the 1.1690 resistance holds, for now. Ongoing high core yields also prevent substantial USD/JPY losses. The pair trades in the 113.35 area.
Asian equities traded mixed overnight. Chinese indices outperformed. Most other indices showed small losses with Japan underperforming. The yen again hardly profited from risk aversion in Japan. USD/JPY held in the mid 113 area. The dollar was slightly better bid early in the session, but there was no clear trend. EUR/USD didn't go anywhere, hovering in the 1.1650 area.
There was no high profile story to guide trading on the European markets. European equities opened little changed, but sentiment gradually turned risk-off. The slide on the equity markets didn't help core bonds much, as was the case last week. An attempt of the bund to rally stalled. Long term interest rate differentials again narrowed slightly in favour of the euro. Changes in EUR/USD remain modest (currently 1.1665/70 area), but the pair again neared the 1.1690 minor resistance. The ongoing resilience of core yields despite the intraday risk-off still prevents any meaningful gains of the yen. USD/JPY trades in the 113.30 area. EUR/JPY (132.20) is holding a tight range in the 131.40/133.15 range.
Political uncertainty dominates GBP-trading
Sterling came under pressure as UK political risk dominated the headlines. Press articles during the weekend indicated that a growing number of Conservative MP's is supporting a call to vote on PM's May leadership. This was one of many illustrations on the deep division within the Conservative party at a key juncture in the Brexit process. Tomorrow, the UK Parliament will start the examination of the Brexit Withdrawal Bill. At the same time PM May remains under pressure to make progress in the negotiations with the EU. Sterling came already under pressure this morning in Asia and the move was extended during the European morning session. EUR/GBP regained a minor resistance area in the high 0.88 area and settled north of 0.89 (currently 0.8910). Cable dropped to the 1.3062 area, but the ST range bottom (1.3040/27) was left intact. A break below this level, would worsen the picture for sterling and could also spill over to other cross rates. Cable (currently 1.3085) trades off the intraday lows due to USD softness, but the picture of sterling remains fragile.
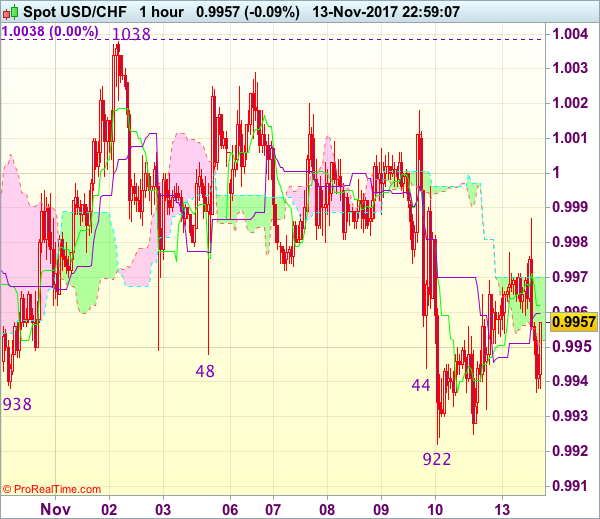
Trade Idea Wrap-up: USD/CHF – Sell at 0.9995
USD/CHF - 0.9952
Most recent candlesticks pattern : N/A
Trend : Sideways
Tenkan-Sen level : 0.9969
Kijun-Sen level : 0.9951
Ichimoku cloud top : 0.9970
Ichimoku cloud bottom : 0.9956
New strategy :
Stand aside
Position : -
Target : -
Stop : -
Although the greenback found support at 0.9922 late last week and has recovered, reckon upside would be limited to 0.9995-1.0000 and price should falter below 1.0020, bring another decline later, below 0.9920-22 (38.2% Fibonacci retracement of 0.9737-1.0038) would extend the erratic decline from 1.1038 top to 0.9885-90 (50% Fibonacci retracement) but reckon support at 0.9869 should remain intact, bring rebound later.
In view of this, we are looking to sell dollar on recovery as 1.0000 should limit upside. Only break of said resistance at 1.0038 would revive bullishness and confirm the rise from 0.9421 low has resumed and extend further gain to 1.0050-55, then towards 1.0075-80 but price should falter below 1.0100 chart resistance.
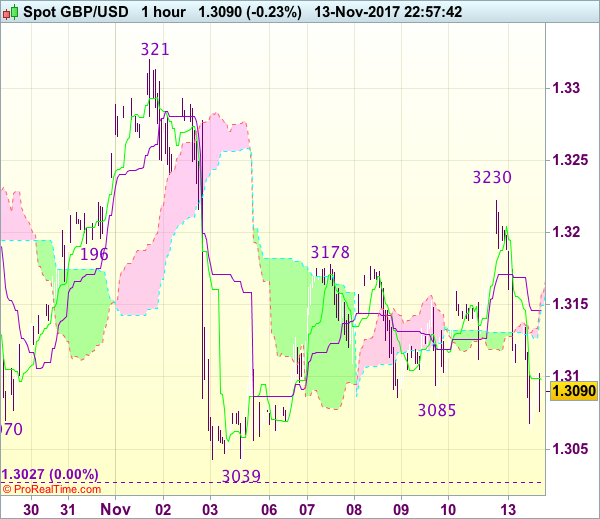
Trade Idea Wrap-up: GBP/USD – Stand aside
GBP/USD - 1.3100
Most recent candlesticks pattern : N/A
Trend : Near term down
Tenkan-Sen level : 1.3090
Kijun-Sen level : 1.3146
Ichimoku cloud top : 1.3159
Ichimoku cloud bottom : 1.3150
New strategy :
Stand aside
Position : -
Target : -
Stop : -
Despite rising briefly to 1.3230 on Friday, lack of follow through buying and the subsequent retreat suggest further choppy trading would be seen and weakness towards 1.3050-55 cannot be ruled out, however, break there is needed to revive bearishness and signal the rebound from 1.3039 has ended, bring test of indicated strong support area at 1.3027-39, only break there would confirm decline has resumed for further fall to psychological support at 1.3000.
In view of this, would not chase this fall here and would be prudent to stand aside in the meantime. Above the Kijun-Sen (now at 1.3146) would prolong choppy trading and bring recovery to 1.3180-90 but said resistance at 1.3230 would hold from here, bring further consolidation. Above said resistance at 1.3230 would extend the erratic rise from 1.3039 to 1.3250, then 1.3275-80.
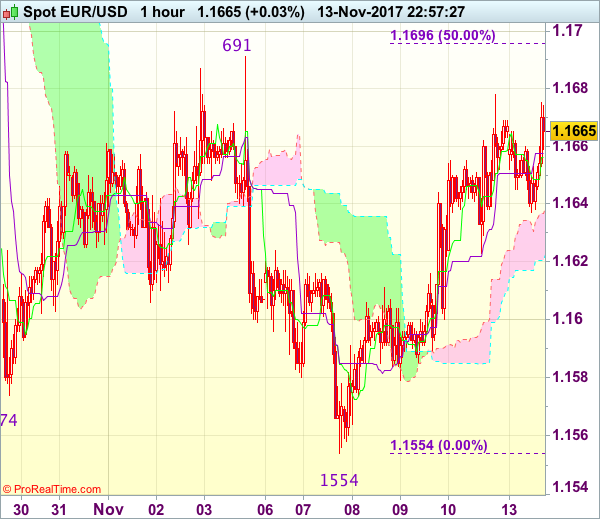
Trade Idea Wrap-up: EUR/USD – Buy at 1.1600
EUR/USD - 1.1665
Most recent candlesticks pattern : N/A
Trend : Down
Tenkan-Sen level : 1.1656
Kijun-Sen level : 1.1658
Ichimoku cloud top : 1.1639
Ichimoku cloud bottom : 1.1623
Original strategy :
Buy at 1.1600, Target: 1.1700, Stop: 1.1565
Position : -
Target : -
Stop : -
New strategy :
Buy at 1.1625, Target: 1.1725, Stop: 1.1590
Position : -
Target : -
Stop : -
As the single currency has eased after surging to 1.1678, suggesting consolidation below this level would be seen and pullback to 1.1615-20 cannot be ruled out, however, reckon downside would be limited to 1.1600 and bring another rise later, above said resistance at 1.1678 would extend the rise from 1.1554 low to 1.1691-96 (previous resistance and 50% Fibonacci retracement of 1.1837-1.1554) but reckon upside would be limited to 1.1725-29 (previous support now resistance and 61.8% Fibonacci retracement), bring retreat later.
In view of this, we are looking to buy euro on pullback as 1.1620-25 should limit downside and bring another rebound later. Below 1.1600 would bring weakness to 1.1675-80, however, downside should be limited and bring another rebound. Break of 1.1575-80 would defer and risk a retest of last week’s low at 1.1554 first.
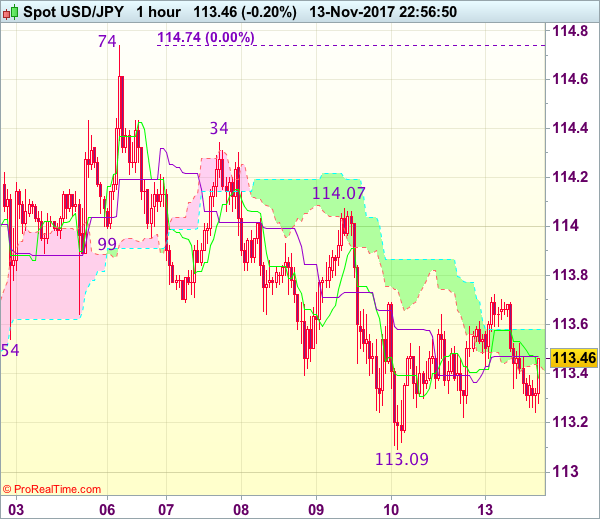
Trade Idea Wrap-up: USD/JPY – Hold short entered at 114.00
USD/JPY - 113.47
Most recent candlesticks pattern : N/A
Trend : Near term down
Tenkan-Sen level : 113.38
Kijun-Sen level : 113.47
Ichimoku cloud top : 113.58
Ichimoku cloud bottom : 113.44
Original strategy :
Sold at 114.00, Target: 113.00, Stop: 113.70
Position : - Short at 114.00
Target : - 113.00
Stop : - 113.70
New strategy :
Hold short entered at 114.00, Target: 113.00, Stop: 113.70
Position : - Short at 114.00
Target : - 113.00
Stop : - 113.70
Although the greenback recovered after holding above last week’s low at 113.09 and further consolidation would be seen, reckon upside would be limited to 113.65-70 and bring another decline later, below 113.20 would bring retest of said support at 113.09, break there would extend the fall from 114.74 top to previous support at 112.96, below there would bring further subsequent selloff to 112.60 but support at 112.30 should hold from here due to near term oversold condition.
In view of this, we are holding on to our short position entered at 114.00. Only above resistance at 114.07 would abort and signal the retreat from 114.74 has ended instead, bring a stronger rebound to 114.34, then retest of this level, above there would revive bullishness and extend recent rise from 107.32 to 115.00.
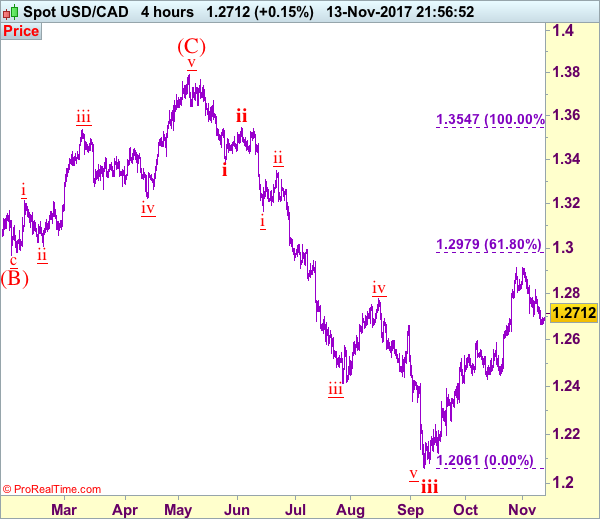
Trade Idea: USD/CAD – Sell at 1.2770
USD/CAD - 1.2712
Trend: Near term up
New strategy :
Sell at 1.2770, Target: 1.2570, Stop: 1.2830
Position: -
Target: -
Stop:-
As the greenback has recovered after finding good support at 1.2665 last week, suggesting consolidation above this level would be seen and corrective bounce to 1.2750 cannot be ruled out, however, reckon upside would be limited to 1.2770 and price should falter well below resistance at 1.2820, bring another decline later, below said support at 1.2665 would extend the fall from 1.2917 top for retracement of recent rise to support at 1.2636 but a drop below this level is needed to signal recent rise has ended at 1.2917, bring further fall to 1.2600 and later towards 1.2550-60.
In view of this, we are looking to sell on further subsequent recovery. Only above resistance at 1.2820 would abort and signal the retreat from 1.2917 has ended at 1.2665 instead, bring a stronger rebound to 1.2870-80 but said resistance at 1.2917 should hold. Looking ahead, as we are still treating this rebound from 1.2061 as wave iv, reckon 1.2975-80 (61.8% Fibonacci retracement of wave iii) would limit upside and 1.3000 should hold, bring selloff later in wave v. We are keeping our count that wave v as well as wave (C) ended at 1.3794 and impulsive wave (i ii, i ii) is now unfolding with minor wave iii ended at 1.2414, followed by wave iv correction ended at 1.2778, wave v has reached our indicated downside target at 1.2100 and may extend to 1.2000.
To recap, wave B from 1.3066 is unfolding as an a-b-c and is sub-divided as a: 1.2192, b: 1.2716 and wave c is a 5-waver with i: 1.1983, ii: 1.2506, extended wave iii with minor iii at 1.0206, wave iv ended at 1.0781 and wave v as well as wave iii has ended at 0.9931, hence the subsequent choppy trading is the wave iv which is unfolding as (a)-(b)-(c) with (a) leg of iv ended at 1.0854, followed by (b) leg at 1.0108 and (c) leg as well as the wave iv ended at 1.0674. The wave v is sub-divided by minor wave (i): 0.9980, (ii): 1.0374, (iii): 0.9446, (iv): 0.9913 and (v) as well as v has possibly ended at 0.9407, therefore, consolidation with upside bias is seen for major correction, indicated target at 1.3700 and 1.4000 had been met and further gain to 1.4700 would be seen later.
Canadian Dollar Steady in Thin Holiday Trade
The Canadian dollar has edged higher in the Monday session. In the North American session, USD/CAD is trading at 1.2707, up 0.19% on the day. On the release front, Canadian banks are closed for Remembrance Day. In the US, the sole event is the Federal Budget Balance, with a deficit of $58.2 billion expected in October, after a surplus the month before.
After staying on the sidelines in October, the Bank of Canada has left the markets guessing regarding a December rate hike. Last week, BoC Governor Stephen Poloz downplayed concerns about low inflation levels, as the inflation target of 2 percent remains elusive. The BoC will have to keep a close eye on developments south of the border. The Federal Reserve is almost certain to raise rates in December, and if the BoC does not match the hike, the Canadian dollar will likely weaken against the greenback. Another headache for the BoC is the threat from the US administration to pull out of the NAFTA agreement, which is a cornerstone of Canada's economy. On his Asian trip, US President Trump has reiterated that he favors bilateral trade agreements, rather than multilateral arrangements. If Trump applies this stance to relations with Canada and Mexico, NAFTA could be in trouble, and this could bode badly for the Canadian dollar.
The week ended on a sour note, as consumer confidence disappointed. UoM Consumer Sentiment was unexpectedly soft on Friday, coming in at 97.8, missing the forecast of 100.8 points. Last week's unemployment claims were a disappointment at 239 thousand, climbing to a 4-week high. Investor sentiment will not fall after one soft employment report, but there are some concerns with the US labor market. Nonfarm payrolls rebounded in October with a gain of 261 thousand, after a rare decline a month earlier. Still, this reading was well off the forecast of 312 thousand. Wage growth remains a problem, reflective of chronically low inflation. In October, Average Hourly Earnings posted a flat 0.0%, the first time wages have not increased since November 2016.
Oil Markets Turn Bullish With Shift to Backwardation
This week both Brent Crude and WTI (Light Sweet Crude Oil) made a new price high in more than 2 years with Brent Crude rising to $64 per barrel and WTI to $57 per barrel. These price gains come before the OPEC's meeting later this month on Nov 30. In the past two years, OPEC has imposed production cuts in its member countries in order to remove excess inventory and halt the price drop. In their last meeting on May, the cartel agreed to extend 1.8 million barrel a day cuts into the first quarter of 2018.
Recently, OPEC officials have given a signal that they will extend the production cuts beyond March 2018 at their next meeting in Vienna later this month. More importantly, this extension will occur at a time when the oil market has already tightened. The OPEC's attempt to reduce the inventories appears to be bearing fruit. The chart below shows US crude and product inventories fall by 93.8 million barrels since the start of the year.
One of the reasons for this success is OPEC members' compliance to the agreed upon production cuts from last year. In October, the compliance reaches 104% as the chart below shows
Further evidence that oil market is tightening could be found in oil futures market. Both Brent and WTI are now in the state of backwardation. This is a situation where the current price of oil for immediate shipment is higher than the price for future delivery. It signals that the market is tightening and discourage traders from stockpiling barrels. Conversely, contango is when the futures price of oil is higher than the current spot price. Brent has been in backwardation earlier this year, while WTI just recently moved to backwardation as the chart below shows:
This shift to backwardation from contango have important implication. First of all, it suggests that OPEC's production quotas in the past two years have been successful. Secondly, the shape of the oil curve is an important predictor of future returns. For example, subsequent four and 12 week returns for long oil future position in backwardated market have averaged 1.3% and 2.9%, respectively. In comparison, the same periods see a return of -1.7% and -3.8% on average during contango markets.
If OPEC can extend the production cuts through the remainder of 2018 in their next meeting, the bullish momentum in Oil could perhaps continue into 2018. With the market already tightening, an extension in the production quotas could further reduce any remaining excess supply and support oil spot price.
WTI (CL #F) Oil Long Term Chart
The Long Term chart of Oil shows a 5 swing bullish sequence from Feb 2016 low, favoring more upside. Please note a 5 swing sequence is different than 5 waves impulse. Oil is currently favored to extend higher in 7 swing towards $67.4 – $73.4 target. The length of time from Feb 2016 low (0) to Jan 2017 high (3) is 47 weeks or almost 11 months. If we assume Oil will take the same amount of time from June 2017 low (4), then adding 47 weeks will give us May 2018 as an estimated time for the $67.4 – $73.4 target.