Sample Category Title
Trade Idea : USD/CHF – Sell at 0.9995
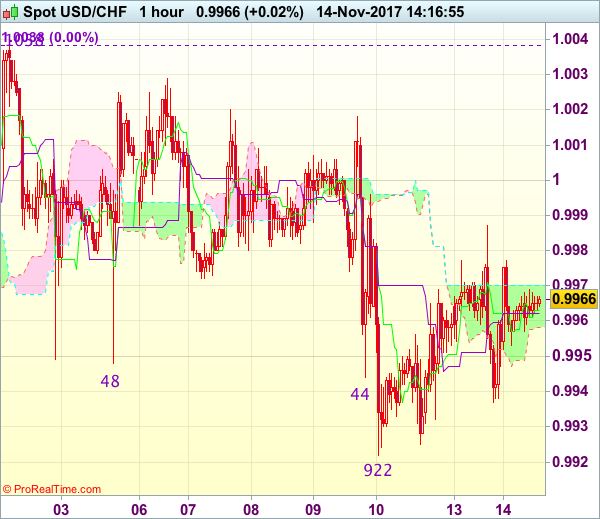
USD/CHF - 0.9967
Most recent candlesticks pattern : N/A
Trend : Sideways
Tenkan-Sen level : 0.9964
Kijun-Sen level : 0.9962
Ichimoku cloud top : 0.9970
Ichimoku cloud bottom : 0.9958
New strategy :
Stand aside
Position : -
Target : -
Stop : -
Although the greenback found support at 0.9937 yesterday and has recovered again, reckon upside would be limited to 0.9995-1.0000 and price should falter below 1.0020, bring another decline later, below 0.9920-22 (38.2% Fibonacci retracement of 0.9737-1.0038) would extend the erratic decline from 1.1038 top to 0.9885-90 (50% Fibonacci retracement) but reckon support at 0.9869 should remain intact, bring rebound later.
In view of this, we are looking to sell dollar on subsequent recovery as 1.0000 should limit upside. Only break of said resistance at 1.0038 would revive bullishness and confirm the rise from 0.9421 low has resumed and extend further gain to 1.0050-55, then towards 1.0075-80 but price should falter below 1.0100 chart resistance.
Current Ultra-Loose Monetary Policy To Persist: BoJ Kuroda
For the 24 hours to 23:00 GMT, the USD declined 0.07% against the JPY and closed at 113.61.
Yesterday, the Bank of Japan (BoJ) Governor, Haruhiko Kuroda, reiterated the need to continue with the central bank's current monetary stimulus in order to meet its 2.0% inflation target.
In economic news, Japan's preliminary machine tool orders advanced 49.9% on an annual basis in October. In the prior month, machine tool orders had risen 45.0%.
In the Asian session, at GMT0400, the pair is trading at 113.62, with the USD trading marginally higher against the JPY from yesterday's close.
The pair is expected to find support at 113.34, and a fall through could take it to the next support level of 113.05. The pair is expected to find its first resistance at 113.82, and a rise through could take it to the next resistance level of 114.01.
Moving ahead, investors would await Japan's preliminary 3Q GDP data, set to release overnight.
The currency pair is trading above its 20 Hr and 50 Hr moving averages.

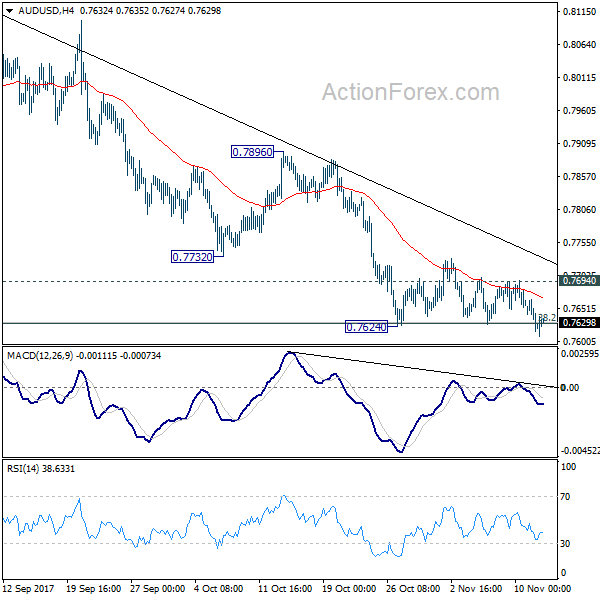
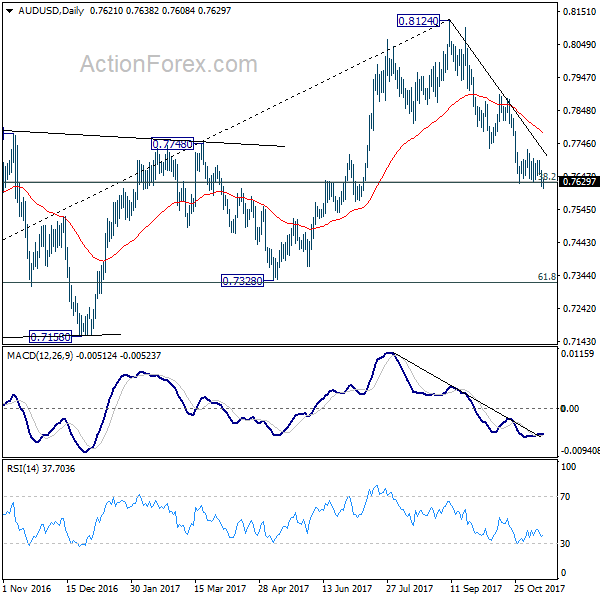
AUD/USD Daily Outlook
Daily Pivots: (S1) 0.7622; (P) 0.7661; (R1) 0.7695; More...
Break of 0.7624 support indicates that larger decline from 0.8124 is resuming. Intraday bias is back on the downside. Deeper fall should be seen to next key cluster level at 0.7322/8. Nonetheless, break of 0.7694 resistance will now indicate short term bottoming and turn bias back to the upside for 0.7896 resistance and possibly above.
In the bigger picture, corrective rise from 0.6826 medium term bottom is likely completed at 0.8124, after hitting 55 month EMA (now at 0.8067). Decisive break of 0.7328 key cluster support (61.8% retracement 0.6826 to 0.8124 at 0.7322) will confirm. And in that case, long term down trend from 1.1079 (2011 high) will likely be resuming. Break of 0.6826 will target 61.8% projection of 1.1079 to 0.6826 from 0.8124 at 0.5496. This will now be the favored case as long as 0.7896 near term resistance holds.
Swiss Franc Trading A Tad Lower This Morning
For the 24 hours to 23:00 GMT, the USD marginally declined against the CHF and closed at 0.9965.
On the economic front, Switzerland’s total sight deposits fell to a level of CHF577.5 billion in the week ended 10 November, compared to a level of CHF577.8 billion reported in the previous week.
In the Asian session, at GMT0400, the pair is trading at 0.9966, with the USD trading slightly higher against the CHF from yesterday’s close.
The pair is expected to find support at 0.9940, and a fall through could take it to the next support level of 0.9913. The pair is expected to find its first resistance at 0.9990, and a rise through could take it to the next resistance level of 1.0013.
Looking ahead, market participants would eye Switzerland’s producer and import prices data for October, slated to release in a few hours.
The currency pair is showing convergence with its 20 Hr moving average and trading above its 50 Hr moving average.

Loonie Trading Slightly Lower In The Morning Session
For the 24 hours to 23:00 GMT, the USD rose 0.36% against the CAD and closed at 1.2737.
In the Asian session, at GMT0400, the pair is trading at 1.2742, with the USD trading marginally higher against the CAD from yesterday’s close.
The pair is expected to find support at 1.2698, and a fall through could take it to the next support level of 1.2654. The pair is expected to find its first resistance at 1.2766, and a rise through could take it to the next resistance level of 1.2790.
Amid a lack of macroeconomic releases in Canada today, investor sentiment would be governed by global macroeconomic events.
The currency pair is trading above its 20 Hr and 50 Hr moving averages.

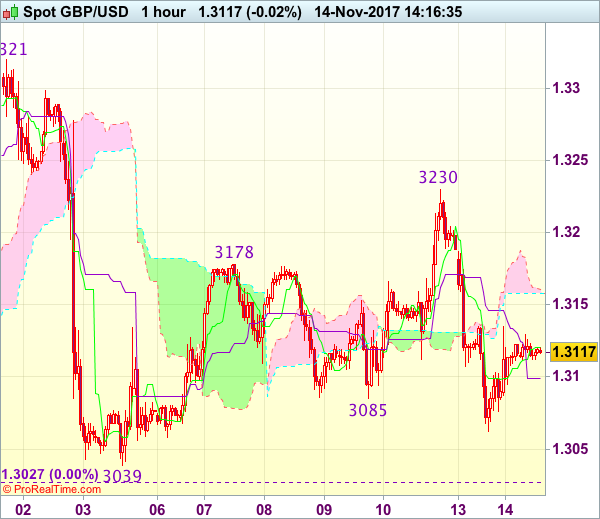
Trade Idea : GBP/USD – Stand aside
GBP/USD - 1.3103
Most recent candlesticks pattern : N/A
Trend : Near term down
Tenkan-Sen level : 1.3113
Kijun-Sen level : 1.3099
Ichimoku cloud top : 1.3158
Ichimoku cloud bottom : 1.3158
New strategy :
Stand aside
Position : -
Target : -
Stop : -
Despite falling to 1.3062 yesterday, lack of follow through selling on break of previous support at 1.3085 and the subsequent recovery suggest consolidation would be seen and bounce to 1.3130-35 cannot be ruled out, however, reckon upside would be limited to 1.3160-70 and bring another decline later, below said support at 1.3062 would revive bearishness for weakness towards support area at 1.3027-39 but break there is needed to confirm decline has resumed for further fall to psychological support at 1.3000.
In view of this, would not chase this fall here and would be prudent to stand aside in the meantime. Above 1.3160-70 would prolong choppy trading and bring recovery to 1.3190-00 but said resistance at 1.3230 would hold from here, bring further consolidation. Only break of said resistance at 1.3230 would extend the erratic rise from 1.3039 to 1.3250, then 1.3275-80.
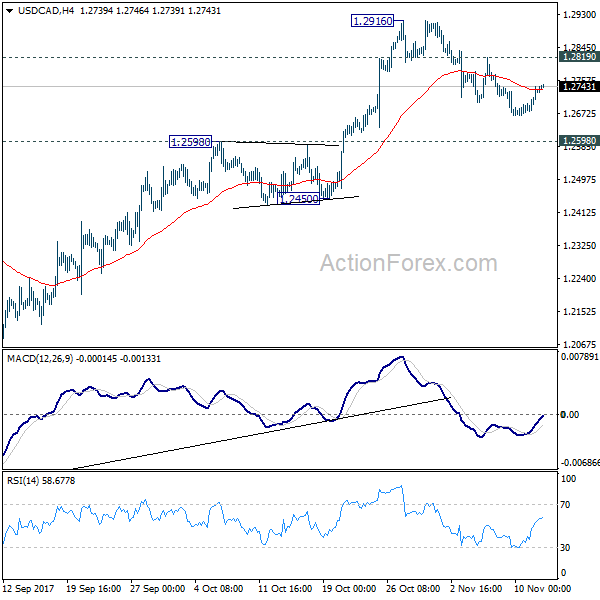
USD/CAD Daily Outlook
Daily Pivots: (S1) 1.2628; (P) 1.2723; (R1) 1.2782; More....
No change in USD/CAD's outlook as correction from 1.2916 is still in progress. Near term outlook will stay bullish as long as 1.2598 resistance turned support holds. On the upside, above 1.2819 minor resistance will turn bias back to the upside for 1.2916 high first. Break there will extend the rise from 1.2061 to 38.2% retracement of 1.4689 to 1.2061 at 1.3065. However, sustained break of 1.2598 will argue that rebound from 1.2061 has completed after hitting 55 week EMA (now at 1.2916). Near term outlook will be turned bearish in this case.
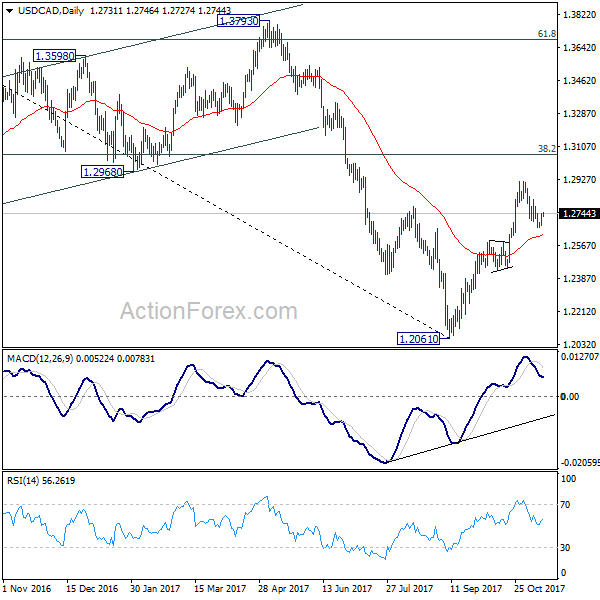
In the bigger picture, USD/CAD should have defended 50% retracement of 0.9406 (2011 low) to 1.4689 (2016 high) at 1.2048. And with 1.2048 intact, we'd favor the case that fall from 1.4689 is a correction. Rise from 1.2061 medium term bottom should now target 38.2% retracement of 1.4689 to 1.2061 at 1.3065. Firm break there will target 1.3793 key resistance next (61.8% retracement at 1.3685). We'll now hold on to this bullish view as long as 1.2450 support holds.
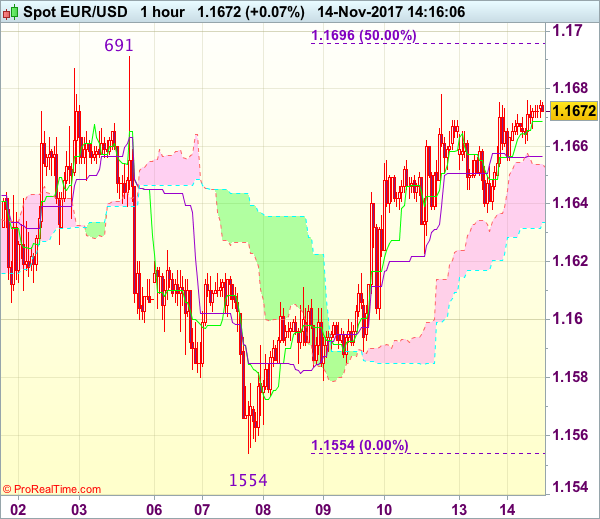
Trade Idea : EUR/USD – Buy at 1.1625
EUR/USD - 1.1669
Most recent candlesticks pattern : N/A
Trend : Down
Tenkan-Sen level : 1.1669
Kijun-Sen level : 1.1657
Ichimoku cloud top : 1.1654
Ichimoku cloud bottom : 1.1634
Original strategy :
Buy at 1.1625, Target: 1.1725, Stop: 1.1590
Position : -
Target : -
Stop : -
New strategy :
Buy at 1.1625, Target: 1.1725, Stop: 1.1590
Position : -
Target : -
Stop : -
As the single currency has maintained a firm undertone after surging to 1.1678, suggesting the rise from 1.1554 low is still in progress and may extend further gain to 1.1691-96 (previous resistance and 50% Fibonacci retracement of 1.1837-1.1554) but reckon upside would be limited to 1.1725-29 (previous support now resistance and 61.8% Fibonacci retracement), bring retreat later.
In view of this, would not chase this rise here and we are looking to buy euro on pullback as 1.1620-25 should limit downside and bring another rebound later. Below 1.1600 would bring weakness to 1.1675-80, however, downside should be limited and bring another rebound. Break of 1.1575-80 would defer and risk a retest of last week’s low at 1.1554 first.
Daily Wave Analysis: GBP/USD Bearish Breakout Faces Bullish ABC Zigzag
Currency pair GBP/USD
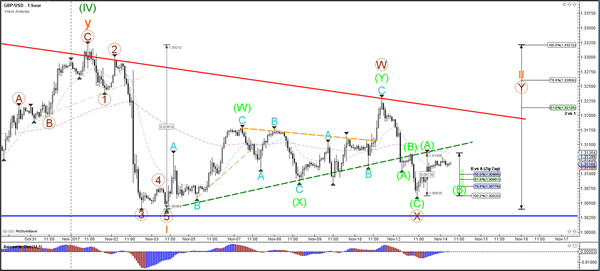
The GBP/USD broke above and below the local triangle pattern (dotted lines) but the major support (blue) and resistance (red) trend lines are still intact. A breakout is needed before a larger directional move can be expected.
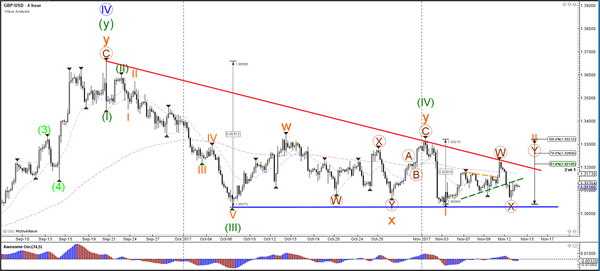
The GBP/USD is probably expanding the correction via an ABC zigzag correction (green) if price stays in between support and resistance trend lines. A break below the 100% Fibonacci level of wave B vs A invalidates the bullish ABC wave.
Currency pair EUR/USD
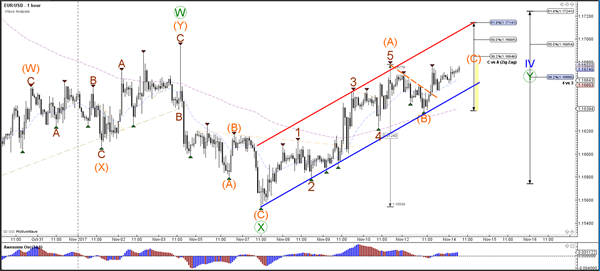
EUR/USD is expanding the wave 4 (blue) bullish retracement within the larger downtrend (red line).The Fibonacci levels of wave 4 (blue) could therefore act as a resistance zone. A break below the support trend line (blue) could indicate a potential bearish breakout within wave 5 (blue) of wave C (purple).
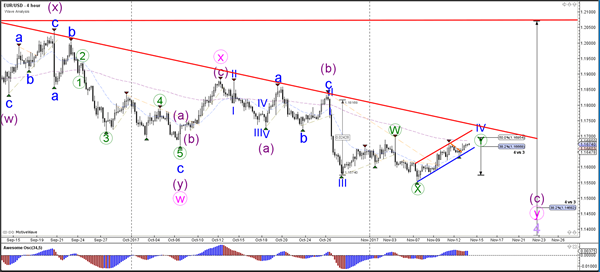
The EUR/USD could be building an ABC (orange) zigzag correction within wave 4 (blue) after itbroke above the local resistance trend line (dotted orange).
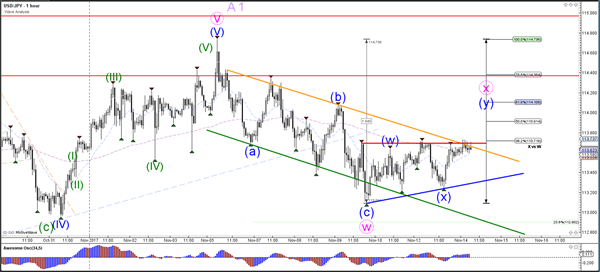
Currency pair USD/JPY
The USD/JPYis still in its choppy bearish trend channel. A bullish breakout could test the resistance levels of wave X (pink). A bearish breakout could test the Fibonacci levels of wave 2 or wave B (light purple).
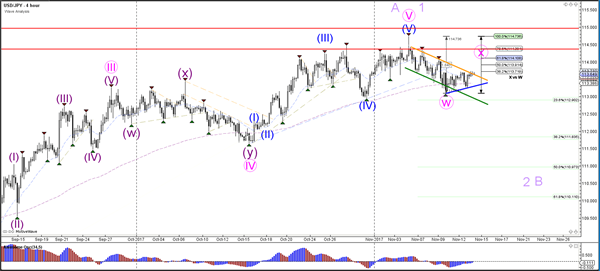
The USD/JPY is testingthe resistance of the bearish channel (orange line) and previous tops (red line).
Elliott Wave View: CADJPY
CADJPY Elliott Wave view suggests that the decline to 87.78 ended Minor wave X. Pair starts a new rally from there as a double three Elliott Wave structure where Minute wave ((w)) ended at 89.8. Minute wave ((x)) pullback is currently in progress to correct cycle from 10/31 low in 3, 7, or 11 swing before the rally resumes, provided that pivot at 10/31 low (87.78) stays intact. Subdivision of Minute wave ((x)) is unfolding also as a double three Elliott Wave structure where Minutte wave (w) ended at 88.96 and Minutte wave (x) ended at 89.64. Near term, while bounces stay below 89.8, expect pair to extend lower in Minutte wave (y) of ((x)) towards 88.56 – 88.76 area before pair resumes the rally higher or at least bounce in 3 waves. We don’t like selling the pair.
CADJPY 1 Hour Elliott Wave Analysis