
Sample Category Title
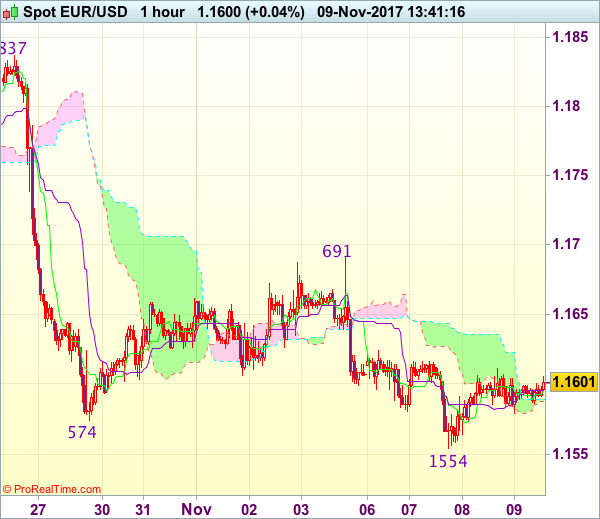
Trade Idea : EUR/USD – Hold short entered at 1.1620
EUR/USD - 1.1602
Most recent candlesticks pattern : N/A
Trend : Down
Tenkan-Sen level : 1.1595
Kijun-Sen level : 1.1595
Ichimoku cloud top : 1.1589
Ichimoku cloud bottom : 1.1587
Original strategy :
Sold at 1.1620, Target: 1.1520, Stop: 1.1620
Position : - Short at 1.1620
Target : - 1.1520
Stop : - 1.1620
New strategy :
Hold short entered at 1.1620, Target: 1.1520, Stop: 1.1620
Position : - Short at 1.1620
Target : - 1.1520
Stop : - 1.1620
Euro’s rebound after finding support at 1.1554 earlier this week suggests consolidation above this level would be seen, however, still reckon upside would be limited and as long as 1.1615-20 holds, bearishness remains for another decline, below said support at 1.1554 would extend recent fall to 1.1520-25, then 1.1500 but near term oversold condition should prevent sharp fall below latter level.
In view of this, we are holding on to our short position entered at 1.1620. Above 1.1620-25 would defer and risk test of 1.1640-50 would risk another bounce towards 1.1691, however, only break there would abort and suggest low has been formed, bring retracement of recent decline to previous support at 1.1725 (now resistance).
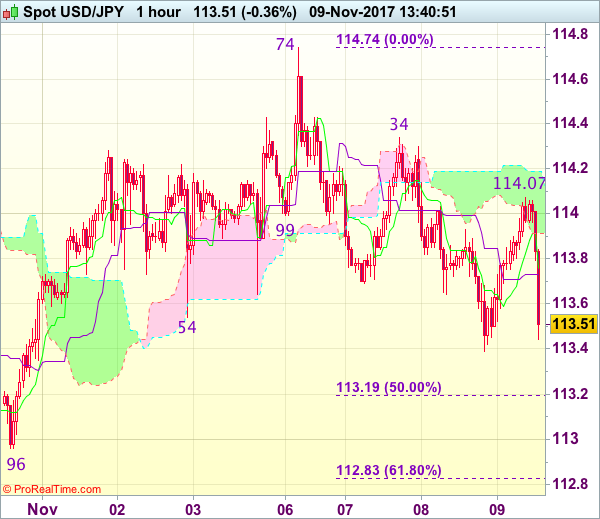
Trade Idea : USD/JPY – Hold short entered at 114.00
USD/JPY - 113.57
Most recent candlesticks pattern : N/A
Trend : Near term up
Tenkan-Sen level : 113.76
Kijun-Sen level : 113.73
Ichimoku cloud top : 114.19
Ichimoku cloud bottom : 113.91
Original strategy :
Sold at 114.00, Target: 113.00, Stop: 114.35
Position : - Short at 114.00
Target : - 113.00
Stop : - 114.35
New strategy :
Hold short entered at 114.00, Target: 113.00, Stop: 114.00
Position : - Short at 114.00
Target : - 113.00
Stop : - 114.00
As the greenback has retreated after meeting renewed selling interest at 114.07 (we recommended to sell at 114.00 and a short position was entered), retaining our bearishness for the fall from 114.74 top to extend weakness to 113.15-20 (50% Fibonacci retracement of 111.65-114.74), then test of previous support at 112.96, however, break of latter level is needed to add credence to this view, bring further subsequent selloff to 112.60 but support at 112.30 should hold from here due to near term oversold condition.
In view of this, we are holding on to our short position entered at 114.00. Only above resistance at 114.34 would abort and signal the retreat from 114.74 has ended instead, bring retest of this level first, above there would revive bullishness and extend recent rise from 107.32 to 115.00.
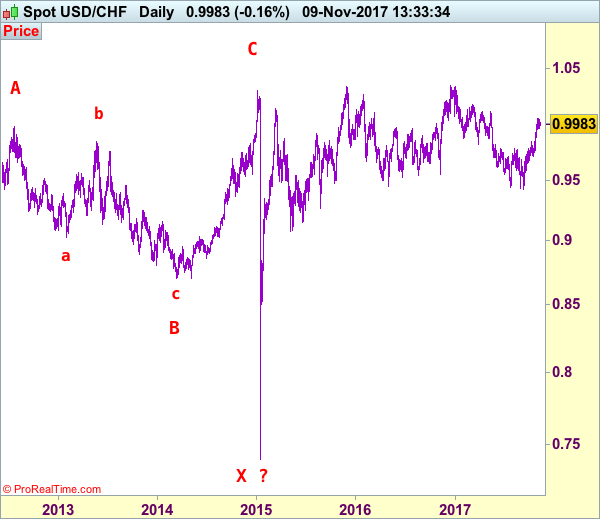
USD/CHF Elliott Wave Analysis
USD/CHF – 0.9986
The greenback traded narrowly after meeting resistance at 1.0139 late last month, suggesting minor consolidation would be seen and although pullback to 0.9940-50 cannot be ruled out, reckon downside would be limited to 0.9900 and renewed buying interest should emerge around 0.9865-70, bring another rise later, above said resistance at 1.0039 would add credence to our view that low has been formed at 0.9421 and the upmove from there may extend further gain towards previous resistance at 1.0100, however, overbought condition should prevent sharp move beyond 1.0150 and reckon 1.0200-10, risk from there is seen for a retreat to take place later.
Our preferred count on the daily chart is that early selloff to 0.9630 is an end of the larger degree wave III and major correction is unfolding from there with a leg ended at 1.2298 (Nov 2008 with (a): 1.0625, (b):1.0011 and (c):1.2298), wave b ended at 0.9910 with (a): 1.0370, (b): 1.1967, (c): 0.9910. The rise from there to 1.1730 is the wave c which also marked the end of wave IV and wave V has possibly ended at 0.7068.
On the downside, whilst initial pullback to 0.9940-50 cannot be ruled out, reckon renewed buying interest would emerge above 0.9865-70 and bring another rise later. Below previous resistance at 0.9837 (now support) would defer and risk correction to 0.9795-00 but downside should be limited to 0.9755-60 and support at 0.9737 should remain intact, bring another rise. Only a drop below 0.9737 would signal top is formed instead, bring test of key support at 0.9705 which is likely to hold from here.
Recommendation: Buy at 0.9875 for 1.0075 with stop below 0.9775.
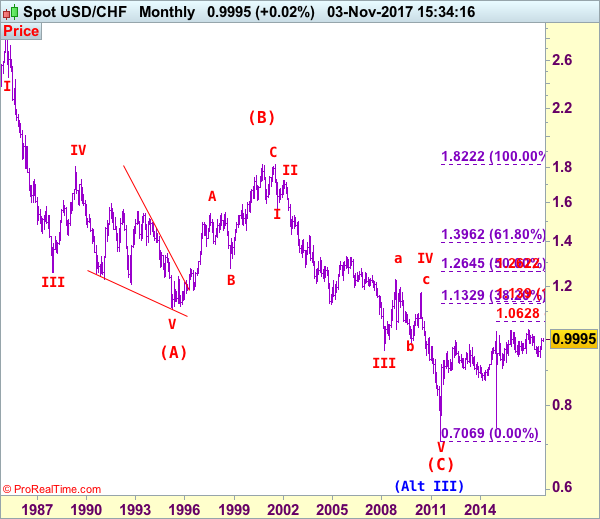
Dollar's long-term downtrend started from 2.9343 (Feb 1995) and it was unfolding as a (A)-(B)-(C) with (A): 1.1100, (B): 1.8310 (26 Oct 2000), then followed by another impulsive wave (C) with wave III ended at 0.9630 (Mar 2008). Under this count, correction in wave IV has possibly ended at 1.1730 and wave V already broke below support at 0.9630 and met indicated downside target at 0.7500 and 0.7400. The reversal from 0.7068 suggests the wave V has possibly ended and the breach of resistance at 0.9595 add credence to this view and indicated upside target at 1.0000 had been met, however, the sharp retreat from 1.0296 to 0.7401 suggests choppy trading would be seen but price should stay above said record low at 0.7068.
GBP/USD Candlesticks and Ichimoku Analysis
Weekly
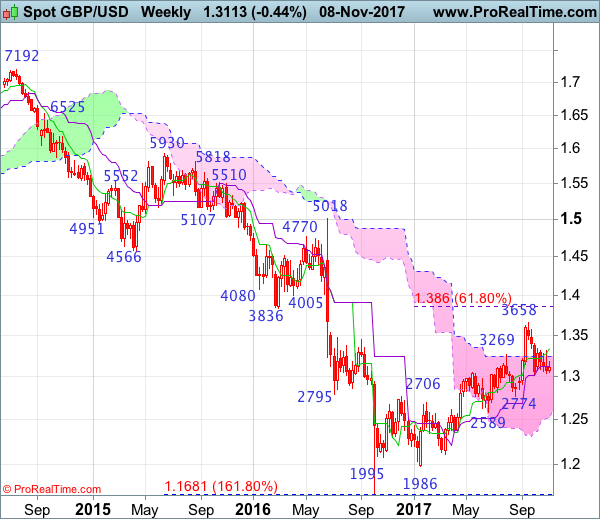
• Last Candlesticks pattern: Shooting star
• Time of formation: 31 Jul 2017
• Trend bias: Down
Daily
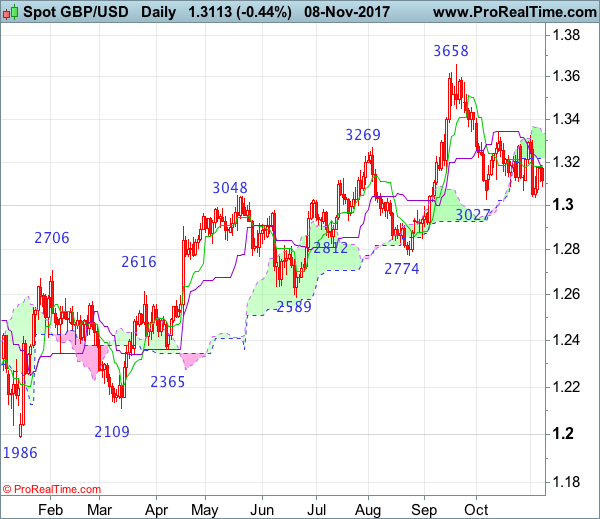
• Last Candlesticks pattern: Morning star
• Time of formation: 25 Aug 2017
• Trend bias: Near term up
GBP/USD – 1.3121
Despite falling to 1.3039 late last week, as the British pound recovered after holding above previous support at 1.3027, suggesting recent fall from 1.3658 top is not ready to resume yet and further consolidation above said support level is in store, hence another bounce to 1.3178 cannot be ruled out, however, as outlook remains consolidative, reckon upside would be limited to 1.3295-00 and price should falter below indicated previous resistance at 1.3338, bring another decline later. A break of 1.3027-39 support area would confirm the fall from 1.3658 has resumed for further weakness to 1.3000, then towards 1.2940-50 later but minor support at 1.2852 would contain downside.
On the upside, although initial recovery to 1.3175-80 cannot be ruled out, reckon upside would be limited to 1.3240-50 and resistance at 1.3299 should hold, bring another decline later. A break of indicated previous resistance at 1.3338 would shift risk to the upside and signal another leg of rebound from 1.3027 is underway for gain to 1.3400, then test of previous resistance at 1.3455 which is likely to hold on first testing.
Recommendation: Stand aside for this week.
On the weekly chart, sterling’s retreat after faltering below previous resistance at 1.3338 formed a black candlestick with a long upper shadow, hence consolidation with mild downside bias is seen for another test of support area at 1.3027-39, however, a drop below there is needed to retain bearishness and signal a temporary top has been formed at 1.3658 earlier, bring retracement of recent rise to 1.3000, then towards support at 1.2909 but anticipated near term oversold condition should prevent sharp fall below previous chart support at 1.2774 and price should stay well above another previous chart support at 1.2589, bring rebound later.
On the upside, whilst initial recovery to 1.3175-80 cannot be ruled out, reckon upside would be limited to 1.3295-00 and price should falter below resistance at 1.3338, bring another decline later. A break above 1.3338 would suggest the retreat from 1.3658 has ended instead, bring a stronger rebound to 1.3400-05 and possibly towards 1.3490-00 but price should falter well below said resistance at 1.3658. In the event sterling breaks above 1.3571 resistance, this would bring a retest of this last month’s high at 1.3658, break there would extend recent erratic rise from 1.1986 low to 1.3750-60 and 1.3800 but overbought condition should prevent sharp move beyond 1.3860 (61.8% Fibonacci retracement of 1.5018-1.1986).
Elliott Wave View: FTSE Intra-Day
Short term FTSE Elliott Wave view shows Primary wave ((4)) ended with the decline to 7199.5. The rally from there is unfolding as a zigzag Elliott Wave structure where Intermediate wave (A) ended at 7565.11 and Intermediate wave (B) ended at 7437.42. Intermediate wave (A) has an internal subdivision of an impulse Elliott Wave structure. Minor wave 1 ended at 7327.5, pullback to 7289.75 ended Minor wave 2, Minor wave 3 ended at 7527.72, pullback to 7493.68 ended Minor wave 4, and Minor wave 5 of (A) ended at 7565.11.
Intermediate wave (B) pullback ended at 7437.42 with internal subdivision of a double three Elliott Wave structure. Minor wave W ended at 7485.42, Minor wave X ended at 7560.04, and Minor wave Y of (B) ended at 7437.42. Intermediate wave (C) is currently in progress as 5 waves where Minor wave 1 ended at 7582.85. Minor wave 2 pullback is is proposed complete at 7504.77. Index has since rallied again and anyone who bought at the blue box should be risk free already. As far as the dips stays above 7504.77, but more importantly above 10/25 low (7437.41), expect the Index to extend higher. We don’t like selling the Index.
FTSE 1 Hour Elliott Wave Analysis
RBNZ Upgraded Inflation Forecasts, Ambivalent About New Government Policies
While keeping the OCR unchanged at 1.75%, the tone of November RBNZ statement has turned slightly more hawkish than previous ones. The central bank upgraded inflation forecasts, while describing core inflation as 'subdued' and reiterating 'uncertainties' in the new government's policies. The growth outlook remained largely unchanged from August's, as weaker growth in the housing and construction sector would be offset by greater fiscal spending promised by the new government and higher terms of trade, thanks to NZD depreciation and the rise in oil prices. RBNZ slightly pushed ahead the rate hike schedule. However, given the minimal change, we believe this is rather a symbolic move. The central bank expects more material interest rate movements by 2020. We believe the monetary policy would stay unchanged for the rest of 2018.
Macroeconomic Outlook
The tweaks in the accompanying statement evidenced the growing optimism in the economic outlook. As noted in the statement, 'employment growth has been strong and GDP growth is projected to strengthen, with a weaker outlook for housing and construction offset by accommodative monetary policy, the continued high terms of trade, and increased fiscal stimulus'. This was compared with August's statement that 'while exports recovered, construction was weaker than expected' and 'growth is projected to maintain its current pace going forward', supported by 'accommodative monetary policy, population growth, elevated terms of trade, and fiscal stimulus'. In the November statement, RBNZ indicated that strong growth is evidence of strong economic developments while GDP growth should strengthen further. The central bank this month included terms of trade as a factor supporting growth.
RBNZ elaborated its view over the weakness in housing market, adding 'reduced foreign demand' to the number of reasons causing moderation in housing market prices. It added that low house price inflation would continue as 'reinforced by new government policies on housing. The central bank this month appeared to have shrugged off the risk 'of resurgence in prices given population growth and resource constraints in the construction sector'.
The tone on inflation apparently turned more hawkish. While acknowledging 'subdued 'core inflation and 'moderate' non-tradables inflation, the central bank forecast the latter would 'increase gradually as capacity pressures increase'. It also noted that 'tradables inflation has increased due to the lower New Zealand dollar and higher oil prices'. It forecast inflation 'to remain near the midpoint of the target range and longer-term inflation expectations are well anchored at +2%'. In August, the statement suggested that headline inflation would approach 'the midpoint of the target range over the medium term' while 'longer-term inflation expectations remain well anchored at around +2%'. RBNZ has pushed forward the timeline of achieving the +2% inflation target by nine months.
New Government
The November statement talked about the new government, suggesting that the central bank's estimates have incorporated the impact of new government policies in new government spending, KiwiBuild programme, tighter visa requirements and increases in the minimum wage. RBNZ added that the impact of these policies is 'very uncertain'. Interestingly, Acting governor Grant Spencer appeared very optimistic over these policies, expecting them to add about +50 bps to GDP growth in the RBNZ's assessment.
NZD
The central bank appeared less concerned about the exchange. It noted that kiwi 'has eased since the August Statement and, if sustained, will increase tradables inflation and promote more balanced growth'. Indeed, NZDUSD has fallen around -5% since the August meeting, mainly due to the election uncertainties and the final outcome.
OCR Change
The language on the monetary policy was exactly the same as the August one. However, we notice modest upticks in the rate hike forecasts for June and September 2019, by +0.1 percentage point to 2.1% and +2.2% respectively. While the increase was very mild, this shows that RBNZ has turned more upbeat about the economic outlook.
(RBNZ) Official Cash Rate Unchanged at 1.75 percent
Statement by Reserve Bank Governor Grant Spencer:
The Reserve Bank today left the Official Cash Rate (OCR) unchanged at 1.75 percent.
Global economic growth continues to improve, although inflation and wage outcomes remain subdued. Commodity prices are relatively stable. Bond yields and credit spreads remain low and equity prices are near record levels. Monetary policy remains easy in the advanced economies but is gradually becoming less stimulatory.
The exchange rate has eased since the August Statement and, if sustained, will increase tradables inflation and promote more balanced growth.
GDP in the June quarter grew broadly in line with expectations, following relative weakness in the previous two quarters. Employment growth has been strong and GDP growth is projected to strengthen, with a weaker outlook for housing and construction offset by accommodative monetary policy, the continued high terms of trade, and increased fiscal stimulus.
The Bank has incorporated preliminary estimates of the impact of new government policies in four areas: new government spending; the KiwiBuild programme; tighter visa requirements; and increases in the minimum wage. The impact of these policies remains very uncertain.
House price inflation has moderated due to loan-to-value ratio restrictions, affordability constraints, reduced foreign demand, and a tightening in credit conditions. Low house price inflation is expected to continue, reinforced by new government policies on housing.
Annual CPI inflation was 1.9 percent in September although underlying inflation remains subdued. Non-tradables inflation is moderate but expected to increase gradually as capacity pressures increase. Tradables inflation has increased due to the lower New Zealand dollar and higher oil prices, but is expected to soften in line with projected low global inflation. Overall, CPI inflation is projected to remain near the midpoint of the target range and longer-term inflation expectations are well anchored at 2 percent.
Monetary policy will remain accommodative for a considerable period. Numerous uncertainties remain and policy may need to adjust accordingly.
It’s Blustery But Going Nowhere
It's blustery out here as the markets get caught up in a vortex of political discourse, and like a deer in the headlight, traders have no idea which way to turn. Expect price action to remain fickle at best as Treasury prices have barely moved, with the curve consolidating at the flattest levels in a decade
Republican leaders looking to revamp the tax code are now faced with a gap of at least a $74 billion shortfall in the House's plan. And with the GOP lambasting in Tuesday's state and local elections, House lawmakers may be viewing this as the sign of things to come, and likely making it more troublesome to advance the Trump administrations agenda. Entirely nothing will go quickly to this current administration.
Frankly, the markets are struggling to find a reliable argument to stick to, and muddling through political bluster is more of a distraction than a guide
Geopolitical developments in the Middle East should continue to push oil prices higher. This, despite a profit-taking induced drop after the EIA reported that U.S. crude oil inventories went up, by 2.2 million barrels, contradicting the API estimates of a 1.562-million-barrel draw. The rise in oil prices increases the risk of unfastening expectations for assiduously -low inflation.
And while its still early day's in the oil patch rally but with the Middle Eastern version of the Game of Thrones unfolding, all its squabbles in infighting should underpin oil prices which could send tremors across fixed income markets
New Zealand Dollar
The RBNZ delivered a remarkably upbeat economic assessment but more significantly for currency traders is that RBNZ Spencer said the currency was in the vicinity of fair value by far the most hawkish language the bank has used in recent times.
The NZDUSD is trading +45 pips, but the markets favoured way to express the NZD hawkishness is through AUDNZD which is trading off about -75 pips.
The Australian Dollar
The AUDUSD short trade continues to struggle below .7640 as harmful political noise around US tax reform and rebounding iron ore prices, despite the sharp decline in China imports, underpin AUDUSD. And while RBA offered the market little reason to buy Aussie dollar, but given its stickiness versus the USD, I suspect a clean break below .7620 is needed to get the more aggressive bears excited.
The Japanese Yen
The JPY continues to oscillate between tax reform headlines. Tax headlines and equity market pessimism/optimism will be the main the drivers in the absence of any of any significant data releases. Dips to 113, given the interest rate divergence narrative, will be supported until the absolute bottom falls out of the tax reform proceedings.
Malaysian Ringgit
Bank Negara Malaysia will probably keep the overnight policy rate unchanged at 3 percent. And while the pace of economic activity in Malaysia could support an interest rate hike to ward of inflationary pressure which climbed above the BNM target band in Septemeber, given the proximity of elections, its unlikely to occur.
The Ringitt continues to trade quietly this week as risk appeal is waning given the uncertainty over US Tax Reform.
USD/CAD Canadian Dollar Higher On Strong Housing Starts And US Tax Reform Concerns
The Canadian dollar rose on Wednesday with positive housing data and us crude prices steady above $56. The trading week has brought little data so investors were happy to digest some positive news out of Canada. Housing starts rose to 222,771 on an annual bases in October. Building permits also rose by 3.8 percent in September. Condos are the main drivers of that growth that took forecasters by surprise given the slowdown in Canadian real estate after the changes to mortgage rules and foreign investment.
While most media has been busy covering NAFTA, the other trade agreement under review by Canada, the Trans Pacific Partnership (TPP) was having a moment as the 11 remaining members met in Vietnam. US President Trump took the States out of the agreement early in his presidency and Japan has assumed the leadership role seeking a commitment from members. Canada and Mexico will be looking at the TPP as an alternative if NAFTA trade talks go badly, but will not commit this early without knowing the fate of the trade deal with the United States.
The price of oil is struggling to remain bullish with a surprise buildup in US weekly inventories. The Organization of the Petroleum Exporting Countries (OPEC) production cut agreement with other major producers has been offset by higher levels of drilling by US shale producers. OPEC expects shale numbers to go higher, but be offset by higher demand.
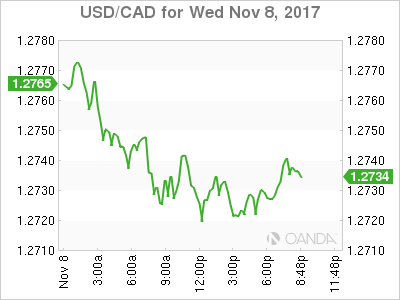
The USD/CAD lost 0.42 percent on Wednesday. The currency pair is trading at 1.2723 as the US tax reform’s path to becoming legislation is getting trickier. The backlash against the Republican establishment has started as the elections in Virginia went to the Democrats looking ahead to a very important primaries in 2018.
US President Trump is off in Asia, but there is plenty of activity in Congress. After failing to pass a new healthcare act, President Trump has his sights set on tax reform, a key item in his domestic platform. Trump wants Congress to pass legislation overhauling the tax code before the end of the year, but that could prove to be too tight of a deadline. Most Democrats have come out against the proposal, and not all Republicans are on board. The bill would cut corporate taxes from 35% to 20%, but predictably, Democrat and Republican lawmakers are at odds as to whether the bill will lower taxes for the middle class. The bill is presently being debated in a congressional committee and is expected to move to the House floor next week. The Senate will present its version of the bill on Thursday, so we can expect plenty of activity in Congress in the next few weeks. Expectations that Trump will cut taxes has been the catalyst for a stock market rally over the past year, and if the bill does become law, the US dollar will likely gain ground.
The loonie advanced on US dollar struggles taking advantage of a higher price of oil after the events in Saudi Arabia over the weekend and the positive housing data released earlier today. The comments from Bank of Canada (BoC) Governor Stephen Poloz were neutral at best with inflation his main concern. Rate divergence with the US will remain if the U.S. Federal Reserve hikes a third time in December, but if inflation rises the BoC might have to match that move sooner rather than later, not allowing the gap to grow wider.
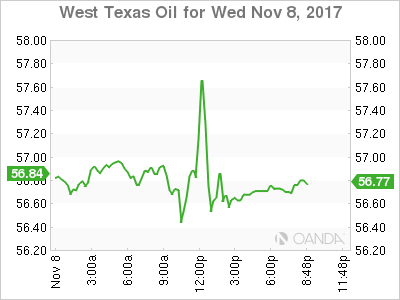
The price of oil dropped slightly on Wednesday. West Texas Intermediate is trading at $56.67 after the Energy Information Administration (EIA) released a surprise buildup in the weekly inventories. US crude stocks rose by 2.2 million barrels confounding forecasts of a 2.7 million drawdown.
The events over the weekend in Saudi Arabia triggered a rise in energy prices. Investors had already started getting out of long positions on Tuesday and the buildup in weekly inventories gave more strength to that move.
The arrests of prominent Saudi politicians and businessmen comes at a time when the kingdom is opening too many fronts. The embargo against Qatar, the military offensive in Yemen and the diplomatic/ideological fight with Iran have crown prince Mohammed Bin Salman in common as he is pushing for reform at home and abroad.
The Organization of the Petroleum Exporting Countries (OPEC) released its 2017 World Oil Outlook today and the group is forecasting a rise in shale production and growing demand in the following two years. OPEC and other major producers agreed to cut production to rebalance the energy markets after heavy falls and are now looking at extending for a second time the length of the agreement.
Market events to watch this week:
Thursday, November 9
9:30 am USD Unemployment Claims
8:30 pm AUD RBA Monetary Policy Statement
Friday, November 10
5:30am GBP Manufacturing Production m/m
Gold Recovers On Uncertainty Over Trump Tax Plan
Gold has posted strong gains in the Wednesday session, erasing the losses from Tuesday. In North American trade, the spot price for an ounce of gold is $1285.57, up 0.83% on the day. On the release front, there are no key events on the schedule. On Thursday, the US releases unemployment claims.
After failing to pass a new healthcare act, President Trump has his sights set on tax reform, a key item in his domestic platform. Trump wants Congress to pass legislation overhauling the tax code before the end of the year, but that could prove to be too tight of a deadline. Most Democrats have come out against the proposal, and not all Republicans are on board. The bill would cut corporate taxes from 35% to 20%, but predictably, Democrat and Republican lawmakers are at odds as to whether the bill will lower taxes for the middle class. The bill is presently being debated in a congressional committee and is expected to move to the House floor next week. The Senate will present its version of the bill on Thursday, so we can expect plenty of activity in Congress in the next few weeks. Tax reform faces an uphill battle, which has weighed on investor risk appetite and pushed gold prices higher.
The labor market remains very strong, and this was reflected in another sharp employment report on Tuesday. JOLT Jobs Openings was almost unchanged at 6.09 million, easily beating the forecast of 5.98 million. Unemployment claims are also expected to show little movement on Thursday, with a forecast of 232 thousand. The unemployment rate is at a sizzling 4.1%, but wage growth remains a concern, reflective of weak inflation. In October, Average Hourly Earnings posted a flat 0.0.%, the first time wages have not increased since November 2016.