Sample Category Title
Canada: Housing Starts Rise in October
Canadian housing starts rose to 223k units in October (on a seasonally adjusted annualized basis), up from 219k units in September. The 6-month moving average increased to 217k (previously 215k).
The increase was concentrated in the multi-unit segment, with starts up 12.5% month-on-month, following a decrease during the month prior. Meanwhile, single-family starts fell by 17% in October.
Ontario (-18k) continued to be a weak spot, with homebuilding activity declining sharply for a second consecutive month. Starts in Ontario are now down nearly 40% from August's robust level. On the flipside, B.C. (+16k) and Quebec (+8k) recorded solid increases in new home construction.
Housing starts in Toronto (-7k) also declined for a second straight month while starts in Vancouver nearly doubled, reaching a 12-month high. The gains in Vancouver were driven by the multi-unit segment.
Key Implications
Ontario might be a weak spot, but healthy activity elsewhere helped starts pick up in October. And, with the 6-month moving average holding well-above the 200k mark, activity remains at quite healthy levels.
Going forward, the impact of recent interest rate hikes - plus a strong possibility of another early next year - combined with the recently announced B20 regulations which could also weigh on demand, will likely lead to further declines in new home construction in the coming quarters. Indeed, we expect starts to gradually trend down toward the 190k mark over the next year, roughly consistent with demographic demand.
CAC Edges Lower, French Trade Deficit Matches Forecast
The CAC index has posted slight losses in the Wednesday session. Currently, the CAC is trading at 5,503.80, down 0.17% on the day. On the release front, there are no major events in the eurozone. France posted a trade deficit of EUR 4.7 billion, which matched the estimate.
In the eurozone, retail sales reports were mixed on Tuesday. Retail PMI came in at 51.1 in October, pointing to muted expansion in the retail sector. There was much better news from September retail sales, as gain of 0.7% came after two straight declines, and was the strongest gain since February. The markets are hoping for strong euorozone consumer spending in the fourth quarter, given the robust German economy and stronger economic conditions in the eurozone.
It's been a banner year for global stock markets, thanks in large part to Donald Trump. Expectations that Trump will cut taxes has improved risk appetite and sent share prices higher. Investors are keeping a close eye on Trump's determined push for tax reform. Trump wants Congress to pass legislation overhauling the tax code before the end of the year, in what is a very tight deadline. Most Democrats have come out against the proposal, and not all Republicans are on board. The bill is presently being debated in a congressional committee and is expected to move to the House floor next week. The Senate will present its version of the bill on Thursday, so we can expect plenty of activity in Congress in the next few weeks. If the Republicans can pass the bill through Congress, the CAC rally should continue. The index has looked sharp, jumping 6.9 percent since September 1.
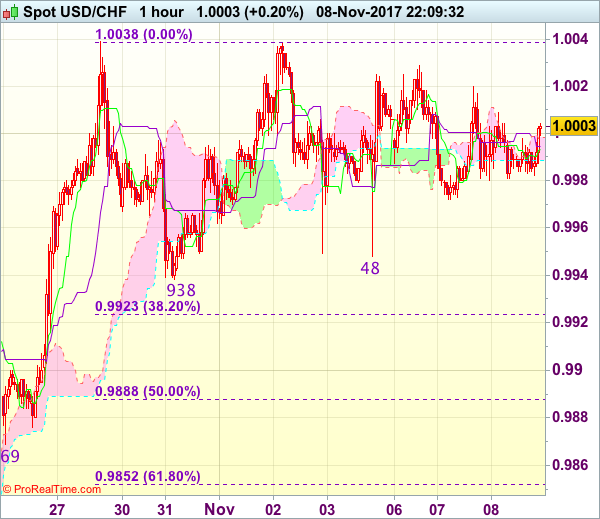
Trade Idea Wrap-up: USD/CHF – Hold long entered at 0.9950
USD/CHF - 0.9999
Most recent candlesticks pattern : N/A
Trend : Up
Tenkan-Sen level : 1.0001
Kijun-Sen level : 0.9996
Ichimoku cloud top : 1.0003
Ichimoku cloud bottom : 0.9989
Original strategy :
Bought at 0.9950, Target: 1.0050, Stop: 0.9970
Position : - Long at 0.9950
Target : - 1.0050
Stop : - 0.9970
New strategy :
Hold long entered at 0.9950, Target: 1.0050, Stop: 0.9970
Position : - Long at 0.9950
Target : - 1.0050
Stop : - 0.9970
Although the greenback met resistance at 1.0020 yesterday and retreated again, still reckon downside would be limited to 0.9970-75 and bullishness remains for recent rise to resume after consolidation, above said resistance at 1.0029 would bring retest of 1.0038, break there would confirm the rise from 0.9421 low has resumed and extend further gain to 1.0050-55, then towards 1.0075-80 but price should falter below 1.0100 chart resistance.
In view of this, we are holding on to our long position entered at 0.9950. Only below said support at 0.9938-48 would abort and signal top is formed instead, risk correction to 0.9920-23 (38.2% Fibonacci retracement of 0.9737-1.0038) but 0.9885-90 (50% Fibonacci retracement) should limit downside and support at 0.9869 would remain intact.
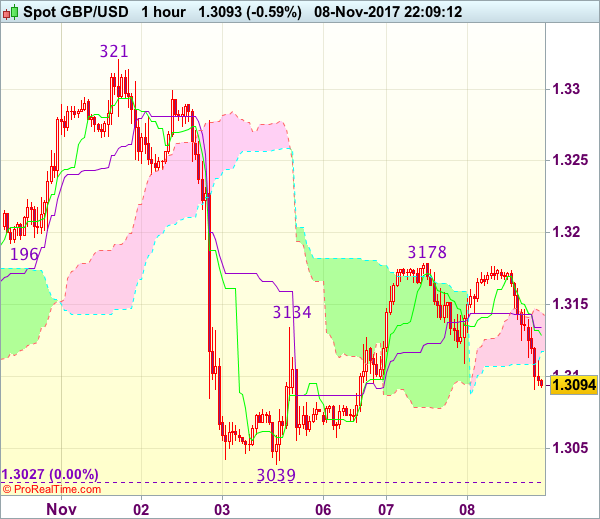
Trade Idea Wrap-up: GBP/USD – Hold short entered at 1.3175
GBP/USD - 1.3100
Most recent candlesticks pattern : N/A
Trend : Near term down
Tenkan-Sen level : 1.3127
Kijun-Sen level : 1.3133
Ichimoku cloud top : 1.3144
Ichimoku cloud bottom : 1.3117
Original strategy :
Sold at 1.3175, Target: 1.3045, Stop: 1.3180
Position : - Short at 1.3175
Target : - 1.3045
Stop : - 1.3180
New strategy :
Hold short entered at 1.3175, Target: 1.3065, Stop: 1.3180
Position : - Short at 1.3175
Target : - 1.3065
Stop : - 1.3180
The British pound has dropped again after faltering below indicated resistance at 1.3178, retaining our bearishness and consolidation with downside bias remains for weakness towards 1.3055-60, however, break there is needed to signal the rebound from 1.3039 has ended at 1.3178, bring retest of this support. Looking ahead, only a drop below 1.3027 low would confirm early downtrend has resumed for weakness to psychological support at 1.3000, then towards 1.2970-75.
In view of this, we are holding on to our short position entered at 1.3175. Above 1.3175-80 would risk gain to 1.3200, break there would defer and prolong choppy trading, risk a stronger rebound to 1.3235-40 first.
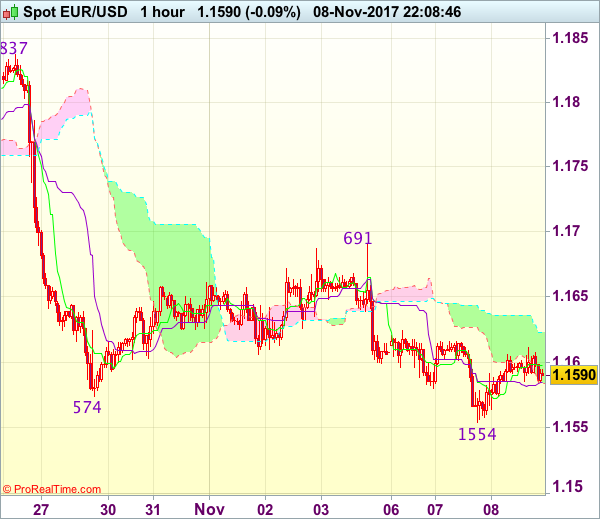
Trade Idea Wrap-up: EUR/USD – Hold short entered at 1.1620
EUR/USD - 1.1592
Most recent candlesticks pattern : N/A
Trend : Down
Tenkan-Sen level : 1.1596
Kijun-Sen level : 1.1583
Ichimoku cloud top : 1.1636
Ichimoku cloud bottom : 1.1604
Original strategy :
Sold at 1.1620, Target: 1.1520, Stop: 1.1620
Position : - Short at 1.1620
Target : - 1.1520
Stop : - 1.1620
New strategy :
Hold short entered at 1.1620, Target: 1.1520, Stop: 1.1620
Position : - Short at 1.1620
Target : - 1.1520
Stop : - 1.1620
Although the single currency fell to as low as 1.1554 yesterday, the subsequent rebound suggests consolidation above this level would b seen, however, reckon upside would be limited and as long as 1.1615-20 holds, bearishness remains for another decline, below said support at 1.1554 would extend recent fall to 1.1520-25, then 1.1500 but near term oversold condition should prevent sharp fall below latter level.
In view of this, we are holding on to our short position entered at 1.1620. Above 1.1620-25 would defer and risk test of the upper Kumo (now at 1.1636) would risk another bounce towards 1.1691, however, only break there would abort and suggest low has been formed, bring retracement of recent decline to previous support at 1.1725 (now resistance).
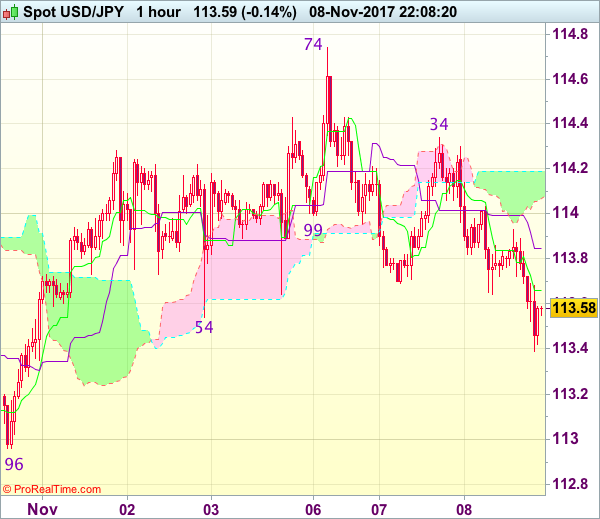
Trade Idea Wrap-up: USD/JPY – Sell at 114.00
USD/JPY - 113.60
Most recent candlesticks pattern : N/A
Trend : Near term up
Tenkan-Sen level : 113.66
Kijun-Sen level : 113.85
Ichimoku cloud top : 114.19
Ichimoku cloud bottom : 114.07
Original strategy :
Bought at 113.85, stopped at 113.65
Position : - Long at 113.85
Target : -
Stop : - 113.65
New strategy :
Sell at 114.00, Target: 113.00, Stop: 114.35
Position : -
Target : -
Stop : -
As the greenback has fallen again on active cross-buying in yen, dampening our bullishness and suggesting top has been formed at 114.74, hence consolidation with downside bias is seen for the fall from there to bring retracement of recent upmove, hence further weakness to 113.15-20 (50% Fibonacci retracement of 111.65-114.74), then test of previous support at 112.96 would be seen, however, break of latter level is needed to add credence to this view, bring further subsequent selloff to 112.60 but support at 112.30 should hold from here due to oversold condition.
In view of this, we are looking to sell dollar on recovery as 114.00 should limit upside. Only above resistance at 114.34 would abort and signal the retreat from 114.74 has ended instead, bring retest of this level first, above there would revive bullishness and extend recent rise from 107.32 to 115.00.
Is the Oil Rally Built on Weak Foundations?
Crude oil remained in the limelight on Wednesday, as it stabilized around $57 on the back of escalating tensions in the Middle East.
Early trading prices initially declined, due to Chinese crude imports dipping to a one year low but escalating tensions in the Middle East kept the bulls on the map. The current price action suggests that bulls have found support in the form of geopolitical risk. While further upside could be on the cards amid the current developments, the shaky foundation behind oil resurgence, could still invite bears to make an unwelcome appearance.
While growing optimism over OPEC extending the production cut deal beyond March 2018 also continues to support oil markets, the question is for how long? The ingredients for oil markets to remain depressed are present, especially when considering that OPEC has not only forecasted slower growth in demand for its crude but also predicted that U.S. Shale output will grow faster than expected in the next four years.
Taking a look at the technical picture, WTI Crude is unquestionably bullish on the daily charts. There have been consistently higher highs and higher lows, while lagging indicators such as the MACD, point to the upside. Bulls are hungry for $60 and may be able to reach this level if prices can stay above the $53.50 mark. The question everyone is asking, is what happens when or if WTI Crude hits $60 which is seen as a strong resistance level.
Dollar weighed by possible delay in tax cuts
The growing concern over potential delays to Donald Trump's tax reform plan have weighed on the Greenback, with the Dollar Index struggling to break above 95.00 as of writing.
It is becoming increasingly clear that the Dollar has become sensitive to expectations of Trump moving forward with the tax plan, with any negative news on the developments exposing the currency to downside risks. From a technical standpoint, the Dollar Index has found itself in a range on the daily charts with support at 94.40 and resistance at 95.10. A breakout above 95.10 may encourage a further incline higher towards 95.50. In an alternative scenario, sustained weakness below 94.40 may open a path lower towards 94.00.
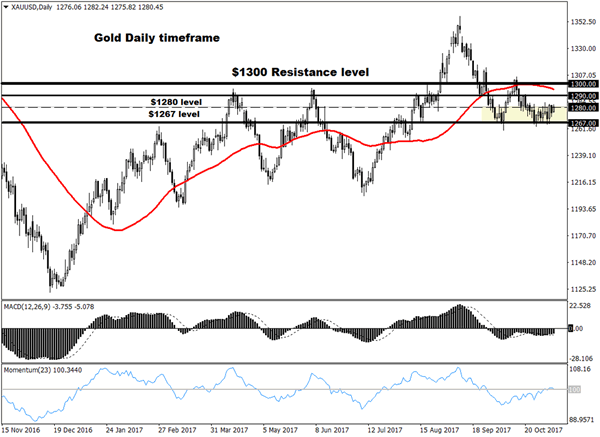
Commodity spotlight - Gold
Gold bulls received some support in the form of a weakening Dollar on Wednesday, with prices trading around $1280 as of writing.
The price action since the fourth week of October continues to suggest that the metal is waiting for a catalyst to nudge it back to life. A return of risk aversion sparked by geopolitical tensions or even fading optimism over Trump's tax reforms, could propel Gold back towards $1300. Alternatively, if the Dollar regains it's a mojo, then prices could descend back towards $1267. From a technical standpoint, the yellow metal still remains somewhat bearish on the daily charts, as there have been consistently lower lows and lower highs. $1280 remains an important resistance level and a failure of prices to close above that level, may trigger a decline back towards $1267 and $1260.
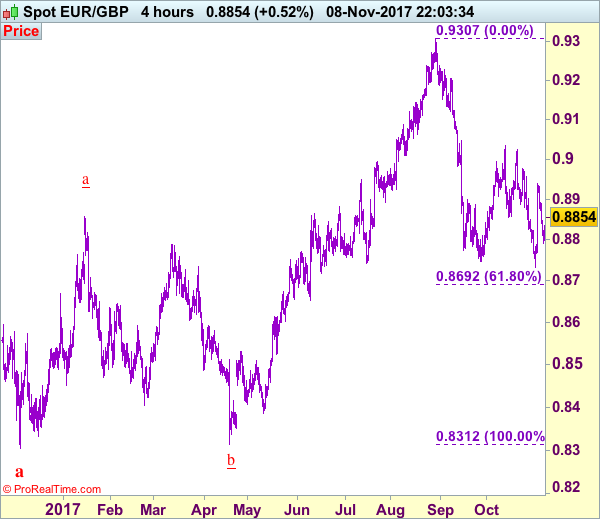
Trade Idea: EUR/GBP – Sell at 0.8890
EUR/GBP - 0.8851
Original strategy :
Sell at 0.8865, Target: 0.8735, Stop: 0.8905
Position : -
Target : -
Stop : -
New strategy :
Sell at 0.8890, Target: 0.8770, Stop: 0.8930
Position : -
Target : -
Stop : -
As the single currency found support at 0.8791 yesterday and euro has rebounded since, suggesting initial upside risk is for recovery to 0.8880-90, however, price should falter well below indicated resistance at 0.8939 (last week’s high) and bring another retreat later, below said support at 0.8791 would extend weakness to 0.8765-70 but break there is needed to signal the rebound from 0.8733 (last week’s low) has ended, bring retest of this level, break there would extend the fall from 0.9033 to 0.8700 first.
In view of this, we are looking to sell euro on further recovery as 0.8890-00 should limit upside. Only above 0.8939 resistance would abort and extend the rise from 0.8733 to resistance at 0.8957, however, break of 0.8976 resistance is needed to signal the fall from 0.9033 has ended instead, bring further gain to 0.9000, then retest of 0.9033 later.
Our preferred count is that, after forming a major top at 0.9805 (wave V), (A)-(B)-(C) correction is unfolding with (A) leg ended at 0.8400 (A: 0.8637, B: 0.9491 and 5-waver C ended at 0.8400. Wave (B) has ended at 0.9413 and impulsive wave (C) has either ended at 0.8067 or may extend one more fall to 0.8000 before prospect of another rally. Current breach of indicated resistance at 0.9043 confirms our view that the (C) leg has ended and bring stronger rebound towards 0.9150/54, then towards 0.9240/50.
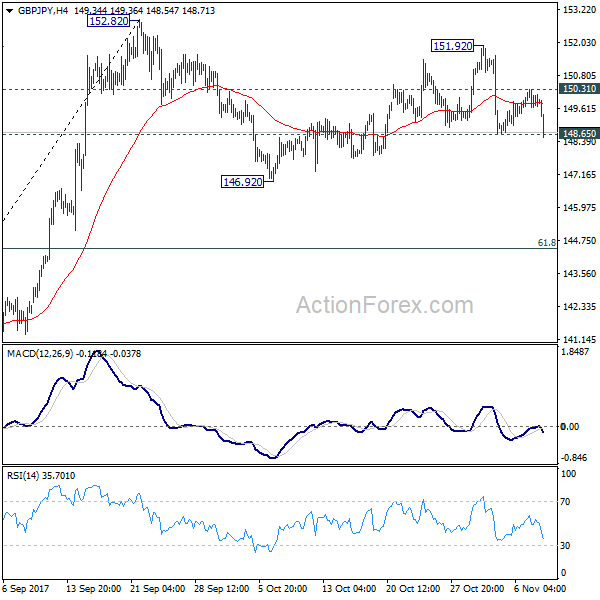
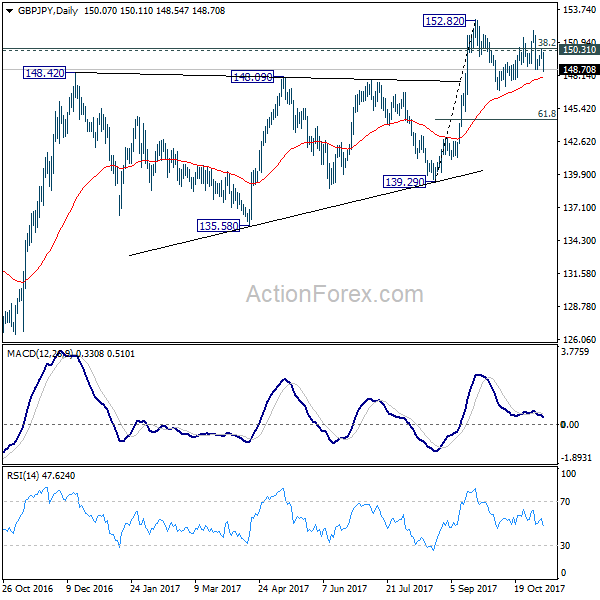
GBP/JPY Mid-Day Outlook
Daily Pivots: (S1) 149.70; (P) 150.01; (R1) 150.37; More
GBP/JPY's breach of 148.65 minor support suggest that fall from 151.92 is resuming. Such decline is seen as the third leg of the correction pattern from 152.82. Intraday bias is back on the downside through 146.92 support. At this point, we'd expect strong support from 61.8% retracement of 139.29 to 152.82 at 144.45 to contain downside and bring rebound. On the upside, above 150.31 will turn bias back to the upside to 151.92 instead.
In the bigger picture, medium term rebound from 122.36 is still expected to resume after corrective pull back from 152.82 completes. Firm break of 38.2% retracement of 196.85 to 122.36 at 150.43 will carry long term bullish implications. In that case, GBP/JPY could target 61.8% retracement at 167.78. However, break of 139.29 will indicate rejection from 150.43 key fibonacci level. And the three wave corrective structure of rebound from 122.36 will argue that larger down trend is resuming for a new low below 122.26.
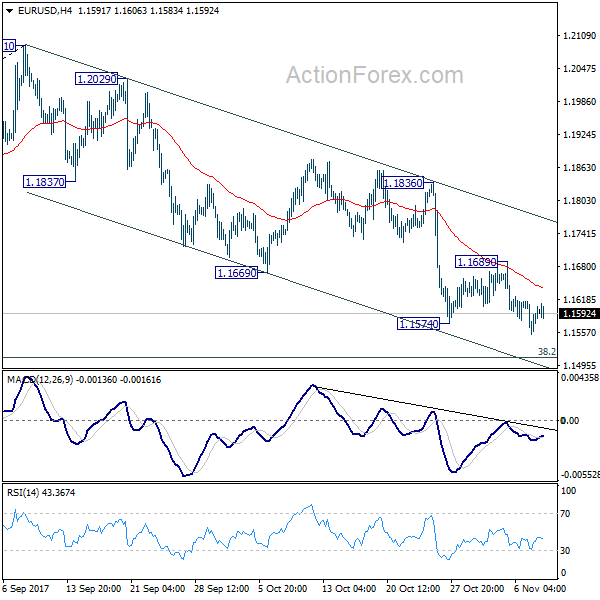
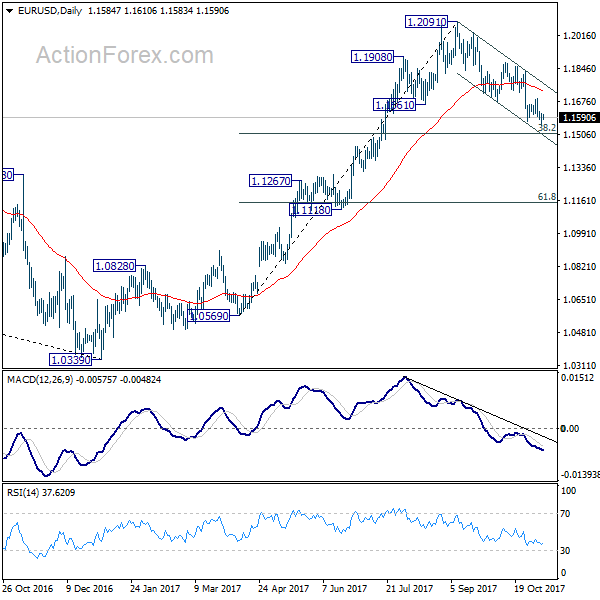
EUR/USD Mid-Day Outlook
Daily Pivots: (S1) 1.1554; (P) 1.1585 (R1) 1.1616; More...
No change in EUR/USD's outlook. With 1.1689 resistance intact, fall from 1.2091 is in progress for 38.2% retracement of 1.0569 to 1.2091 at 1.1510. We'd be cautious on strong support from there to bring rebound. But sustained break of 1.1510 will pave the way to next support zone at 1.1118/1267. On the upside, break of 1.1689 resistance is needed to confirm short term bottoming. Otherwise, outlook will remain bearish in case of recovery.
In the bigger picture, rise from 1.0339 medium term bottom is seen as a corrective move for the moment. Therefore, in case of another rally, we'd be cautious on 38.2% retracement of 1.6039 (2008 high) to 1.0339 (2017 low) at 1.2516 to limit upside and bring reversal. Meanwhile, sustained trading below 55 week EMA will suggest that such medium term rebound is completed and could then bring retest of 1.0339 low.