Sample Category Title
GBP/USD Analysis: Stuck At Monthly S1 At 1.3073
Initially, the Pound tried to restore some and even used a momentum provided by release of better than expected UK Services PMI to climb to the 1.3107 mark. However, the subsequent release of positive American data neutralized this attempt and returned the pair back to the monthly S1 at 1.3073.
Unless traders receive some clear signal the currency rate might continue moving in such indecisive manner for some while. Nevertheless, a pressure from the 100-day SMA on a daily chart is likely to push the pair down even further.
Although an attempt to surge to the 55-hour SMA is possible, but eventually it is still expected to slip to support area near the 1.3030 mark.
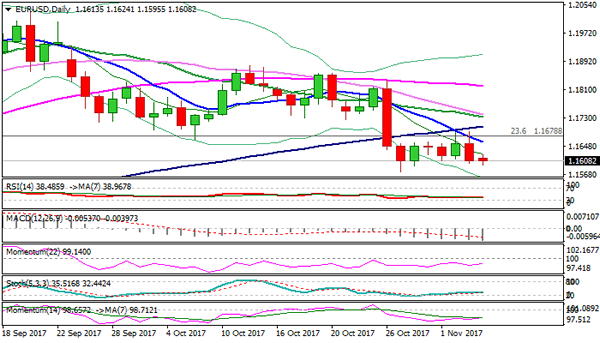
EUR/USD Analysis: Falls To 1.16 Amid Surprising US Data
A release of better that expected data on the US ISM Non-Manufacturing PMI led to sharp appreciation of the buck against the common European currency and resulted in a breakout from two junior ascending channels. An active recovery of the exchange rate seems unlikely, as the northern is contains a bunch of technical indicators, such as the weekly PP at 1.1631 and the falling 55- and 100-hour SMAs. Moreover, there is a slope on a daily chart that is likely to serve as an additional barrier. For this reason, the pair is expected to gradually slip to the bottom towards support area near the 1.1580 mark. However, for now the rate is squeezed between two vises at 1.1625 and 1.1600 and might continue this horizontal movement until catching a proper momentum.
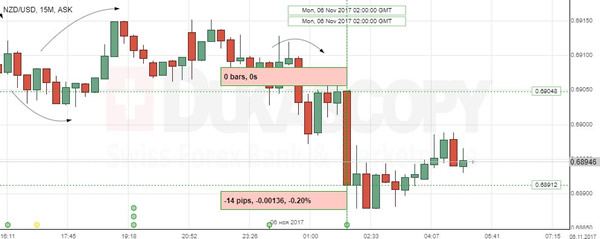
NZD/USD: NZ Inflation Expectations
The Kiwi weakened against the US Dollar after the Reserve Bank of New Zealand diminished its inflation expectations. The NZD/USD currency pair dropped 0.20% or 14 base points to the 0.6894 mark to continue gradual decrease.
The RBNZ quarterly survey showed that inflation growth is likely to remain tepid, adding to expectations for the Central Bank to keep the key interest rate at the record-low level of 1.75%. The Reserve Bank revealed that the country's businesses expect yearly inflation to grow average 1.9% over the next year, compared with a 1.8% growth projection previously. Meanwhile, the Bank’s two-year inflation forecasts fell to 2.0% from 2.1%
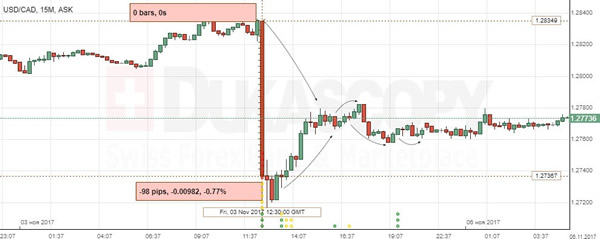
USD/CAD: Canadian Employment Change
The Canadian Dollar rose significantly against the US Dollar as the both North American countries released set of reports on Friday. The USD/CAD currency pair tumbled 98 base points or 0.77% to the 1.273, but tried to recover gradually.
Statistics Canada stated that the economy added 35.3K positions in October, mainly due to higher full-time employment, while the jobless rate rose to 6.3% as more people were seeking a job. The results will be closely watched by the Bank of Canada to decide whether to raise key interest rates again. Meanwhile, there was some strengthening in the wage growth, which could contribute to the Bank’s decision to proceed with monetary tightening.
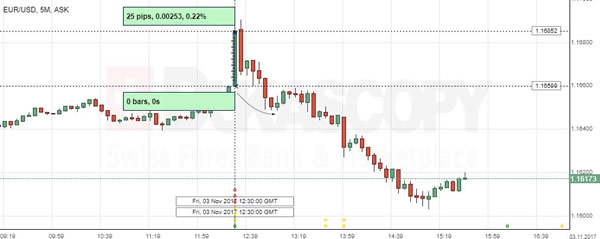
EUR/USD: US Non-Farm Employment Change
The range of the US economic reports caused a short-term strengthening of the EUR/USD currency pair, which continued the session at pre-data levels. The European single currency added 25 base points or 0.22% against the US dollar, but quickly returned to the 1.1650 area, where the bearish sentiment was sustained until Monday morning.
The Labour department revealed that the US job growth sped up in October, while the yearly wage growth as well as participation rate fell in the reported period, clouding the outlook of the job market. The report showed that the country’s economy added 261K jobs in the reported period, missing forecasts for a 310K increase. The weak pay growth is likely to hamper inflation to reach 2% target.
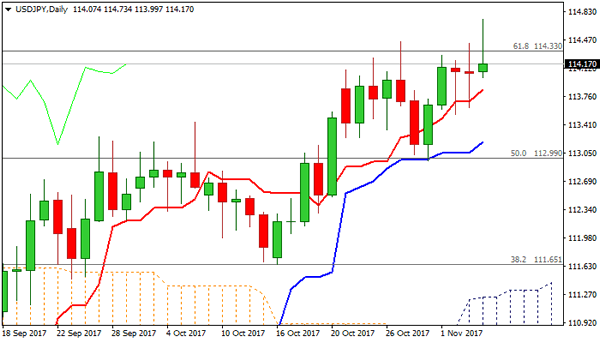
Technical Outlook: USDJPY – Buying Dips For Eventual Break Higher Remains Favored
The pair spiked to fresh nearly eight-month high at 114.73 in early Monday’s trading, but probes above previous peaks at 114.36/49 (10 May / 11 July) were so far short-lived, adding to strong indecision signals from last Thu/Fri long-legged Dojis.
Overall structure remains bullish and favors final break higher and test of next targets at 115.00 (round-figure) and 115.50 (10 Mar high).
Buying dips remains favored near-term scenario while the price stays above rising daily Tenkan-sen (113.84) while sustained break here would sideline bulls for deeper correction.
Rising Kijun-sen (113.19) and 31 Oct trough (112.95) mark next triggers, loss oof which would intensify downside pressure.
Res: 114.33, 114.49, 114.73, 115.00
Sup: 114.00, 113.84, 113.53, 113.19
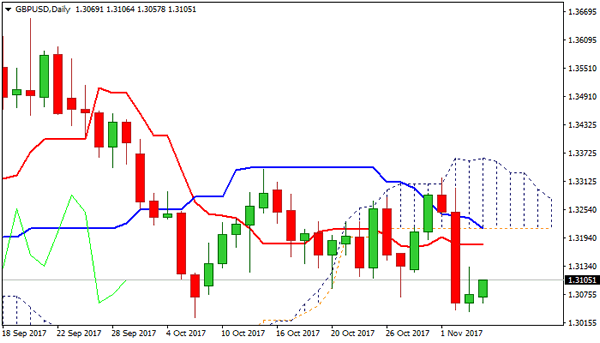
Technical Outlook: GBPUSD – Thick Hourly Cloud Marks Strong Obstacle For Recovery Rally
Cable is in recovery mode on Monday and probes above 1.3100 barrier, after last week’s post-BoE’s fall stalled ahead of previous low of 06 Oct at 1.3026.
Recovery attempts face strong barrier from thick hourly cloud (spanned between 1.3113 and 1.3181, with cloud top being reinforced by daily Tenkan-sen), break of which would open next key barrier at 1.3214 (daily cloud base / daily Kijun-sen).
Extended recovery is expected to stall here and keep in play bears from 1.3655 (20 Sep high) for fresh attack at 1.3026 and psychological 1.3000 support.
Alternative scenario requires sustained break above 1.3337/20 (13 Oct / 01 Nov highs) to confirm double-bottom (1.3026/38) and spark stronger recovery of 1.3655/1.3026 fall.
Res: 1.3113, 1.3132, 1.3181, 1.3214
Sup: 1.3057, 1.3038, 1.3026, 1.3000
Technical Outlook: EURUSD – Downside Remains At Risk For Extension Below 1.1574 Pivot, While Falling 10SMA Caps
The Euro stands at the back foot on Monday and pressuring 1.1600 support, which guards post ECB's multi-month low at 1.1574, posted on 27 Sep. Last Friday's close in red which formed bearish Outside Day pattern, weighs on near-term action for renewed attempt at 1.1574 pivot and extension of the downleg from 1.2092.
Completion of H&S pattern on daily chart was strong bearish signal, however, the pair needs clear break below 1.1574/1.1690 congestion to confirm bearish continuation.
Sustained break below 1.1574 would open next strong support at 1.1510 (Fibo 38.2% of 1.0570/1.2092 rally).
Falling 10SMA which formed bear-cross with 100SMA last week continues to cap upside attempts and offers solid resistance at 1.1662.
Alternative scenario requires close above 1.1690 (last Friday's high/top of near-term consolidation range) to sideline immediate bearish threats, with lift above 1.1705/27 (daily Tenkan-sen/Kijun-sen) needed to signal stronger recovery.
Res: 1.1628, 1.1662, 1.1690, 1.1705
Sup: 1.1595, 1.1574, 1.1510, 1.1445
WTI Ascending Scallop At 61.8 Fibonacci Retracement
The WTI is in a strong uptrend. The price is getting positive momentum and at this point a retracement towards the POC could possibly be used for another leg to the upside. Near term historical buyers are aligned with the POC 55.00-55.20 (Order block, 61.8, D L3, trend line, ATR projection low).A retracement to 61.8 is in a strong confluence with the order block and near term buyers. However 1h momentum or 4h close above W H3 56.12 should make a continuation move towards 56.67, 56.93 and 57.65 and the ascending scallop will be completed.
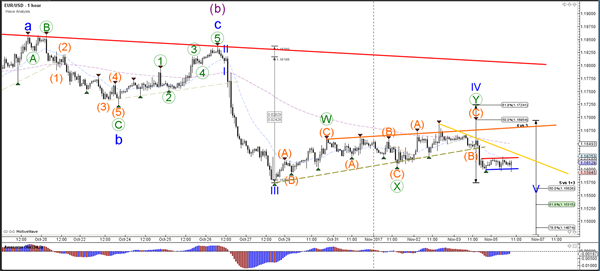
Daily Wave Analysis: US Dollar Builds Corrective Patterns At Resistance Zone
Currency pair EUR/USD
EUR/USD built a corrective pattern which is typical for a wave 4 (blue). The bearish breakout could indicate a potential continuation within wave 5 (blue) towards the Fibonacci retracement levels of wave 4 (light purple).
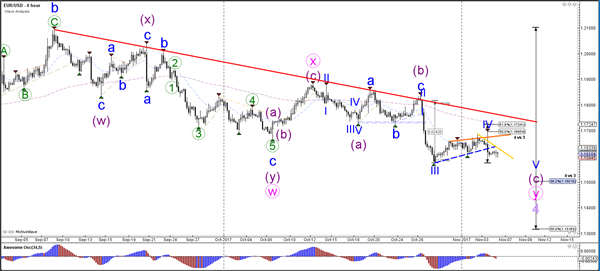
The EUR/USD is building a sideways zone within the bearish breakout. A bearish break below support (blue) could confirm more downside whereas a bullish break above resistance (red) could indicate a slightly larger correction. The bearish structure is invalidated if strong bullish price action is visible.
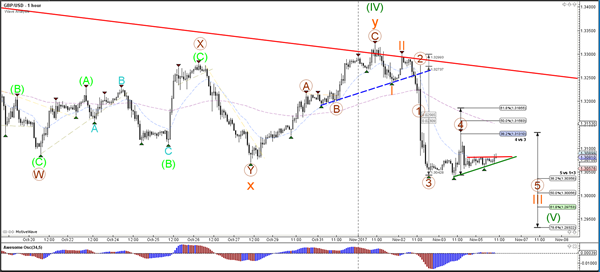
Currency pair GBP/USD
The GBP/USD broke the support trend lines (dotted blue) and is now building a triangle chart pattern. A new bearish breakout could indicate a potential continuation towards the Fibonacci targets of wave 5 vs 1+3 (green).
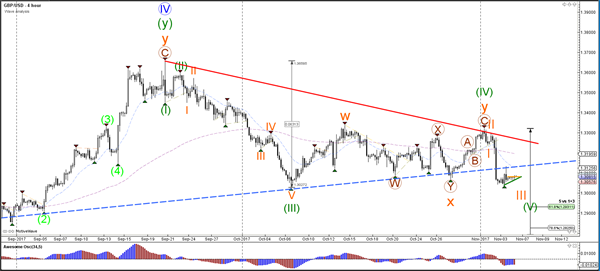
The GBP/USD retraced back to the 38.2% Fibonacci level of wave 4 (brown) of a larger wave 3 (orange).
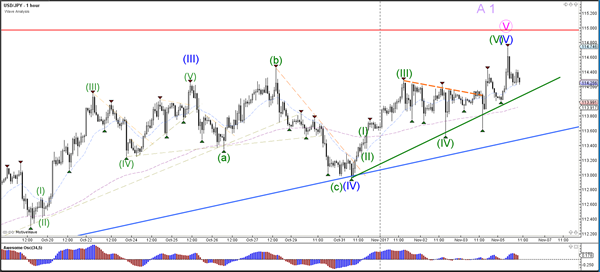
Currency pair USD/JPY
The USD/JPY is challenging the 114.50-115 resistance zone, which is a major break or bounce spot. The trend is up at the moment but price seems to be losing steam and speed as it approaches resistance (red).
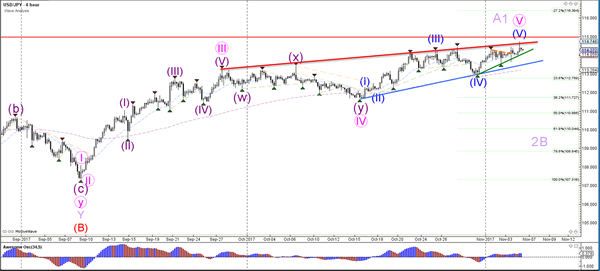
The USD/JPY will need to break above resistance or below support (blue) before the direction could be clear.