Sample Category Title
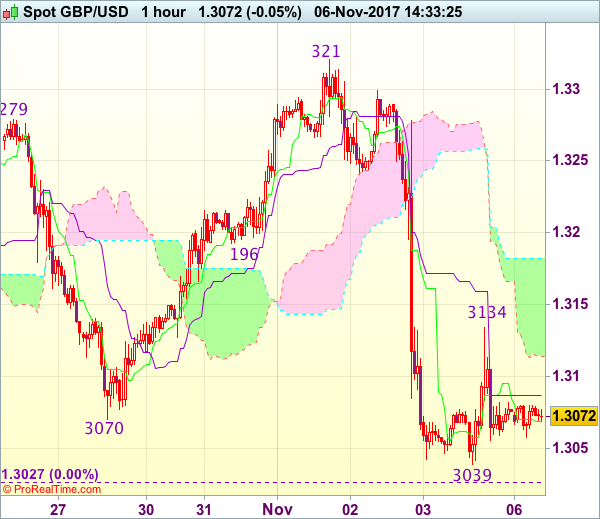
Trade Idea : GBP/USD – Sell at 1.3150
GBP/USD - 1.3071
Most recent candlesticks pattern : N/A
Trend : Near term down
Tenkan-Sen level : 1.3069
Kijun-Sen level : 1.3087
Ichimoku cloud top : 1.3182
Ichimoku cloud bottom : 1.3114
Original strategy :
Sell at 1.3150, Target: 1.3030, Stop: 1.3185
Position : -
Target : -
Stop : -
New strategy :
Sell at 1.3150, Target: 1.3030, Stop: 1.3185
Position : -
Target : -
Stop : -
As cable has remained under pressure after last week’s selloff from 1.3321 to 1.3039, adding credence to our view that early erratic rise from 1.3027 has ended and bearishness remains for further fall towards previous chart support at 1.3027, however, break there is needed to signal early downtrend has resumed for weakness to psychological support at 1.3000, then towards 1.2970-75 which is likely to hold from here due to near term oversold condition.
In view of this, would not chase this fall here and would be prudent to sell cable on recovery as 1.3150 should limit upside and bring another decline later. Above 1.3200 would defer and prolong choppy trading, risk rebound to 1.3235-40 first.
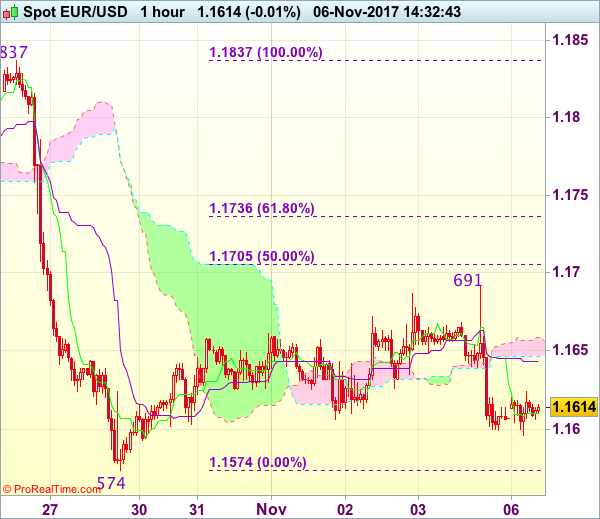
Trade Idea : EUR/USD – Hold short entered at 1.1620
EUR/USD - 1.1612
Most recent candlesticks pattern : N/A
Trend : Down
Tenkan-Sen level : 1.1610
Kijun-Sen level : 1.1644
Ichimoku cloud top : 1.1658
Ichimoku cloud bottom : 1.1647
Original strategy :
Sold at 1.1620, Target: 1.1520, Stop: 1.1655
Position : - Short at 1.1620
Target : - 1.1520
Stop : - 1.1655
New strategy :
Hold short entered at 1.1620, Target: 1.1520, Stop: 1.1655
Position : - Short at 1.1620
Target : - 1.1520
Stop : - 1.1655
The single currency dropped after meeting renewed selling interest at 1.1691, adding credence to our view that top has been formed there and consolidation with downside bias remains for weakness to previous support at 1.1574, however, break there is needed to confirm recent decline has resumed and extend fall to 1.1520-25, then 1.1500 but near term oversold condition should prevent sharp fall below latter level.
In view of this, we are holding on to our short position entered at 1.1620. Above 1.1650-55 would risk another bounce to 1.1691, however, only break there would abort and suggest further choppy trading above 1.1574 and bring a stronger rebound to 1.1700-05 but upside should be limited to previous support at 1.1725 (now resistance).
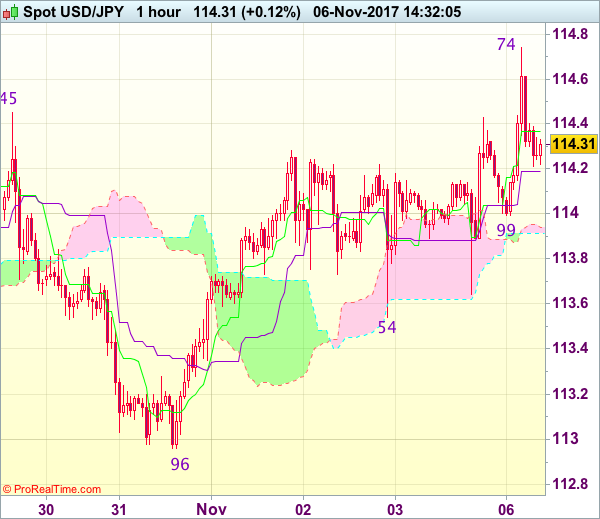
Trade Idea : USD/JPY – Buy at 113.85
USD/JPY - 114.30
Most recent candlesticks pattern : N/A
Trend : Near term up
Tenkan-Sen level : 114.37
Kijun-Sen level : 114.19
Ichimoku cloud top : 113.94
Ichimoku cloud bottom : 113.91
Original strategy :
Buy at 113.80, Target: 114.80, Stop: 113.45
Position : -
Target : -
Stop : -
New strategy :
Buy at 113.85, Target: 114.85, Stop: 113.50
Position : -
Target : -
Stop : -
Although the greenback broke above indicated previous resistance at 114.45-50, lack of follow through buying and current retreat fro 114.74 suggest consolidation below this level would be seen and pullback to 113.95-00 cannot be ruled out, however, reckon 113.75-80 would limit downside and bring another rise later, above said resistance at 114.74 would extend recent upmove from 107.32 to 115.00 but overbought condition should limit upside to another previous resistance at 115.51.
In view of this, we are looking to buy dollar on pullback as 113.80 should limit downside and bring another rise later. Below support at 113.54 would abort and prolong consolidation, risk weakness to 113.20-25, however, reckon support at 112.96 would remain intact, bring another rise later.
Aussie Dollar Trading On A Stronger Footing This Morning
For the 24 hours to 23:00 GMT, the AUD declined 0.82% against the USD and closed at 0.7648 on Friday.
LME Copper prices rose 0.9% or $59.5/MT to $6914.5/MT. Aluminium prices rose 0.6% or $13.0/MT to $2165.0/MT.
In the Asian session, at GMT0400, the pair is trading at 0.7658, with the AUD trading 0.13% higher from Friday’s close.
The pair is expected to find support at 0.7633, and a fall through could take it to the next support level of 0.7609. The pair is expected to find its first resistance at 0.7688, and a rise through could take it to the next resistance level of 0.7719.
Going forward, Australia’s AiG performance of construction index for October, due overnight, along with RBA’s interest rate decision, slated to be released tomorrow.
The currency pair is showing convergence with its 20 Hr moving average and trading below its 50 Hr moving average.

Euro Trading Higher In The Morning Session
For the 24 hours to 23:00 GMT, the EUR declined 0.42% against the USD and closed at 1.1607 on Friday.
The US Dollar recovered from its initial losses against its major peers, following better than expected data on the US ISM non-manufacturing PMI.
The ISM non-manufacturing PMI unexpectedly rose to 60.1, against market expectations of a fall to a level of 58.5. In the prior month, the non-manufacturing PMI had registered a level of 59.8. However, the final Markit services PMI remained flat at 55.3 in October from last month, against market expectations of an advance to a level of 55.9. The preliminary figures had indicated an advance to 55.9.
US jobs market report showed a mixed picture about the economy. US non-farm payrolls advanced by 261.0K in October, compared to a revised advance of 18.0K in the prior month. Market expectation was for non-farm payrolls to increase by 313.0K. Meanwhile, the nation’s unemployment rate unexpectedly declined to 4.1% in the last month, from a rate of 4.2% in the previous month. Additionally, US average hourly earnings rose 2.4% YoY in October, missing market expectations for an advance of 2.7%. In the last month, average hourly earnings had climbed by a revised 2.8%.
Separately, US trade deficit expanded to $43.5 billion in September, compared to a revised trade deficit of $42.8 billion in the previous month. Market expectation was for the nation to register a trade deficit of $43.2 billion. Moreover, the final durable goods orders rose 2.0% in September, at par with market expectations. Durable goods orders had registered a similar rise in the prior month. Meanwhile, US factory orders registered a rise of 1.4% on a monthly basis in September, compared to a rise of 1.2% in the prior month. Markets were also expecting factory orders to advance 1.2%.
In the Asian session, at GMT0400, the pair is trading at 1.1614, with the EUR trading 0.06% higher from Friday’s close.
The pair is expected to find support at 1.1577, and a fall through could take it to the next support level of 1.1541. The pair is expected to find its first resistance at 1.167, and a rise through could take it to the next resistance level of 1.1727.
Moving ahead, Eurozone’s services PMI for October along with the Sentix investor confidence index for the region in November, both due to release today, would grab significant market attention. Also, Germany’s factory orders for September and services PMI data for October, scheduled today, would be closely assessed by investors. In the US, Fed Chairwoman, Janet Yellen’s speech, due later in the day, would be eyed by traders.
The currency pair is trading below its 20 Hr and 50 Hr moving averages.

UK’s Services Sector Expanded At Its Fastest Rate In Six Months In October
For the 24 hours to 23:00 GMT, the GBP rose 0.16% against the USD and closed at 1.3074 on Friday, following robust UK Markit services PMI data.
Data showed that Britain's services sector unexpectedly rose to 55.6 in October, compared to a reading of 53.6 reported in the previous month. Markets were expecting the index to fall to a level of 53.3. The growth in UK's dominant sector was led by an advance in order books and strong client demand.
In the Asian session, at GMT0400, the pair is trading at 1.3077, with the GBP trading marginally higher from Friday's close.
The pair is expected to find support at 1.3034, and a fall through could take it to the next support level of 1.2991. The pair is expected to find its first resistance at 1.3126, and a rise through could take it to the next resistance level of 1.3175.
Amid a lack of major economic releases in the UK today, trading trends in the currency pair would be determined by global economic factors.
The currency pair is trading between its 20 Hr and 50 Hr moving averages.

BoJ Governor Remains Confident About Japan’s Economy And Inflation Outlook
For the 24 hours to 23:00 GMT, the USD rose 0.06% against the JPY and closed at 114.12 on Friday.
Minutes of the Bank of Japan's (BoJ) September policy meeting, which were released overnight, revealed that Japan's economy continued to proceed at an acceptable pace. However, the policy members cited downside risks to growth amid uncertainty in US economic policies and Brexit outcome. Also, most of the board members believed that the BoJ's current policy was adequate to achieve 2.0% inflation in the long term.
In other news, Japan's services PMI climbed to more than two-year high of 53.4 in October due to a sharp increase in new orders, from a reading of 51.0 recorded in the previous month.
In the Asian session, at GMT0400, the pair is trading at 114.34, with the USD trading 0.19% higher from Friday's close.
Earlier this morning, the BoJ Governor, Haruhiko Kuroda, expressed his confidence in Japan's economy by stating that the nation's economic growth is gathering momentum and there is a growing possibility of inflation hitting the 2.0% target, thus strengthening expectations that no additional stimulus is forthcoming.
He also stated that there is no need to alter the pace of its ETF purchases under its stimulus programme for the time being.
The pair is expected to find support at 113.74, and a fall through could take it to the next support level of 113.15. The pair is expected to find its first resistance at 114.83, and a rise through could take it to the next resistance level of 115.33.
With no additional economic release in Japan today, traders will look forward to global macroeconomic data for further direction.
The currency pair is trading above its 20 Hr and 50 Hr moving averages.

Swiss Franc Trading Slightly Higher, Ahead Of Consumer Price Index Data
For the 24 hours to 23:00 GMT, the USD rose 0.13% against the CHF and closed at 1.0008 on Friday.
In the Asian session, at GMT0400, the pair is trading at 1.0005, with the USD trading marginally lower from Friday’s close.
The pair is expected to find support at 0.9962, and a fall through could take it to the next support level of 0.992. The pair is expected to find its first resistance at 1.0036, and a rise through could take it to the next resistance level of 1.0068.
Investors will now look forward to Switzerland’s inflation figures for October, set to release in a few hours, for further cues.
The currency pair is trading between its 20 Hr and 50 Hr moving averages.

Canada’s Trade Deficit Remained Steady, Unemployment Rate Surprisingly Rose
For the 24 hours to 23:00 GMT, the USD declined 0.36% against the CAD and closed at 1.2766 on Friday.
Macroeconomic data showed that Canada reported international merchandise trade deficit of C$3.18 billion in September, from a revised international merchandise trade deficit of C$3.18 billion in the prior month. Market had anticipated the nation to report a trade deficit of C$3.0 billion. Meanwhile, the unemployment rate in Canada unexpectedly rose to 6.3% in October, compared to market expectations of an unchanged reading. In the prior month, the unemployment rate stood at 6.2%.
In the Asian session, at GMT0400, the pair is trading at 1.2768, with the USD trading a tad higher from Friday's close.
The pair is expected to find support at 1.271, and a fall through could take it to the next support level of 1.2652. The pair is expected to find its first resistance at 1.2831, and a rise through could take it to the next resistance level of 1.2894.
Later in the day, traders will await the release of Canada's Ivey PMI data for October.
The currency pair is trading below its 20 Hr and 50 Hr moving averages.

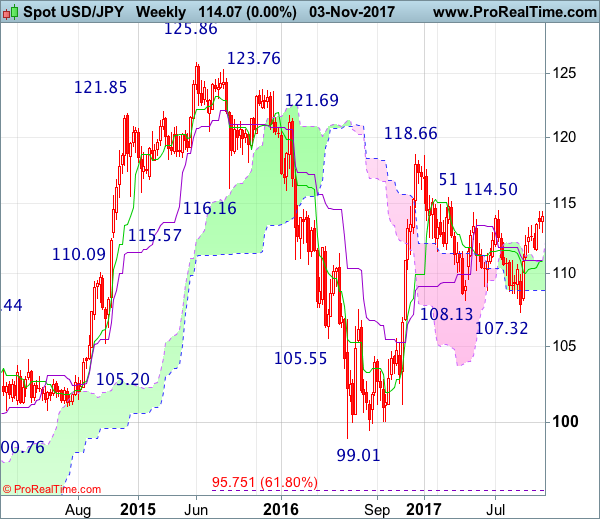
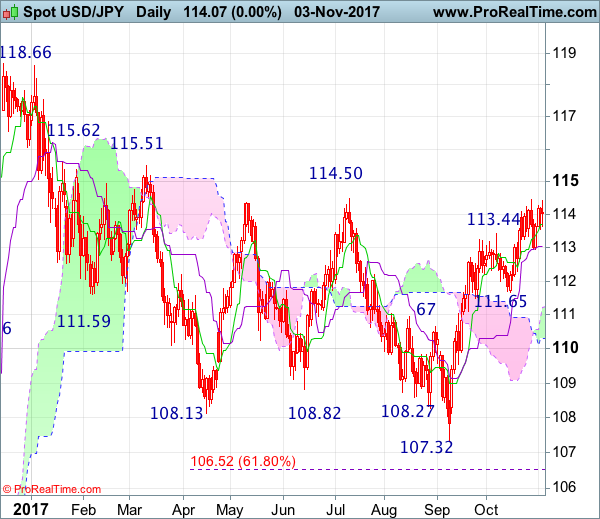
USD/JPY Candlesticks and Ichimoku Analysis
Weekly
• Last Candlesticks pattern: Dark cloud cover
• Time of formation: 10 Jul 2017
• Trend bias: Down
Daily
• Last Candlesticks pattern: Evening doji
• Time of formation: 7 Aug 2017
• Trend bias: Down
USD/JPY – 114.32
Dollar’s breach of previous resistance at 114.45-50 adds credence to the view that the fall from 118.66 has ended and upside bias remains for the rise from 107.32 to extend further gain to 115.00, then towards previous resistance at 115.51-62, however, loss of momentum should prevent sharp move beyond 116.00-10 and reckon 116.50-60 would hold from here, risk from there is seen for another retreat later.
On the downside, whilst initial pullback to 113.60-65 is likely, reckon the Kijun-Sen (now at 113.20) would contain downside and bring another rise later to aforesaid upside targets. Below support at 112.96 would defer and suggest a temporary top is formed instead, risk correction to 112.30 but still reckon downside would be limited to 112.00 and previous support at 111.65 should remain intact, bring rebound later.
Recommendation : Buy at 113.40 for 115.40 with stop below 112.40.
On the weekly chart, as the single currency has risen again after finding renewed buying interest at 112.96 last week and broke above indicated previous resistance at 114.45-50, suggesting the rise from 107.32 is still in progress, this also signal early erratic decline from 118.66 has ended at 107.32, hence consolidation with upside bias remains for further gain to 115.51-62 resistance, break there would extend gain towards 116.50-60 first, having said that, near term overbought condition should limit upside to 117.00-10, risk from there is seen for another retreat later.
On the downside, expect pullback to be limited to 113.40-50 and said support at 112.96 should remain intact, bring another rise later. A drop below 112.96 support would defer and suggest a temporary top is possibly formed instead, bring pullback to 112.30, then 112.00, however, previous support at 111.65 should hold. Only a break below this level would signal the rise from 107.32 low has ended, bring deeper correction to the Kijun-Sen (now at 111.03) which is likely to hold from here.