Sample Category Title
GOLD – Looks To Resume Its Downside Pressure
GOLD - The commodity saw a close lower the past week though marginally. On the downside, support comes in at the 1,270.00 level where a break will turn attention to the 1,260.00 level. Further down, a cut through here will open the door for a move lower towards the 1,250.00 level. Below here if seen could trigger further downside pressure targeting the 1,240.00 level. Conversely, resistance resides at the 1,280.00 level where a break will aim at the 1,290.00 level. A turn above there will expose the 1,300.00 level. Further out, resistance stands at the 1,310.00 level. All in all, GOLD looks to strengthen further on correction.
EUR/USD Weekly Outlook
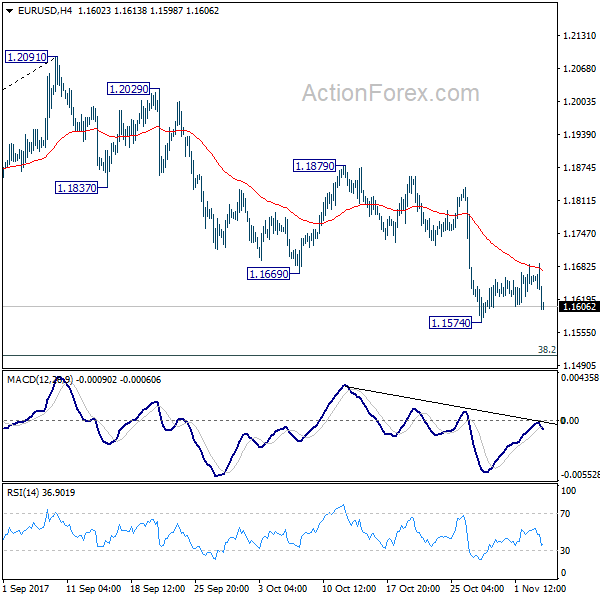
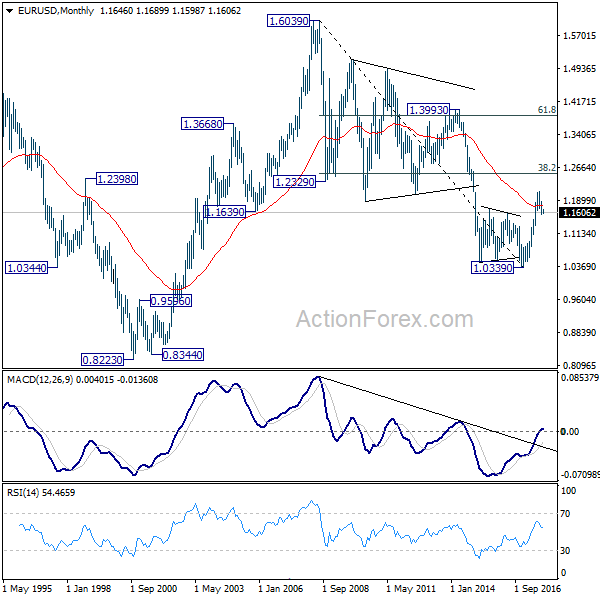
EUR/USD stayed in consolidation above 1.1574 last week and outlook is unchanged. Initial bias remains neutral this week first. Break of 1.1574 will resume the decline from 1.2091 and target 38.2% retracement of 1.0569 to 1.2091 at 1.1510. On the upside, break of 1.1879 resistance is needed to confirm completion of the decline from 1.2091. Otherwise, near term outlook will stay bearish even in case of another recovery.
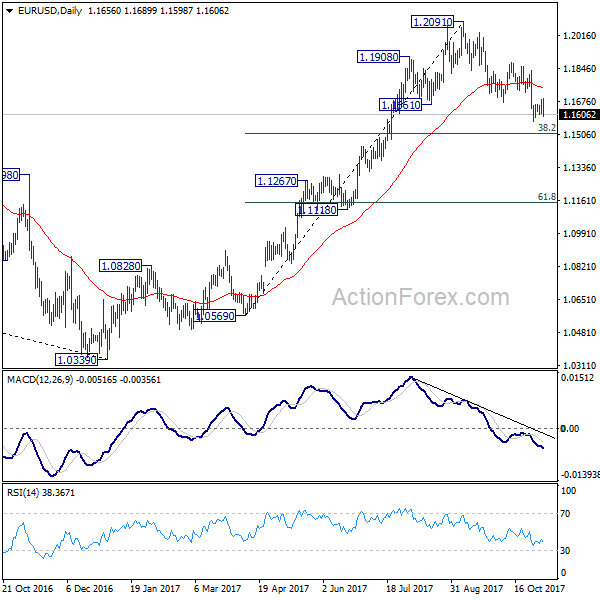
In the bigger picture, rise from 1.0339 medium term bottom is seen as a corrective move for the moment. Therefore, in case of another rally, we'd be cautious on 38.2% retracement of 1.6039 (2008 high) to 1.0339 (2017 low) at 1.2516 to limit upside and bring reversal. Meanwhile, sustained trading below 55 week EMA (now at 1.1346) will suggest that such medium term rebound is completed and could then bring retest of 1.0339 low.
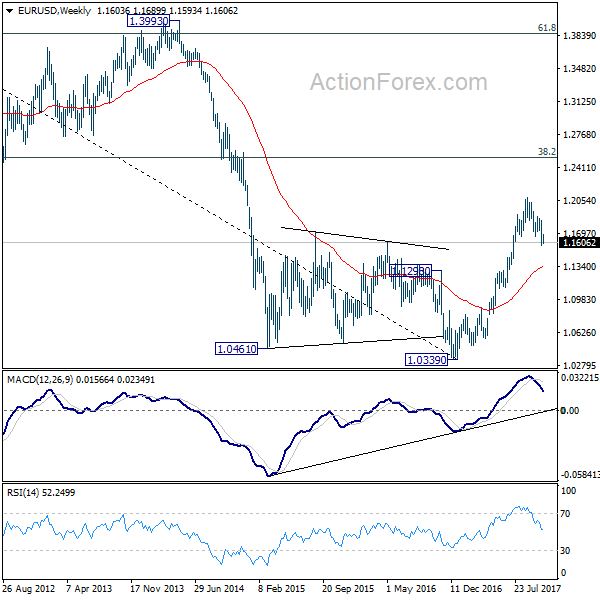
In the long term picture, 1.0339 is now seen as an important bottom as the down trend from 1.6039 (2008 high) could have completed. It's still early to decide whether price action form 1.0339 is developing into a corrective or impulsive move. On the upside, strong resistance could be seen from 38.2% retracement of 1.6039 to 1.0339 at 1.2516. On the downside, we're not anticipating a break of 1.0339 in near to medium term.
USD/JPY Weekly Outlook
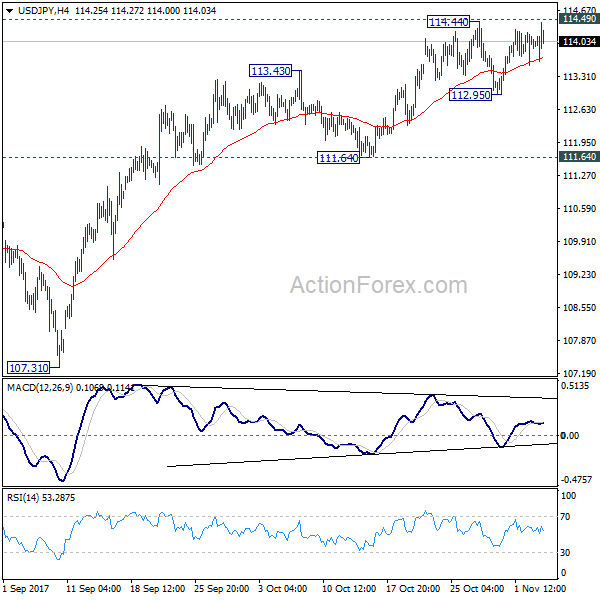
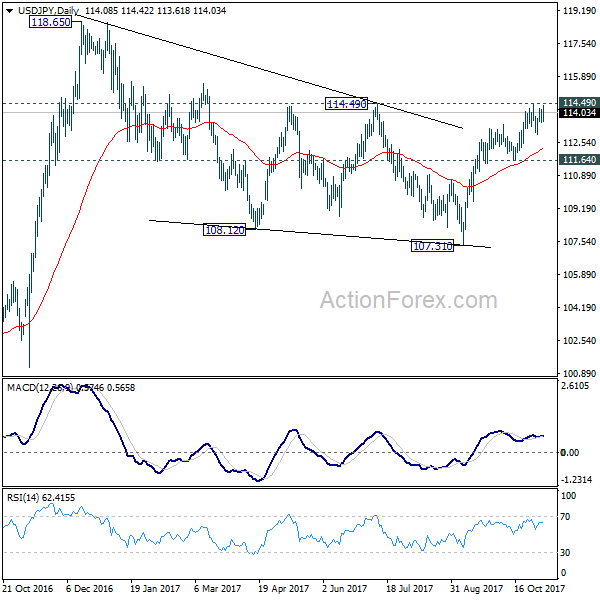
USD/JPY stayed in the consolidation from 114.44 last week and outlook is unchanged. Initial bias remains neutral this week first. Decisive break of 114.49 key resistance will confirm that correction pattern from 118.65 has completed at 107.31 already. And USD/JPY should then target a test on 118.65. On the downside, below 112.95 will bring deeper pull back. But strong support should be seen from 111.64 support to maintain bullishness and bring rebound.
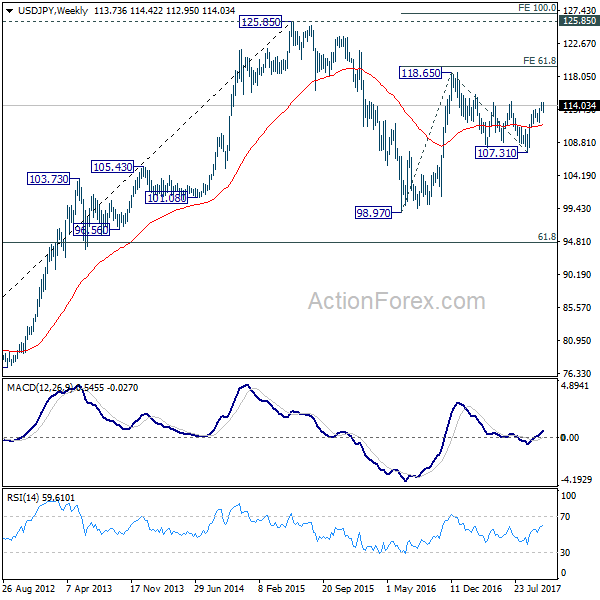
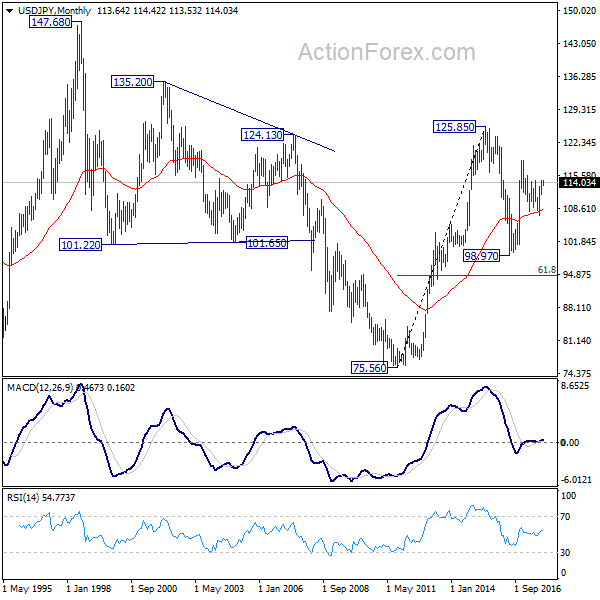
In the bigger picture, medium term rise from 98.97 (2016 low) is not completed yet. It should resume after corrective fall from 118.65 completes. Break of 114.49 resistance will likely resume the rise to 61.8% projection of 98.97 to 118.65 from 107.31 at 119.47 first. Firm break there will pave the way to 100% projection at 126.99. This will be the key level to decide whether long term up trend is resuming.
In the long term picture, the rise from 75.56 (2011 low) long term bottom to 125.85 top is viewed as an impulsive move, no change in this view. Price actions from 125.85 are seen as a corrective move which could still extend. In case of deeper fall, downside should be contained by 61.8% retracement of 75.56 to 125.85 at 94.77. Up trend from 75.56 is expected to resume at a later stage for above 135.20/147.68 resistance zone.
GBP/USD Weekly Outlook
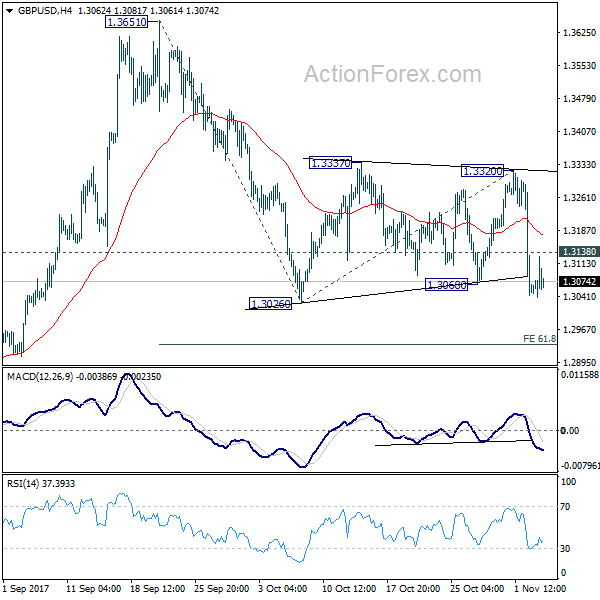
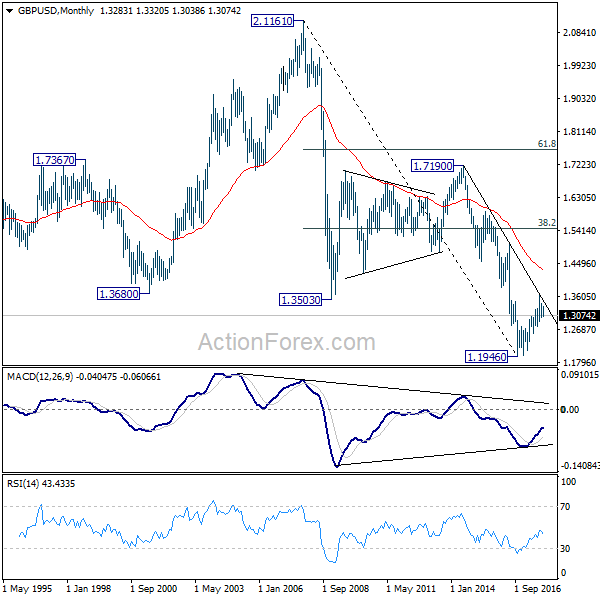
GBP/USD's sharp decline last week argues that fall from 1.3651 might be resuming. Initial bias remains on the downside this week with focus on 1.3026 support. Break will confirm this bearish case and target 61.8% projection of 1.3651 to 1.3026 from 1.3320 at 1.2934 first. Break will bring deeper decline to 1.2773 key support level. On the upside, above 1.3138 minor resistance will extend the consolidation from 1.3026 with another rise.
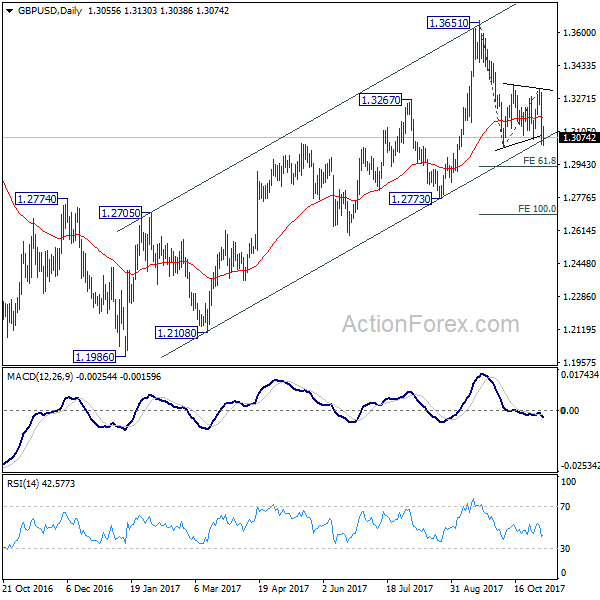
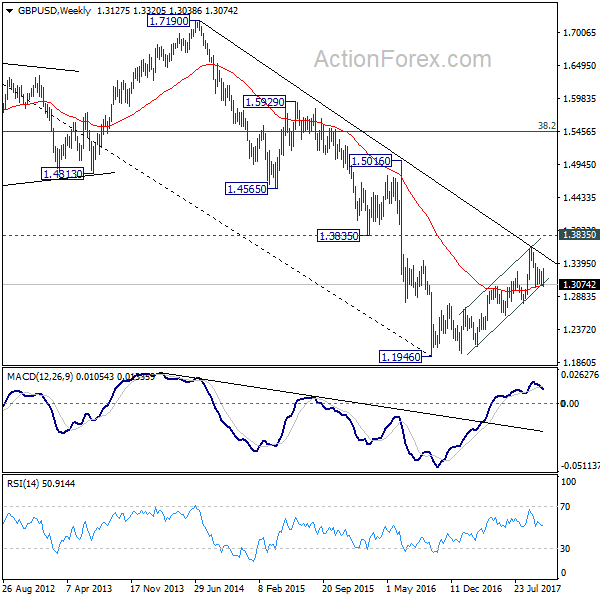
In the bigger picture, as noted before, GBP/USD hit strong resistance from the long term falling trend line. Current development is starting to favor that corrective rebound from 1.1946 low has completed at 1.3651. Decisive break of 1.2773 will confirm this bearish case and target a test on 1.1946 low next, with prospect of resuming the low term down trend. Nonetheless, break of 1.3320 resistance will restore the rise from 1.1946 for 38.2% retracement of 2.1161 (2007 high) to 1.1946 (2016 low) at 1.5466 .
In the longer term picture, long the outlook is turned a bit mixed as GBP/USD failed to break through falling tend line resistance. We'll stay neutral first and assess the outlook again and price actions unfold.
USD/CHF Weekly Outlook
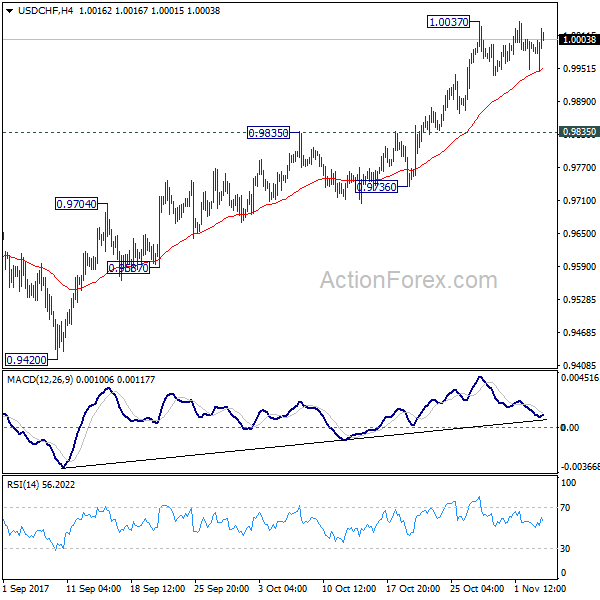
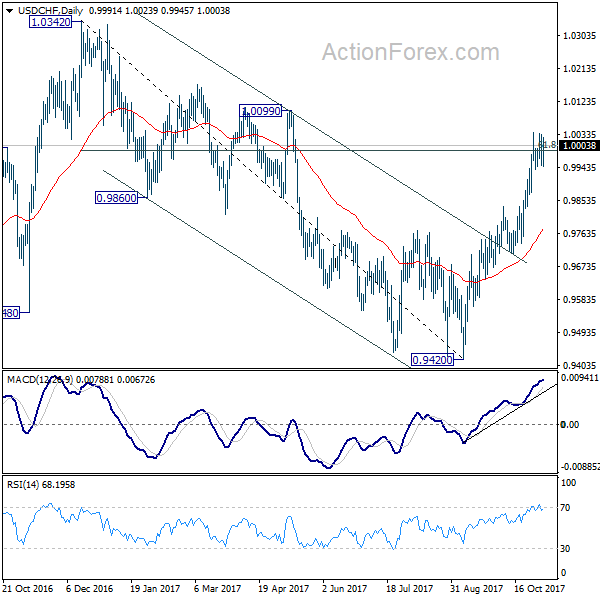
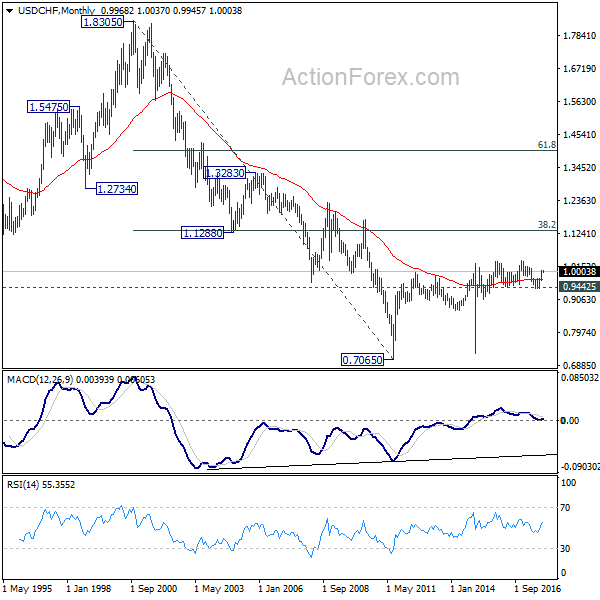
USD/CHF stayed in consolidation below 1.0037 last week and outlook is unchanged. Initial bias remains neutral this week first. In case of another fall, downside should be contained above 0.9835 resistance turned support and bring rally resumption. On the upside break of 1.0037 will resume whole rally from 0.9420. And with sustained trading above 61.8% retracement of 1.0342 to 0.9420 at 0.9990, USD/CHF should then target a test on 1.0342 key resistance.
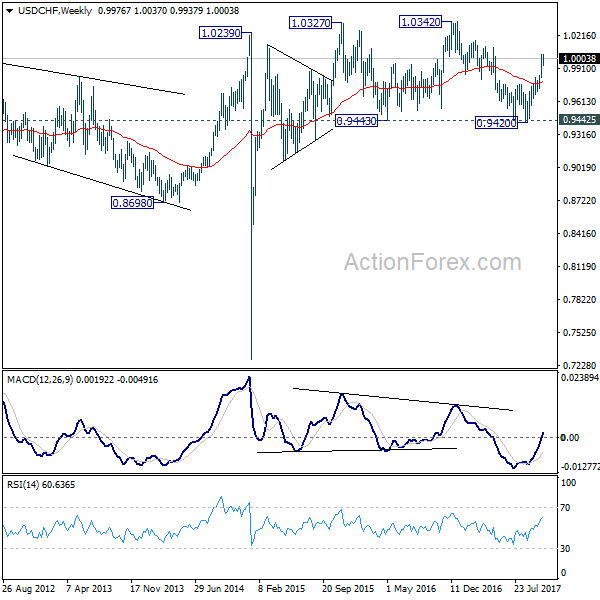
In the bigger picture, current development suggests that USD/CHF has defended 0.9443 (2016 low) key support level again. Rise from 0.9420 could is a medium term up move and should target a test on 1.0342 high. This represents the upper end of a long term range that started back in 2015. On the downside, break of 0.9736 support is now needed to indicate completion of the rise from 0.9420. Otherwise, further rally will remain in favor in medium term.
In the long term picture, while upside momentum is unconvincing, with 0.9443 key support intact, rise from 0.7065 (2011 low) is still expected to continue. Break of 1.0342 will target 38.2% retracement of 1.8305 (2000 high) to 0.7065 at 1.1359.
AUD/USD Weekly Outlook
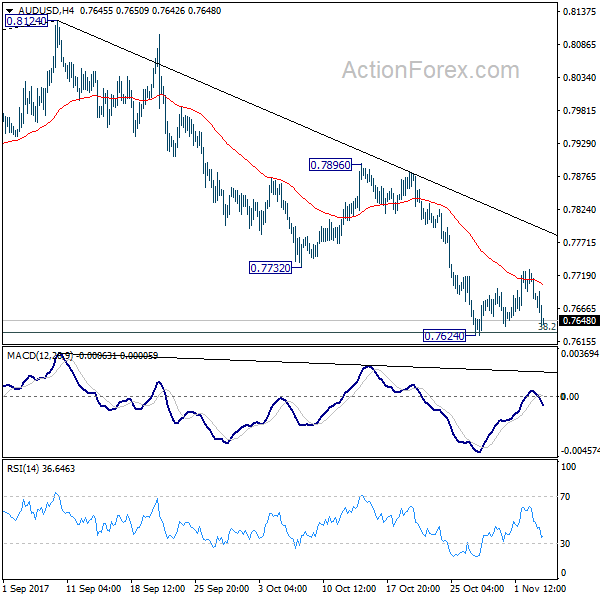
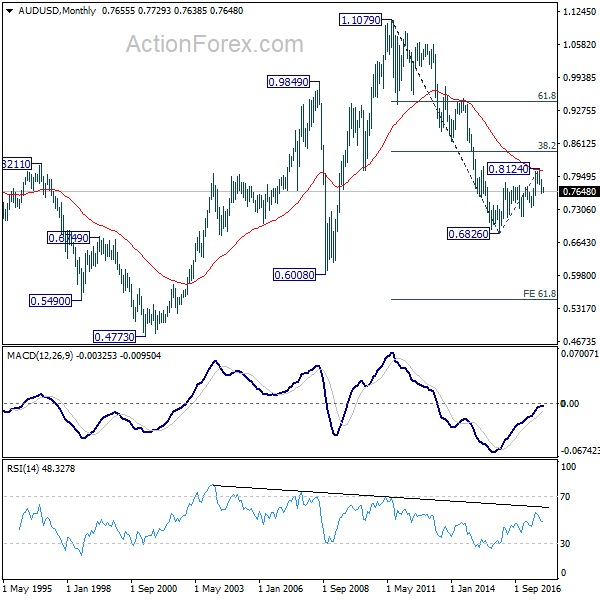
AUD/USD stayed in consolidation above 0.7624 last week with weak recovery. Initial bias remains neutral this week first with focus back on 0.7624. Decisive break there will pave the way to next key cluster level at 0.7322/8. In case of another rise, upside of recovery should be limited well below 0.7896 resistance to bring fall resumption.
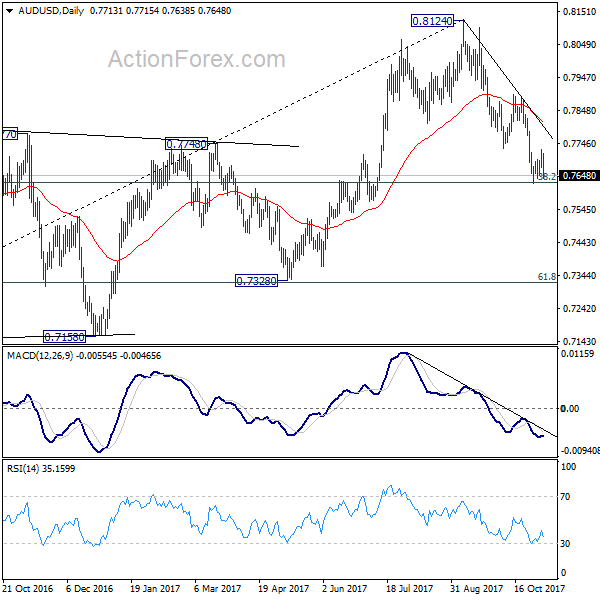
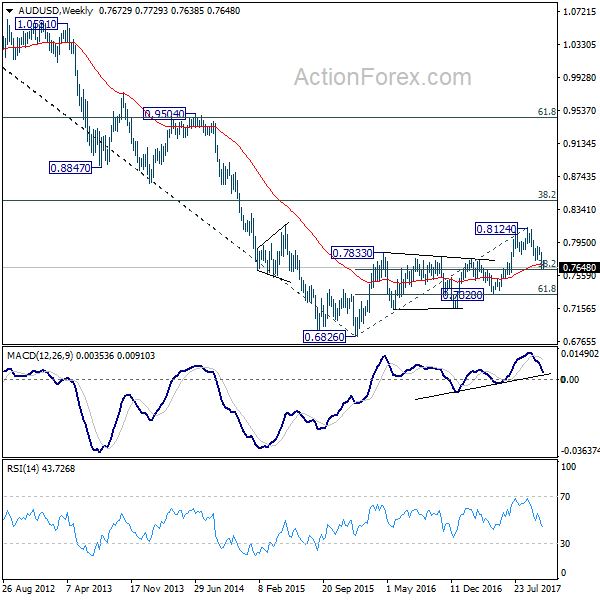
In the bigger picture, corrective rise from 0.6826 medium term bottom is likely completed at 0.8124, after hitting 55 month EMA (now at 0.8067). Decisive break of 0.7328 key cluster support (61.8% retracement 0.6826 to 0.8124 at 0.7322) will confirm. And in that case, long term down trend from 1.1079 (2011 high) will likely be resuming. Break of 0.6826 will target 61.8% projection of 1.1079 to 0.6826 from 0.8124 at 0.5496. This will now be the favored case as long as 0.7896 near term resistance holds.
In the longer term picture, 0.6826 is seen as a long term bottom. Rise from there could either reverse the down trend from 1.1079, or just develop into a corrective pattern. At this point, we're favoring the latter. And, as long as 38.2% retracement of 1.1079 to 0.6826 at 0.8451 holds, we'd anticipate another decline through 0.6826 at a later stage. But strong support should be seen between 0.4773 (2001 low) and 0.6008 (2008 low).
USD/CAD Weekly Outlook
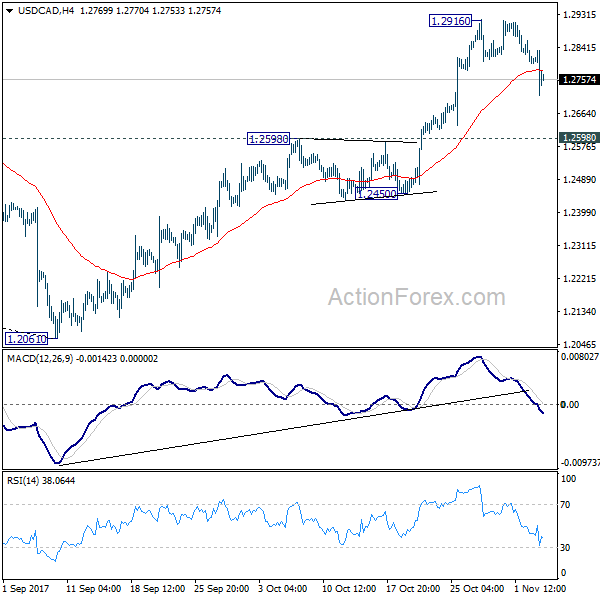
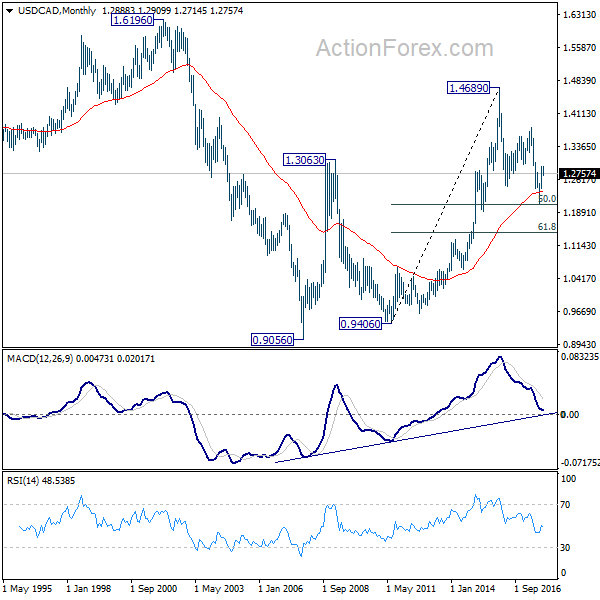
USD/CAD's correction from 1.2916 continued last week and dipped lower. But still, with 1.2598 resistance turned support intact, near term outlook remains bullish. Initial bias stays neutral this week first. Break of 1.2916 will extend the rise from 1.2061 to 38.2% retracement of 1.4689 to 1.2061 at 1.3065. However, sustained break of 1.2598 will argue that rebound from 1.2061 has completed after hitting 55 week EMA (now at 1.2916). Near term outlook will be turned bearish in this case.
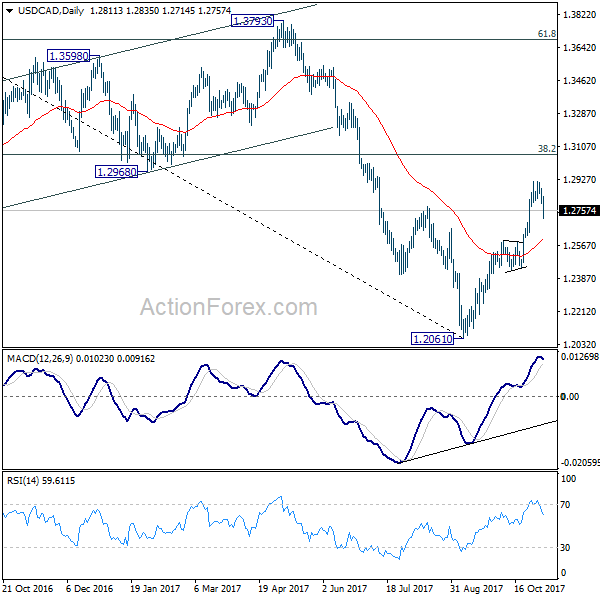
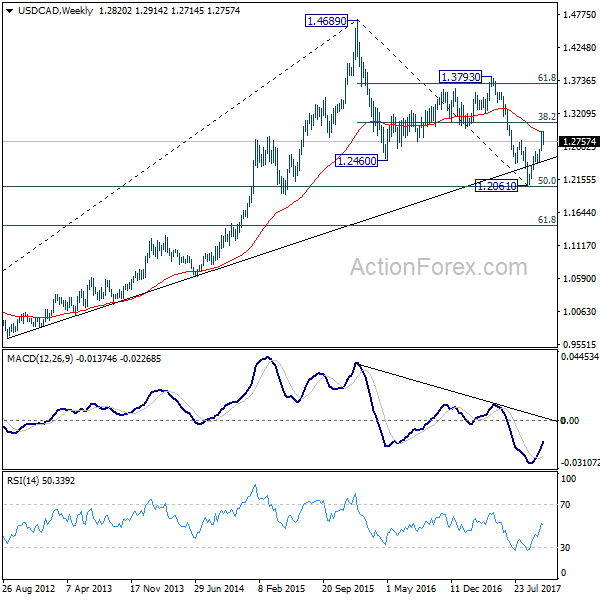
In the bigger picture, USD/CAD should have defended 50% retracement of 0.9406 (2011 low) to 1.4689 (2016 high) at 1.2048. And with 1.2048 intact, we'd favor the case that fall from 1.4689 is a correction. Rise from 1.2061 medium term bottom should now target 38.2% retracement of 1.4689 to 1.2061 at 1.3065. Firm break there will target 1.3793 key resistance next (61.8% retracement at 1.3685). We'll now hold on to this bullish view as long as 1.2450 support holds.
In the longer term picture, current development argues that correction from 1.4689 has completed with three waves down to 1.2061 already. And larger up trend from 0.9056 (2007 low) is still in progress. Firm break of 1.3794 resistance should now indicate up trend resumption through 1.4689 high.
GBP/JPY Weekly Outlook
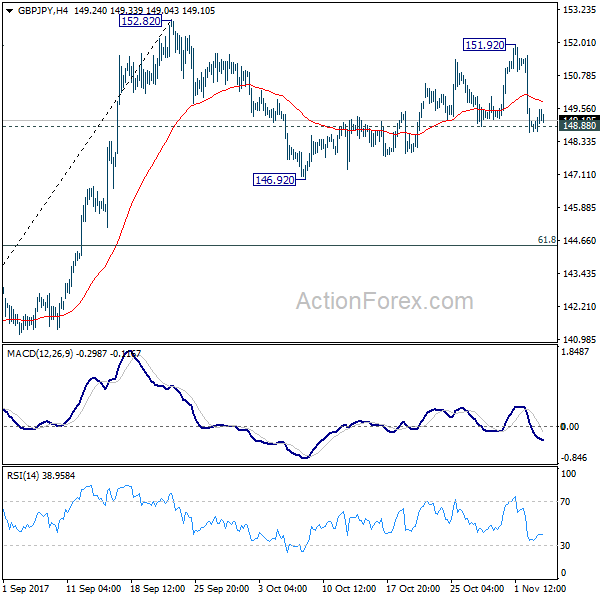
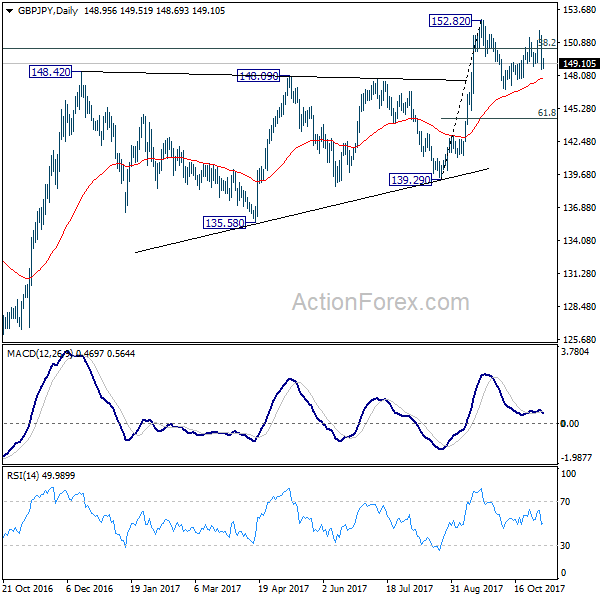
GBP/JPY edged higher to 151.92 initially last week. But subsequent fall and breach of 148.88 minor support argues that recovery from 146.92 is completed. Initial bias is mildly on the downside this week for 146.92 first. Break will resume the decline from 152.82. At this point, we'd expect strong support from 61.8% retracement of 139.29 to 152.82 at 144.45 to contain downside and bring rebound. On the upside, above 151.92 will retest 152.82 high instead.
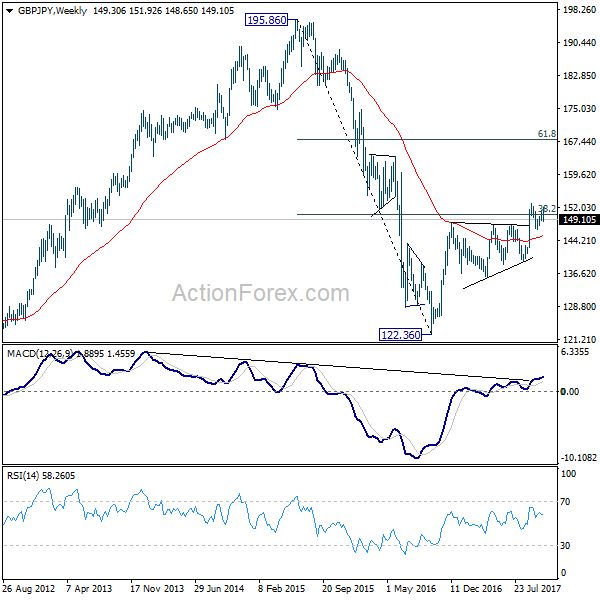
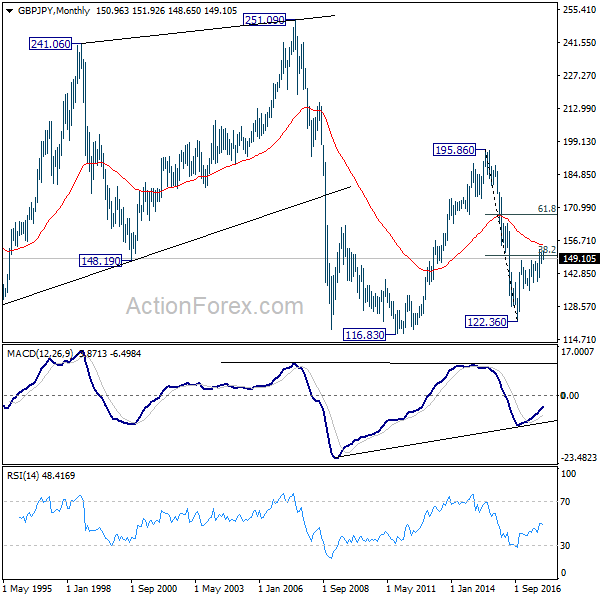
In the bigger picture, medium term rebound from 122.36 is still expected to resume after corrective pull back from 152.82 completes. Firm break of 38.2% retracement of 196.85 to 122.36 at 150.43 will carry long term bullish implications. In that case, GBP/JPY could target 61.8% retracement at 167.78. However, break of 139.29 will indicate rejection from 150.43 key fibonacci level. And the three wave corrective structure of rebound from 122.36 will argue that larger down trend is resuming for a new low below 122.26.
In the longer term picture, current rebound argues that the down trend from 195.86 (2015 high) has already completed at 122.36. Focus is now on 55 month EMA (now at 154.78). Firm break there will suggest that rise form 122.36 is developing into a long term move that target 195.86 again. And, price actions from 116.83 (2011 low) is indeed a sideway pattern that could last more than a decade. However, firm break of 139.29 will suggests that the long term down trend is still in progress and could break 116.83 low ahead.
EUR/JPY Weekly Outlook
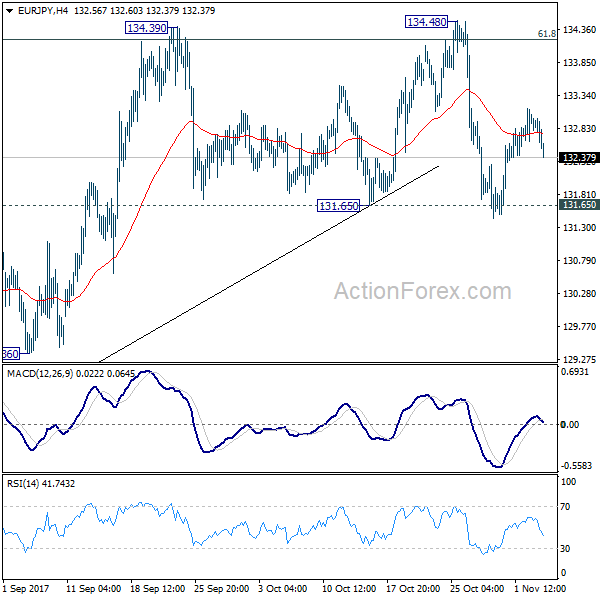
EUR/JPY breached 131.65 key support last week but quickly recovered. Initial bias remains neutral this week first. After all, decisive break of 134.39/48 resistance zone is needed to confirm up trend resumption. Otherwise, even in case of rebound, near term outlook is neutral at best. On the downside, decisive break of 131.65 will confirm rejection from 134.20 fibonacci level and confirm near term reversal. And, in such case, intraday bias will be turned to the downside for 127.55 key support level.
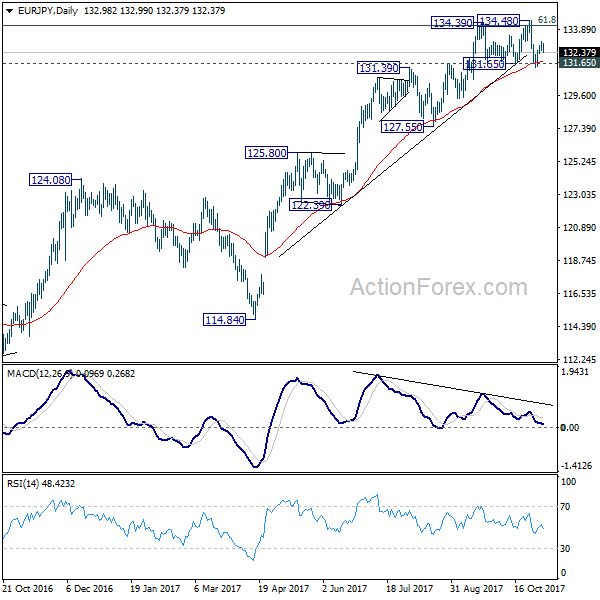
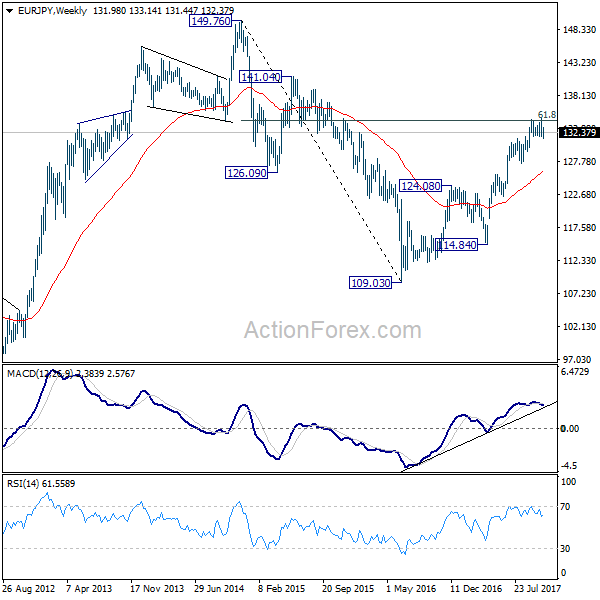
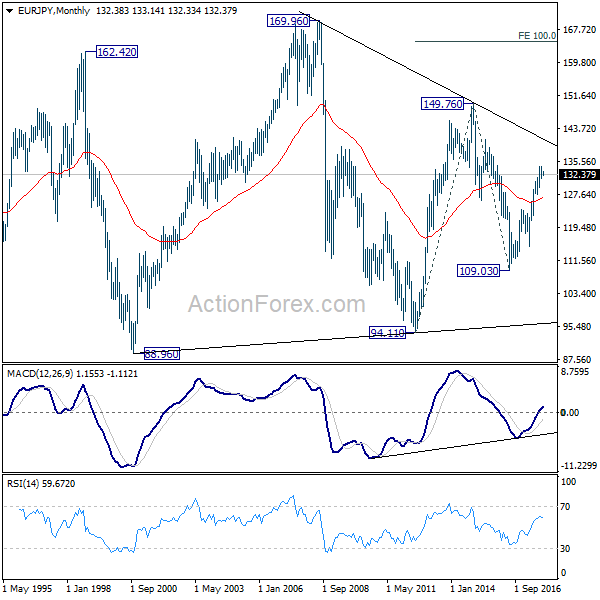
In the bigger picture, medium term rise from 109.03 (2016 low) is seen as at the same degree as the down trend from 149.76 (2014 high) to 109.03 (2016 low). 61.8% retracement of 149.76 to 109.03 at 134.20 is already met. Sustained break there will pave the way to key long term resistance zone at 141.04/149.76. However, break of 127.55 support will argue that the medium term trend has reversed and will turn outlook bearish for deeper fall back to 114.84/124.08 support zone at least.
In the long term picture, at this point, there is no clear indication that rise from 109.03 is resuming that from 94.11. Hence, we'd be cautious on topping below 149.76 to extend range trading. Nonetheless, firm break of 149.76 will indicates strong underlying buying. In such case, EUR/JPY will target 100% projection of 94.11 to 149.76 from 109.03 at 164.68.
EUR/GBP Weekly Outlook
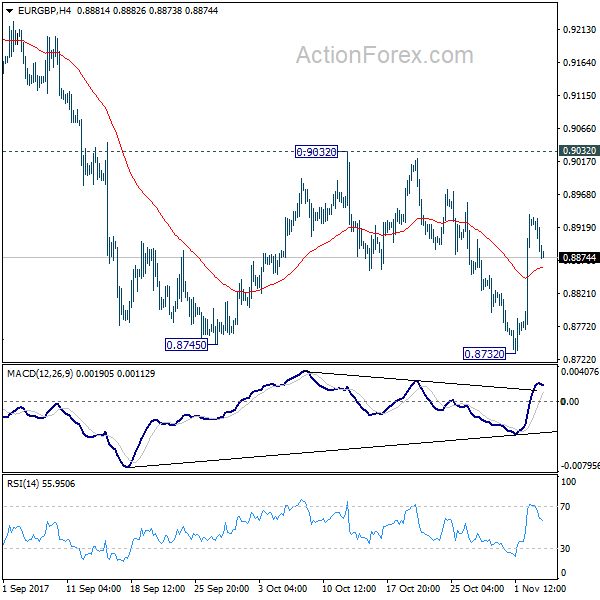
EUR/GBP edged lower to 0.8732 last week but rebounded strongly since then. Nonetheless, upside is limited below 0.9032 near term resistance so far. Initial bias stays neutral this week first. On the upside, decisive break of 0.9032 will confirm completion of the decline from 0.9305. In such case, intraday bias will be turned back to the upside for retesting 0.9305 key resistance. On the on the downside, break of 0.8732 will resume the fall and target 0.8303 key support level instead.
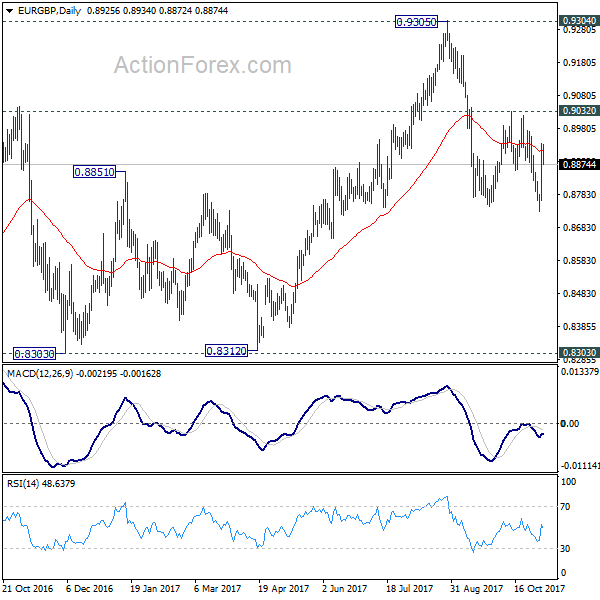
In the bigger picture, there are various ways to interpret price actions from 0.9304 high. But after all, firm break of 0.9304/5 is needed to confirm up trend resumption. Otherwise, range trading will continue with risk of deeper fall. And in that case, EUR/GBP could have a retest on 0.8303. But we'd expect strong support from 0.8116 cluster support (50% retracement of 0.6935 to 0.9304 at 0.8120) to contain downside.
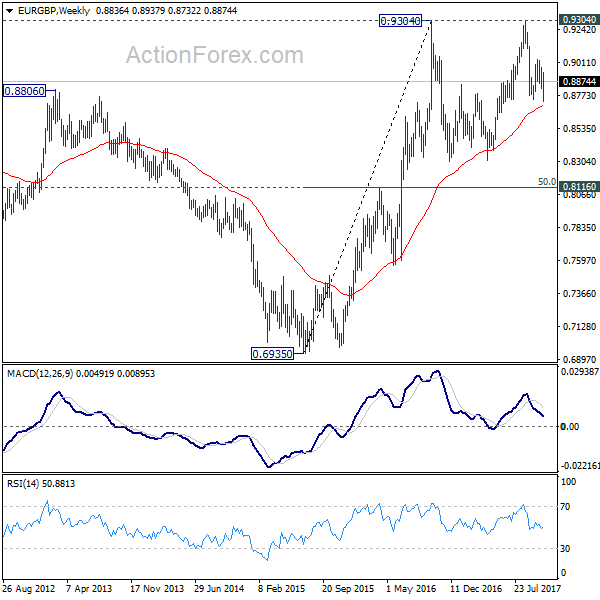
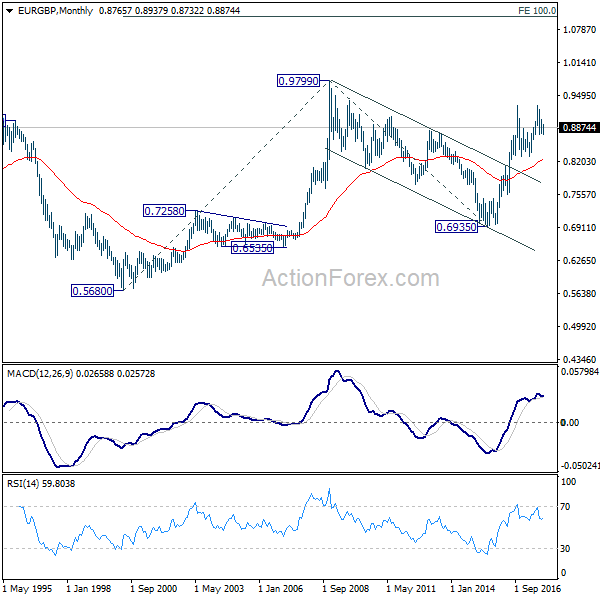
In the long term picture, firstly, price action from 0.9799 (2008 high) is seen as a long term corrective pattern and should have completed at 0.6935 (2015 low). Secondly, rise from 0.6935 is likely resuming up trend from 0.5680 (2000 low). Thirdly, this is supported by the impulsive structure of the rise from 0.6935 to 0.9304. Hence, after the correction from 0.9304 completes, we'd expect another medium term up trend through 0.9799 to 100% projection of 0.5680 to 0.9799 from 0.6935 at 1.1054.