Sample Category Title
The Weekly Bottom Line: Investors React to GOP Tax Reform Plan
U.S. Highlights
- Investors this week were kept busy with the release of the GOP tax reform plan, which sent small cap stocks higher and the S&P 500 lower immediately after its announcement. President Trump nominated current Federal Reserve Board Governor Jerome Powell to succeed Janet Yellen as Chair of the Fed in February 2018.
- Volatility as a result of Hurricanes Harvey and Irma skewed data released this week, but the outlook for the fourth quarter remains positive, with hiring in October recovering from hurricane setbacks. Inflation continues to disappoint, with core PCE holding steady in September at 1.3% y/y, and wage growth disappointing in October, rising only 2.4% y/y.
- We expect inflation to reach its 2.0% target late in 2018, with robust economic activity in the meantime giving the Fed enough ammunition to proceed with a rate hike this December.
Canadian Highlights
- The Canadian economy continues to generate jobs at a robust clip, adding 35.3k jobs in October, marking the 11th straight month of positive job growth. Gains were entirely within full time work, helping to push overall hours worked up 2.7% year-on-year.
- In other data, monthly GDP by industry showed a 0.1% pullback in Canadian economic activity in August and international trade showed a decline in both export and import volumes in September. All told, the data suggest a slowdown in real GDP growth in the third quarter to sub-2%, roughly in line with the Bank of Canada's recent forecast.
U.S. - Investors React to GOP Tax Reform Plan
Thursday's release of the Republican tax overhaul plan finally gave investors more detail to chew on in determining the winners and losers of the most significant reworking of the tax code in over three decades. The plan slashes the top corporate tax rate from 35 to 20%, and the announcement boosted small cap stocks on account of their higher effective corporate tax rate, while the S&P 500 stumbled in the aftermath of the announcement. The proposal to cut the mortgage interest deductibility in half to $500,000 drove a sell-off in homebuilding stocks. This effective tax increase could dent housing demand particularly in high-priced markets, such as Washington, D.C. and Boston where the median home price already exceeds $500,000. Next, the bill will head to the House Ways and Means Committee before going to the House and Senate for approval. Should the plan progress smoothly, investors should look for small caps to appreciate further while large cap stocks will likely struggle as a result of the scaling back of interest payment deductibles. The USD depreciated as investors weighed the tax plan, but recovered by Friday, while bond yields fell.
Other events on Capitol Hill this week included President Trump's nomination of current Federal Reserve Governor Jerome Powell to succeed Janet Yellen as Chair of the Federal Reserve on February 3rd, 2018. Given Powell's views that align with the FOMC consensus, markets remained calm following the announcement. Moreover, in addition to tax reform prospects, investor sentiment was supported by indications that economic growth is likely to remain strong this quarter.
Volatility as a result of Hurricanes Harvey and Irma skewed data released this week, but the outlook for the fourth quarter remains positive and is helped by a solid finish to the third quarter. Strength in consumer spending in September, notably on durable goods, sets the stage for another strong showing from households in the fourth quarter. This was echoed in October's vehicle sales which remained elevated as consumers replaced flooded cars, something that is expected to gradually fade in the months ahead. A tighter labor market should act to support household spending further. Indeed, this morning's October payrolls report showed that hiring bounced back from the previous month's hurricane-related disruptions (Chart 1). Additionally, the ISM manufacturing index components including new orders, production, and employment have held near cycle highs since mid-year and indicate that the sector is on solid footing, supported by strong domestic and foreign demand.
While real activity remains rosy, inflation continues to disappoint. Core PCE held steady in September at 1.3% y/y (Chart 2), while wage growth disappointed in October, rising only 2.4% y/y. Weak inflation continues to confound the FOMC, leading the committee to leave its policy rate unchanged this week. However, as the unemployment rate continues to push further below its natural rate, inflation is likely to gain traction in the year ahead and is expected to reach its 2.0% target late in 2018. We expect that these pressures should give the Fed enough ammunition to proceed with a rate hike this December.
Canada - Steady Progress Toward Full Employment
One of the most important factors to the outlook for monetary policy is the central bank's assessment of how close the economy is to its potential. For the Bank of Canada this is typically done with a focus on real GDP, taking into account the utilization of both labour and capital. However, in the most recent October MPR, the central bank made a point of noting that even as the overall economy appeared to close to capacity, the labour market still appeared to have some slack remaining. This is in spite of the fact that the unemployment rate (which edged up to 6.3% in October) appeared close to levels associated with full employment.
The evidence of shadow labour market slack that the Bank of Canada pointed to in the MPR was threefold: elevated long-term unemployment, low average hours worked, and modest wage growth. Given the Bank's data-dependent focus and its specific mention of these metrics, it is worth unpacking their evolution. With the release of the October Labour Force Survey, we have one additional data point to add to the analysis.
For the most part, the data show a steady reduction in slack over the last year, consistent with above-trend economic growth. In terms of long-term unemployment, Statistics Canada's supplementary data show a rate of 2.2% for people unemployed for more than three months. This is the lowest level since prior to the recession. In fact, it is right in line with the average from the early 2000s. While the rate was lower in the period from 2006 to 2008, according to the Bank of Canada's output gap measure, the Canadian economy was operating above potential at this time.
Average hours worked has also shown meaningful improvement in recent months. On a year-over-year basis, average hours worked were up 1% in October. Even more impressive, average hours are up 1.8% relative to the trough in January of this year. To put these gains in broader context, there is a clear downward trend to the series (Chart 1). Major steps down appear to occur around recessions, and then remain relatively steady. This suggests that even as average hours continue to move higher, they may not go back to previously-observed levels.
Finally, in terms of wage growth, the trend on a year-on-year basis has reversed swiftly over the past several months. From a trough of just 0.5%, year-on-year wage growth accelerated to 2.4% in October. This is just 0.2 percentage points below its average since the early 2000s (Chart 2). Incidentally, wage growth has been the fastest in periods of relative economic weakness. It peaked at close to 5% during the 2008 recession, and was running above 3% during the most recent period of commodity-related weakness in 2014/2015. If anything, the indicator appears to be a lagging one. Its recent acceleration is confirmation of strong economic growth and a good sign that inflation is likely to turn higher in the months ahead.
All of this suggests that as with the overall output gap, the labor market is increasingly giving an all clear ahead signal to the Bank of Canada to continue tightening monetary policy.
Canada: Upcoming Key Economic Releases
Canadian Housing Starts – October
Release Date: November 8, 2017
Previous Result: 217.3k
TD Forecast: 215k
Consensus: N/A
Housing starts are forecast to post a modest decline in October to an annualized 215k from 217k the prior month. Both single and multi-unit starts are running above their six-month trend and residential construction still has not reacted to the slowdown in the broader resale market, though we have seen signs of stabilization in the last couple months. Furthermore, warm weather in September has given way to more seasonal temperatures, which will act as a headwind to construction at the margin.
The USD Dollar Comes Back from the NFP Wobble
Post NFP
While the NFP came below the market towering expectations, but with a +90k revision to Aug-Sept jobs, the data implies the hurricane influence was bad, but not as had been reported, so this months print was less influential
However, wage growth came in dismally low, but with the hurricane's distorting effects thought to be skewing the data, there should be no muss or any fuss from the Fed. And while the" inflationista's" on the FOMC will fret but given the booming US economy, the Fed is pushing forward with December rate hike despite the skinny paychecks expecting an eventual bounce on wages due to the strength in the other payroll headlines.
After the USD knee-jerk, astute traders bought dollar on the dip, and ISM non-manufacturing confirmed that fading the primary post-NFP USD weakness was the correct call. The index has come in at 60.1 for October vs 58.5 expected and all but greenlighted a wave USD buying into the weekend.
Jay Powell
Munchin got his man convincing Trump that continuity and stability at the Fed helm were essential and Jay Powell appointment suggests just that. The presumption is he will not deviate too far from current Fed policy trajectory while supporting Trump's self-proclaimed stance of being a " low-interest rate person."
Tax Reform -Trump - Asia
While a relatively light US economic diary next week, there will be no lack of political bluster as the tax reform debate rages on while Trump will be dealing with North Korea nuclear ambitions and regional trade wars during his Asia tour. In a show of US military might, an entourage of F-35's will accompany Trump( actually deployed to Okinawa), and the mainstay of the US Navy's power projection, two more Aircraft Carriers will be positioned in the Western Pacific bringing the unprecedented regional total to three.
Danger Downunder
Next week both the RBA and RBNZ policy meeting take centre stage
The Aud remains vulnerable to RBA dovish guidance even more so post a dismal nationwide plummet in retails sales. The market should continue sour on Aussie trade.
The NZD is a bit more complicated given extended short positions established on local political noise suggesting these trades are incredibly vulnerable to a more hawkish RBNZ bias than the market is forecasting.
The market has been selling Kiwi the better part of two weeks and my start to unwind shorts ahead of the RBNZ
Australia & New Zealand Weekly: RBA on Hold; Prospects for Property Investors are Not Encouraging
Week beginning 6 November 2017
- RBA on hold; prospects for property investors are not encouraging.
- Australia: RBA policy decision, ABS CPI re-weighting, housing finance.
- NZ: RBNZ policy decision, inflation expectations survey, retail card spending.
- China: CPI, PPI, new loans.
- Euro Area: Sentix investor confidence.
- US: Uni. of Michigan consumer sentiment.
- Central banks: BNM and BSP policy decisions.
- Key economic & financial forecasts.
Information contained in this report was current as at 3 November 2017.
RBA on Hold; Prospects for Property Investors are Not Encouraging
The Reserve Bank Board meets next week on November 7. The Board is certain to keep rates on hold.
In previous years November has been a very popular month for changing rates but not this year.
Rates have not been adjusted in November since 2011. However in the six years from 2006 to 2011 there was a rate move at every November Board meeting.
In recent times, November has also been a popular "target" for market expectations of rate moves. Following the rate cut in August last year, markets were confident that there would be a follow up cut in November - Westpac was not convinced with that view and the November meeting passed with no change.
Some months ago, offshore investors assured me that the Board would adopt a tightening bias at the November meeting. That prospect has since dissipated.
On Monday, the Australian Bureau of Statistics will release the revised weights for the Consumer Price Index. This is a five year event (now to be revisited every year) and, in the past, has seen the revised weights lead to a reduction in the CPI of around 0.2 percentage points over the year. Another downward effect is almost certain as spending patterns evolve towards those components that have fallen in terms of relative prices. Westpac expects the revised weights to reduce the outlook for inflation over 2018 by 0.4 percentage points for headline inflation and 0.3 percentage points for underlying inflation. Note that historical inflation estimates will not be affected.
The Board will have the opportunity to review the Bank's own assessment of the revised weights on the inflation outlook at the meeting on Tuesday.
It is also likely to take a closer look at developments in residential property markets - particularly Sydney.
Note that the Governor's Statement following the October Board meeting included, "In Sydney, where prices have increased significantly, there have been further signs that conditions are easing".
Recent data shows that six month annualised inflation in the Sydney market has fallen from 22% at January this year to -0.7% in October. Of particular interest for the Sydney market is going to be the behaviour of investors going forward.
Conditions for investors appear to be deteriorating.
For a start, banks have raised interest rates for investors through 2017. Headline rates for interest only investor loans have been increased by around 75 basis points; while headline rates for principal and interest investor loans have been increased by around 30 basis points. These increases follow the moves in 2015 of 45 and 38 basis points respectively. Lending guidelines have also been tightened with expenses being more closely scrutinised and nonwage incomes more heavily discounted.
The most recent changes have been in response to APRA's direction to the banks to slow the growth in interest only loans to 30% of flows.
Land taxes and municipal rates are also challenging investors as these imposts increase in response to the recent boom in land values in Sydney. Some investors report that land taxes, in an environment of low rental growth (the rent component of the Consumer Price Index rose by less than 1% over the last year) are claiming up to 40% of rental income. Average gross rental yields in Sydney are around 3.5%.
State government stamp duties for foreign investors have been boosted by around 7-8% (although other countries have been more aggressive - Toronto; Vancouver; Hong Kong and Singapore have established "aspirational" levels of 15%).
Some investors may also be unnerved by other aspects of government policy.
The 2017 Commonwealth Budget excluded depreciation allowances on used apartments while "inspection travel" deductions were banned.
Investors are also concerned the NSW state government might aim to strengthen the rights of tenants with limits on rent increases; making evictions more difficult; and imposing longer rental periods. Superimposed on all these concerns are the stated policies of the Federal Opposition.
In the July 2016 election the ALP indicated that, if elected, from July 1 2017 negative gearing would only be available for new investments. The capital gains tax discount of 50% would be reduced to 25% from July 1 2017.
Neither change was ear marked to be retrospective and would therefore only have applied to investments made after July 1 2017. With another Federal election due in 2019 and the ALP holding a sustained and commanding lead in the opinion polls, investors will be making decisions on the basis of this potential change in tax policy.
We cannot discount the possibility of investment activity being brought forward to take advantage of the "grand fathering" of the ALP's policies, although the other headwinds which have been discussed above are likely to contain any "bring forward" effect.
Dominating the investors' decisions' will be prospects for capital gains. With price momentum easing, those prospects will be decidedly unattractive to investors.
It appears that the prominent role of investors in the Sydney market is already dissipating and that is likely to continue. That process can only continue to ease pressure in the Sydney market, with the most likely outcome being a long period of flat prices.
What does this mean for interest rates?
The Reserve Bank has indicated that interest rates will be targeted at inflation and growth while macro prudential policy will address financial stability.
Current trends indicate that financial stability concerns will be easing for the Bank.
That suggests that a further "round" of macro prudential policies will not be necessary.
Interest rate increases that might accelerate weakness in real estate markets which might have a spill over impact on confidence and spending will also be unattractive.
However, interest rate cuts to head off a more severe adjustment in housing markets still seem quite remote.
The Week that Was
This week in Australia, the focus shifted to housing and the consumer. Meanwhile offshore, the US' FOMC and UK's Bank of England met; President Trump provided more detail on planned tax reform; and we also received an update on PMIs across Asia.
Starting with the Australian housing market, the release of the October CoreLogic home value index received considerable attention, with the significance of the macroprudential reforms introduced in March clearly on display. The key points include: that Sydney prices have fallen about 0.6% over the past three months, resulting in the annual pace of growth halving from 15.4% in July to 7.7%yr in October; meanwhile, Melbourne prices have held up, annual growth having only slowed from 13.1%yr at July to 11.0%yr in October. Of the remaining states, Perth continues to see price declines (-2.5%yr) while prices rose 4.6%yr in Adelaide and 2.7%yr in Brisbane. We expect the slowdown to carry on to year end as March's regulatory change has an enduring effect.
On housing construction, dwelling approvals surprised to the upside in September, gaining 1.5% against an expectation for a 1.0% fall. In September, NSW was the best performer (10.7%; 3.7%yr) as high-rise approvals surged; but this follows six months where NSW experienced the most abrupt downturn, due to weakness in the high-rise component. Vic and Qld in contrast reported monthly declines, respectively -2% (3.2%yr) and -17% (-14.9%yr). Monthly volatility aside, we anticipate approvals in all of the eastern states will continue to trend down. Residential investment will therefore subtract from growth through 2018 as projects are completed and the pipeline is not replenished.
On to household consumption, both the value and volume of retail sales in the September quarter was a material disappointment. See chart of the week for further detail.
Also released this week for Australia, the trade balance for the month of September surprised to the upside as export growth jumped 2.9%. An 8% gain for metal ores, the result of stronger volumes, and a rebound in gold were key positives as were further gains for services, now up 12.4%yr. Importantly, this outcome means that net exports will add to growth in the September quarter, likely circa the 0.3ppts we had anticipated.
Turning to the global economy, October PMI data was released for China and the rest of Asia. While China's official NBS PMI's came in below market expectations, they still suggest momentum in the manufacturing and services sectors remained robust. This is despite more stringent environmental controls being introduced by authorities. Activity was constructive; however, employment remains a downside risk for the outlook, being subpar relative to its history. We continue to anticipate that growth will slow materially in 2018, from 6.8% to 6.2%. Public and private investment continues to slow, and softer employment growth is likely to restrict consumer-led growth. Thinking further forward, following last week's 19th National Peoples' Congress, it is clear that significant changes are underway in China, both with respect to how its economy operates, and how it engages with the world.
For the rest of Asia, the PMIs were mixed in October. Japan maintained an above-average pace, as India and Indonesia retraced back to near the 50 expansion/contraction level. Broadly, external demand remains supportive for the region. While many nations face challenges on the domestic front, their ongoing economic development holds great promise.
In the US, the FOMC has been front and centre. The November FOMC meeting met expectations with a December hike already priced in by the market. Since September, the Committee's confidence in the growth outlook has received additional support from the above-expectations GDP print for Q3 as well as the continuing nascent uptrend in wages growth. Still, the FOMC remain concerned over the inflation outlook. The slack underlying the soft inflation trend will likely limit rate hikes to a further two in 2018 following December's anticipated 25bp hike. Powell's rise to Chair of the FOMC is unlikely to materially change the outlook for rates; still, it will be important to assess his and the Committee's views on the risks to the outlook in coming months.
Just to hand, further detail on proposed tax reform was offered by President Trump and the House Republicans. Broadly, the House tax plan accords to the initial guidance offered by the Trump administration. However, a number of revenue raising initiatives have had to be added to bring the cost of the package over the coming decade down to the $1.5trn that the Senate is willing to agree to. We will parse the detail of the proposal in coming days and provide further guidance on the path ahead.
Finally in the UK, they may face a very different situation to the US, but the Bank of England has been as resolute in the need to raise rates. Above-target inflation and unemployment at four decade lows were used to justify a 25bp hike despite sluggish activity and formidable uncertainty over the outlook. However, as we expected, this was a dovish hike, with the Bank's forecasts indicating they only expect two hikes by end 2020. Given the risks, this is likely to be an upper limit for rate actions.
Chart of the Week: Q3 real retail trade
Real retail sales, i.e. volumes, were estimated to have risen slightly by 0.1%qtr, slightly better than the market expectation of flat. This compares to nominal sales down 0.3%qtr for Q3 as a whole, the weakest result since 2010.
Solid volume gains for food (+0.9%qtr) and clothing (+0.7%qtr) were offset by sizeable falls for household goods (-1.7%qtr) and department stores (-1.4%).
Stepping back, the picture from the report is an unambiguously bad one for retailers - who are cutting prices but finding no traction with volumes.
The picture is not quite as bad for consumers who get some advantage from lower prices and do not look to be cutting back on consumption quite as sharply as feared.
The wash-up still points to marginal downside risks to the wider consumption estimates in the Q3 national accounts.
New Zealand: Week Ahead & Data Wrap
This week's September labour market report painted a slightly stronger picture than expected. Employment jumped by 2.2%, although we recommend treating that number with caution. It followed a 0.1% fall in the June quarter, which didn't jibe with other labour market indicators at the time. And the labour force participation rate followed a similar pattern, falling to 70.1% in the June quarter before rebounding to an all-time high of 71.1% in September. We suspect that changes to the Household Labour Force Survey in June 2016 may have disrupted the seasonal pattern of the employment and participation series.
The unemployment rate is probably a more reliable measure of how the jobs market is performing, and it too surprised on the positive side, though only slightly - unemployment fell from 4.8% to 4.6%, beating market forecasts of a fall to 4.7%. This is the lowest rate since December 2008, when the Global Financial Crisis was reaching full force.
Despite the improving trend in unemployment, wage growth remains subdued. The Labour Cost Index (LCI) rose by 1.9% in the year to September. However, about 0.3% of that increase was due to the pay equity settlement for aged and disability care workers. Excluding that impact, annual labour cost inflation actually slowed a little, from 1.7% in the June quarter to 1.6% today.
That leads us to a crucial question: how tight is the labour market? That is, how close is the economy to 'full' employment, which is generally taken to mean the lowest rate that can be sustained over the long term (and might soon be a target of the Reserve Bank's).
The unemployment rate has improved substantially over the last couple of years, but history suggests that it can go further. Unemployment was below 5% for much of the 2000s, and even below 4% for a stretch. Wage growth picked up in that time, but it didn't really take off until unemployment was below 4%.
Ultimately, the test of whether the labour market is 'tight' is whether (real) wage growth is accelerating. Real wage growth has actually been reasonably strong compared to last decade, largely because inflation has been persistently and surprisingly low (in contrast, inflation was persistently and surprisingly high for much of the 2000s). But now that inflation is picking up from its lows, we have yet to see a matching lift in wage growth. And that provides at least circumstantial evidence that the labour market still has some slack left in it.
The other key development of the past week was the ANZ Business Outlook survey. Confidence in the economy fell into negative territory (-10.1) in October, while firms' confidence in their own activity eased to the lowest level since the 2015 "dairy downturn". While confidence may have been dampened by lingering uncertainty around the election, this fall was not a response to the change in Government - the survey was conducted after the election but before coalition negotiations were complete. Instead, firms appear to be registering the same general slowdown in the economy that we have been observing in recent months.
Next week the Reserve Bank will release its first Monetary Policy Statement under Acting Governor Grant Spencer. We expect no change to the OCR forecast, which in August was for the OCR to remain unchanged until 2019 and to rise very gradually thereafter. We also expect the RBNZ to retain exactly the same policy guidance paragraph that it has used more-or-less unchanged since February this year:
"Monetary policy will remain accommodative for a considerable period. Numerous uncertainties remain and policy may need to adjust accordingly."
To be sure, the details of the MPS will be different to past missives. The RBNZ needs to downgrade its GDP and house price forecasts to reflect the reality of recent data. The construction sector seemed to stall for much of this year; GDP growth has been below expectations; businesses' confidence in their trading outlook has fallen; the house price boom came to a halt; and consumer spending has flat lined since April.
At the time of the September OCR Review we argued that the run of weak data recently could prompt the Reserve Bank to issue a more dovish statement in November. However, there was always an important caveat to that - we said "The remaining determinant of the overall tone in November will be the exchange rate. If it falls by enough to provide some prospective stimulus to inflation, the RBNZ would be able to leave its OCR guidance unchanged."
That is exactly what has happened. The exchange rate has fallen sharply and unexpectedly in recent weeks, mainly due to the election outcome. The Trade Weighted Index is now 6% lower than the RBNZ forecast in the August MPS. This will provide some much-needed stimulus to the RBNZ's inflation forecast, and will allow the RBNZ to run with the same OCR forecast as previously.
The other reason to expect a "straight bat" from the RBNZ at next week's Monetary Policy Statement is that the election result has made the economic outlook so much more uncertain. The new Government's housing policies will have a difficult-to-determine negative impact on house prices over 2018. The Government also plans to cancel next year's tax cuts, but to spend more over time. It won't be easy to anticipate the net impact on inflation until the exact policies are published. At this stage, the Reserve Bank is better off waiting and seeing what happens with Government policy, rather than reacting prematurely to policy changes that may or may not eventuate.
Data Previews
RBA November policy meeting
Nov 7, cash rate, last 1.50%, WBC 1.50%
- The RBA is set to meet on 7 November ahead of the Melbourne Cup.
- Since the last meeting in October, momentum in the labour market has remained strong, but household consumption has disappointed materially. This is despite an improvement in consumers' expectations of the economic outlook. Instead, persistent concerns over family finances are limiting discretionary spending.
- On the housing market, there has been a clear deceleration in Sydney, but Melbourne has held up. Arguably it is still too early to assess the full effect of March's regulatory reforms.
- Poignant in the October minutes was the clear message that the RBA is not beholden to policy developments (rate hikes) abroad. To our mind, below trend GDP growth and benign inflation will keep them on hold in 2018 and 2019.
Aus Sep housing finance (no.)
Nov 9, Last: 1.0%, WBC f/c: 3.0%
Mkt f/c: 2.0%, Range: 0.0% to 4.5%
- The number of owner occupier loans rose 1% in Aug, holding flat ex refinance. The value of approvals to investors posted a surprisingly strong 4.3% gain although that is likely being bolstered by investor refinancing activity following macro prudential tightening in late March and associated increases in rates for 'interest only' loans (the ABS does not split out 'refi' for investor loans).
- Industry data suggests owner occupier loans posted a solid 3% rise in Sep, again suggesting the wider market slowdown evident in other measures is primarily due to a pull back in investor segments. Within the owneroccupier group, first home buyers have also been a notably strong driver in recent months, responding to increased state government assistance.
NZ Q4 survey of inflation expectations
Nov 6, Two years ahead, last: 2.09%, Westpac f/c: 2.1%
- The importance of the Reserve Bank's survey of inflation expectations has dimmed in recent times, with the RBNZ suggesting that price-setting behaviour has become more backward-looking.
- That said, the survey itself has probably become more backward-looking as well. A change in the schedule means that the survey is now held immediately after the CPI release. CPI inflation rose from 1.7% to 1.9% in the September quarter, a little above market expectations. Consequently, we would expect a small uptick in the survey result, but with the 2% midpoint of the inflation target still providing an effective anchor.
RBNZ Monetary Policy Statement
Nov 9, Last: 1.75%, Market: 1.75% , Westpac: 1.75%
- We expect the RBNZ to keep the OCR on hold and give the same neutral policy guidance that it has given all year. We also expect the OCR forecast to be the same as the August MPS - flat until late 2019 and slowly rising beyond that.
- The economic outlook has deteriorated, and the housing market is weaker than the RBNZ anticipated. But the exchange rate has fallen sharply, meaning the overall outlook for medium term inflation is broadly unchanged. Furthermore, the change of Government makes the economic outlook more uncertain. The RBNZ is better off waiting and seeing how Government policy evolves, rather than making bold changes at this point.
- There would be very little financial market reaction to a neutral MPS along these lines.
NZ Oct retail card spending
Nov 10, Last: +0.1%, WBC f/c: 0.6%
- Retail spending rose just 0.1% in September. While some of this was due to lower than expected spending on fuel, spending on durable goods, clothing and hospitality was down.
- Spending levels have been broadly flat for several months now. In part, this is because of the softness in prices, particularly for imported consumer goods. However, it's likely that the softening in the housing market is also dampening household spending, particularly for items such as household furnishings. We expect that these same factors will again result in only moderate spending growth of 0.6% in September.

Week Ahead – RBA and RBNZ Meetings to Headline Quiet Week
The central bank theme will continue for a third week following the past fortnight's policy meetings by the ECB, Bank of Japan, Fed and the Bank of England. This time, it will be the turn of the Reserve Bank of Australia and the Reserve Bank of New Zealand. Data-wise, the main focus will be on trade and industrial output figures from China, France, Germany, and the United Kingdom, as well as Chinese inflation numbers.
Industrial output and trade data to dominate European calendar
As a stronger euro starts to worry some ECB policymakers, there is little evidence so far that the appreciation in the exchange rate is hurting Eurozone exporters. Industrial production and trade figures due next week should show how German and French manufacturers fared during September when the euro surged above $1.20. Other notable data from the region next week will include Eurozone producer prices, retail sales and the sentix index.
The UK will also see the release of industrial output and trade numbers in the coming week. The manufacturing sector was one of the better performing components of UK GDP in the third quarter, helping the British economy grow a little faster than expected during the period. UK exporters will likely be relieved that this week's quarter point rate hike by the Bank of Bank didn't result in fresh gains for the pound. Although, there's so far been only a negligible reduction in the UK's massive trade deficit following sterling's depreciation after the Brexit vote. In fact, the deficit hit a record high in August. It is expected to narrow slightly in September.
Japanese machinery orders and BoJ summary of opinions eyed
The Bank of Japan kept monetary policy unchanged at its meeting this week, but with the last of the hawks now having left the Bank's board, the discussion appears to be shifting to whether further measures are needed to accelerate the journey towards reaching the 2% inflation target. The summary of opinions of the October meeting, due on Thursday, should provide some insight as to how far the discussions went on the dissenting board member's view to start targeting the yield on 15-year Japanese government bonds in addition to 10-year ones.
There will also be important data to watch in Japan next week, including machinery orders and wages. Machinery orders, a key gauge of capital expenditure, are expected to decline in September after strong growth in the prior two months. Meanwhile, pay data on Monday should reveal if wage growth gained further momentum in September after some signs of a pick-up in August, in a potential boost for the government's efforts to raise wages.
China data under spotlight after soft PMIs
PMI data on manufacturing and non-manufacturing activity out of China this week indicated the Chinese economy is slowing going into the fourth quarter of the year. Wednesday's trade figure will therefore be watched closely for further signs of a slowdown as export and import growth numbers are released. Producer and consumer price data will follow on Thursday. Producer prices jumped to 6.9% year-on-year in September, suggesting strong demand for raw materials. An easing of the producer price index in October could add to concerns that economic growth is moderating in the final three months of the year.
RBA and RBNZ to hold rates amid subdued inflation
The RBA is almost certain to keep its cash rate at 1.5% on Tuesday after inflation in Australia unexpectedly dipped in the third quarter and retail sales had their weakest quarter since 2010. Annual inflation has stood below the RBA's 2-3% target band for much of the past three years. Concerns about soaring household debt had significantly reduced the RBA's scope to cut rates below 1.5%, while more recently, persistently low inflation and signs that house price growth is slowing have pushed back expectations of when the Bank will begin to raise rates, with some analysts even predicting that the next move will be down. A stronger Australian dollar has also raised alarms at the RBA. The aussie is up about 6.5% against the greenback so far this year, even after its recent downwards correction. Tuesday's policy decision will be followed by the RBA's quarterly monetary policy outlook report on Friday.
Over in New Zealand, the RBNZ will also be holding a policy meeting amid market jitters about the new government's economic agenda. The decision in October by the kingmaker party, New Zealand First, to partner with Labour instead of the National party led to a sharp sell-off of the kiwi. The New Zealand dollar has slid by almost 5% against its US counterpart since that announcement on worries that the new Labour-led coalition's policies will harm growth. But there was some relief that the proposed reforms to the RBNZ did not include tampering with the inflation target or the exchange rate.
Next week's meeting will be the RBNZ's first with new acting governor Grant Spencer, who was assigned to the role temporarily as the timing of the appointment clashed with the general election in September. However, despite the new leadership at both the central bank and the government, there is unlikely to be a major shift in monetary policy, at least not just yet. This week's better-than-expected jobs data reminded investors that the fundamentals of the New Zealand economy remain strong even with the slightly lowered growth outlook. Hence, like the RBA, the RBNZ is expected to keep its cash rate unchanged, at 1.75%, and with the odds that the next move will likely be up than down.
Weekly Focus: Low Volatility in Markets – and in the Global Economy
Market Movers ahead
- We are heading for a very quiet week with no big movers in the US or Europe. In the UK, Brexit negotiations will continue on Thursday.
- China is due to release inflation and FX reserves data. We look for PPI inflation to stay high for now at 6.9% before heading lower next year. We expect CPI inflation to stay subdued at 1.7%.
- Japanese wage numbers will be interesting to watch. Wage growth has so far stayed low despite the strongest labour market in more than 20 years.
- In Sweden, the most important release will be the Riksbank minutes and Prospera inflation expectations.
- We estimate Norwegian core inflation rose slightly to 1.1% in October from 1.0% in September.
Global macro and market themes
- Volatility has continued to fall as central bank predictability is considered high and the macroeconomic outlook looks increasingly stable. We argue it bodes well for continued focus on 'carry' and 'hunt for yield'.
- 'Hunt for yield', ECB QE and a solid budget surplus also mitigate the upside pressure on German long yields from the macro economy.
- The IMF warns 'financial products tied to equity volatility [bought] by investors such as pension funds are creating unknown risks that could result in severe shock to financial markets'.
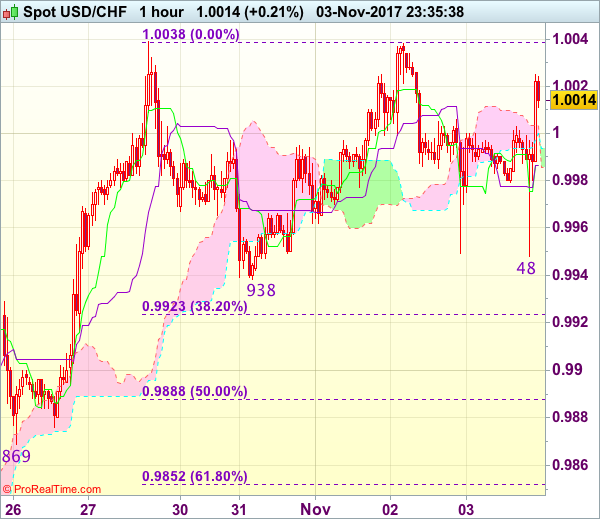
Trade Idea Wrap-up: USD/CHF – Hold long entered at 0.9950
USD/CHF - 1.0008
Most recent candlesticks pattern : N/A
Trend : Up
Tenkan-Sen level : 0.9987
Kijun-Sen level : 0.9987
Ichimoku cloud top : 1.0004
Ichimoku cloud bottom : 1.0000
Original strategy :
Bought at 0.9950, Target: 1.0050, Stop: 0.9930
Position : - Long at 0.9950
Target : - 1.0050
Stop : - 0.9930
New strategy :
Hold long entered at 0.9950, Target: 1.0050, Stop: 0.9930
Position : - Long at 0.9950
Target : - 1.0050
Stop : - 0.9930
Dollar’s retreat after faltering below indicated resistance at 1.0038 has retained our view that further consolidation below this level would be seen, however, still reckon downside would be limited to 0.9945-50 and bring another rise later. Above 1.0005-10 would bring retest of 1.0038 but break there is needed to confirm recent upmove from 0.9421 low has resumed and may extend further gain to 1.0050-55, then towards 1.0075-80 but price should falter below 1.0100 resistance.
In view of this, we are holding on to our long position entered at 0.9950. Below said support at 0.9938 would abort and signal top is formed instead, risk correction to 0.9920-23 (38.2% Fibonacci retracement of 0.9737-1.0038) but 0.9885-90 (50% Fibonacci retracement) should limit downside and support at 0.9869 would remain intact.
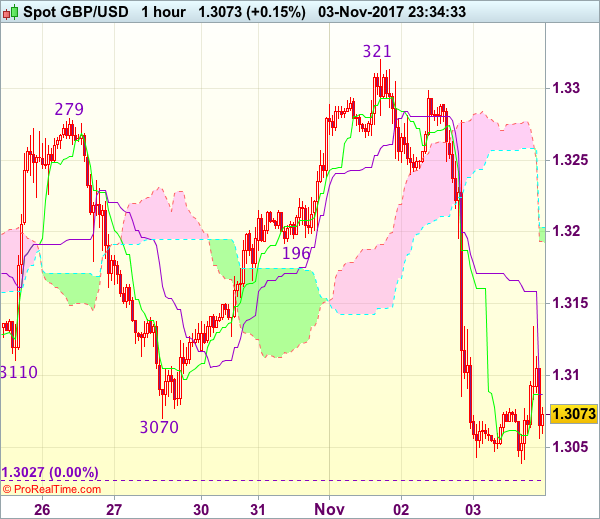
Trade Idea Wrap-up: GBP/USD – Sell at 1.3150
GBP/USD - 1.3072
Most recent candlesticks pattern : N/A
Trend : Near term down
Tenkan-Sen level : 1.3087
Kijun-Sen level : 1.3087
Ichimoku cloud top : 1.3203
Ichimoku cloud bottom : 1.3193
Original strategy :
Sell at 1.3150, Target: 1.3030, Stop: 1.3185
Position : -
Target : -
Stop : -
New strategy :
Sell at 1.3150, Target: 1.3030, Stop: 1.3185
Position : -
Target : -
Stop : -
Yesterday’s selloff together with the breach of support at 1.3070 signals early erratic rise from 1.3027 has ended and bearishness remains for further fall, however, break of said support at 1.3027 is needed to signal early downtrend has resumed for weakness to psychological support at 1.3000, then towards 1.2970-75 which is likely to hold from here due to near term oversold condition.
In view of this, would not chase this fall here and would be prudent to sell cable on recovery as 1.3150 should limit upside and bring another decline later. Above 1.3200 would defer and prolong choppy trading, risk rebound to 1.3235-40 first.
US Dollar Gains Despite Disappointing Jobs Report as Broader Picture Supports December Hike
The US dollar posted gains during today's European session, despite a disappointing October employment report, which did little in dissuading the market to expect a rate hike at the next Fed meeting.
In this week's major economic release, the US labor market rebounded less strongly than expected from the hurricane-induced slowdown of September. The economy created a net 261 thousand jobs during October, missing analyst forecasts of 310 thousand. There was a positive revision of the previous month's figures to +18 thousand from a contraction of 33 thousand. The other bit of positive news concerned the unemployment rate, which dipped further to 4.1% from the previous month's 4.2% – the lowest rate since 2001. However, average hourly earnings disappointed by coming in flat against expectations of a 0.2% month-on-month expansion. The yearly growth rate in hourly wages thus fell sharply – down to 2.4% from the previous month's slightly inflated 2.9%. The participation rate also disappointed as it fell to 62.7% from 63.1%. Overall the data certainly did not impress but nor did it create worries that there was a significant slowdown underway.
Other data supported the case for strong US economic growth. The huge services sector was doing very well in October according to the Institute for Supply Management (ISM), as the non-manufacturing PMI climbed to 62.2 – the highest since May. The expectation was for the index to ease back to 61 from September's 61.3 print. September factory orders also came in positive as they gained 1.4% month-on-month versus analyst expectations of a 1.3% gain. Finally, the trade deficit for September widened slightly to 43.5 billion dollars from 42.8 billion in August, but that was the result of the growth in imports outpacing slightly the growth in exports, which can be a positive indication for both the domestic and the global economy.
Euro/dollar initially rallied just after the release of the employment numbers, touching a high of 1.1689, but subsequently weakened to 1.1606 as the session progressed and traders assessed the impact of the data together with the other news. Dollar/yen also staged a strong rally, rising to 114.35 and getting ready to test the highs of the last 7 months around 114.45-50. The dollar's resurgence despite the weak employment data also stopped an attempt by sterling to rebound from yesterday's big losses. Pound/dollar dropped to 1.3066 after unsuccessfully trying to take on the 1.31 level earlier in the day.
There was also some good news concerning the pound as the UK services' PMI climbed to 55.6 in October from 53.6 the previous month. The PMIs released this week for the various sectors of the UK economy are pointing to decent growth of around 0.5% during the fourth quarter according to Markit, which would calm worries about a Brexit-induced economic slowdown.
The one currency that managed to recover strongly from recent losses against the US dollar was its northern neighbor, the Canadian dollar. USD/CAD dropped by more than 100 pips following the simultaneous release of positive Canadian employment figures at the same time as the US employment report was hitting the wires. It was a volatile day for the loonie as USD/CAD fell to as low as 1.2714 from around 1.2830 before the numbers were released. The greenback subsequently recovered to 1.2767. The Canadian economy created 35.3 thousand jobs in October while economists were expecting around 15 thousand new jobs. On the other hand, the unemployment rate rose slightly to 6.3% from 6.2%, but traders seemed to place more emphasis on the number of jobs created.
Following three very busy days for the US dollar that included the Fed meeting, the announcement of the nominee for the post of new Fed chair and the all-important nonfarm payrolls, market participants will now be focusing on the tax cut package that Trump and the Republicans are working on. The other week will likely involve digestion of recent events, as the calendar for the major economies will be relatively more light.
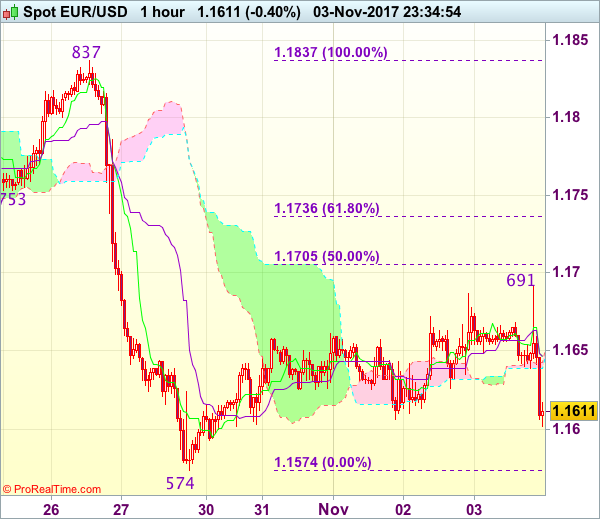
Trade Idea Wrap-up: EUR/USD – Sell here
EUR/USD - 1.1620
Most recent candlesticks pattern : N/A
Trend : Down
Tenkan-Sen level : 1.1647
Kijun-Sen level : 1.1647
Ichimoku cloud top : 1.1643
Ichimoku cloud bottom : 1.1639
Original strategy :
Sell at 1.1705, Target: 1.1605, Stop: 1.1740
Position : -
Target : -
Stop : -
New strategy :
Sell at market level, Target: 1.1520, Stop: 1.1655
Position : -
Target : -
Stop : -
As the single currency ran into renewed selling interest at 1.1691 and has retreated sharply, suggesting an intra-day top is formed there and consolidation with downside bias is seen for weakness to last week’s low at 1.1574, however, break there is needed to confirm recent decline has resumed and extend weakness to 1.1520-25, then 1.1500 but near term oversold condition should prevent sharp fall below latter level.
In view of this, we are looking to sell euro here for such decline. Above 1.1650-55 would risk another bounce to 1.1691, however, only break there would abort and suggest further choppy trading above 1.1574 and bring a stronger rebound to 1.1700-05 but upside should be limited to previous support at 1.1725 (now resistance).
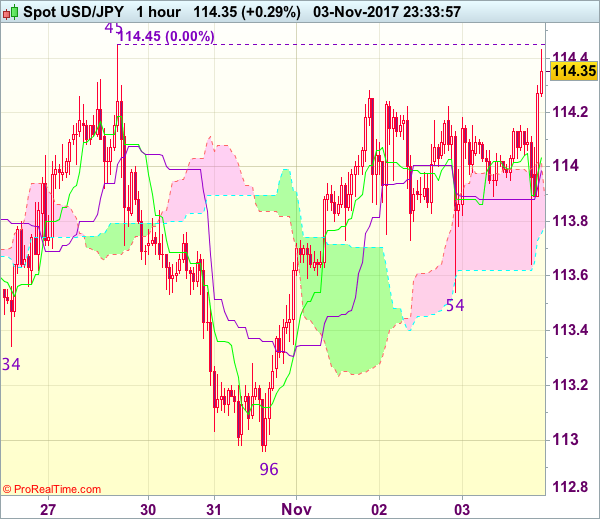
Trade Idea Wrap-up: USD/JPY – Buy at 113.80
USD/JPY - 114.34
Most recent candlesticks pattern : N/A
Trend : Near term up
Tenkan-Sen level : 114.04
Kijun-Sen level : 114.02
Ichimoku cloud top : 113.99
Ichimoku cloud bottom : 113.76
Original strategy :
Buy at 113.40, Target: 114.30, Stop: 113.05
Position : -
Target : -
Stop : -
New strategy :
Buy at 113.80, Target: 114.80, Stop: 113.45
Position : -
Target : -
Stop : -
Although the greenback rebounded after finding support at 113.54 and gain to resistance at 114.45-50 cannot be ruled out, break of this tough level is needed to retain bullishness and confirm early upmove has resumed for headway to 114.75-80 and later towards 115.00 but overbought condition should limit upside. If said resistance continues to hold, then further consolidation would take place and another retreat to 113.40-45 cannot be ruled out but 113.15-20 should hold, bring another rise.
In view of this, we are looking to buy dollar on pullback as 113.80 should limit downside and bring another rise later. Below support at 113.54 would abort and prolong consolidation, risk weakness to 113.20-25, however, reckon support at 112.96 would remain intact, bring another rise next week.